Full Length Article

Spatiotemporal evolution and influencing factors of urban resilience in the Yellow River Basin, China

  • JI Xiaomei a, b ,
  • NIE Zhilei , a, c, * ,
  • WANG Kaiyong d ,
  • XU Mingxian a, b ,
  • FANG Yuhao a, c
Expand
  • aQilu University of Technology (Shandong Academy of Sciences), Jinan, 250100, China
  • bScience and Technology Service Platform of Shandong Academy of Sciences (Pioneer Park for Overseas Students of Shandong Academy of Sciences), Jinan, 250100, China
  • cInstitute of Science and Technology for Development of Shandong, Jinan, 250014, China
  • dInstitute of Geographic Sciences and Natural Resources Research, Chinese Academy of Sciences, Beijing, 100101, China
* E-mail address: (NIE Zhilei)

Received date: 2023-08-31

  Revised date: 2024-04-18

  Accepted date: 2024-08-22

  Online published: 2025-08-14

Abstract

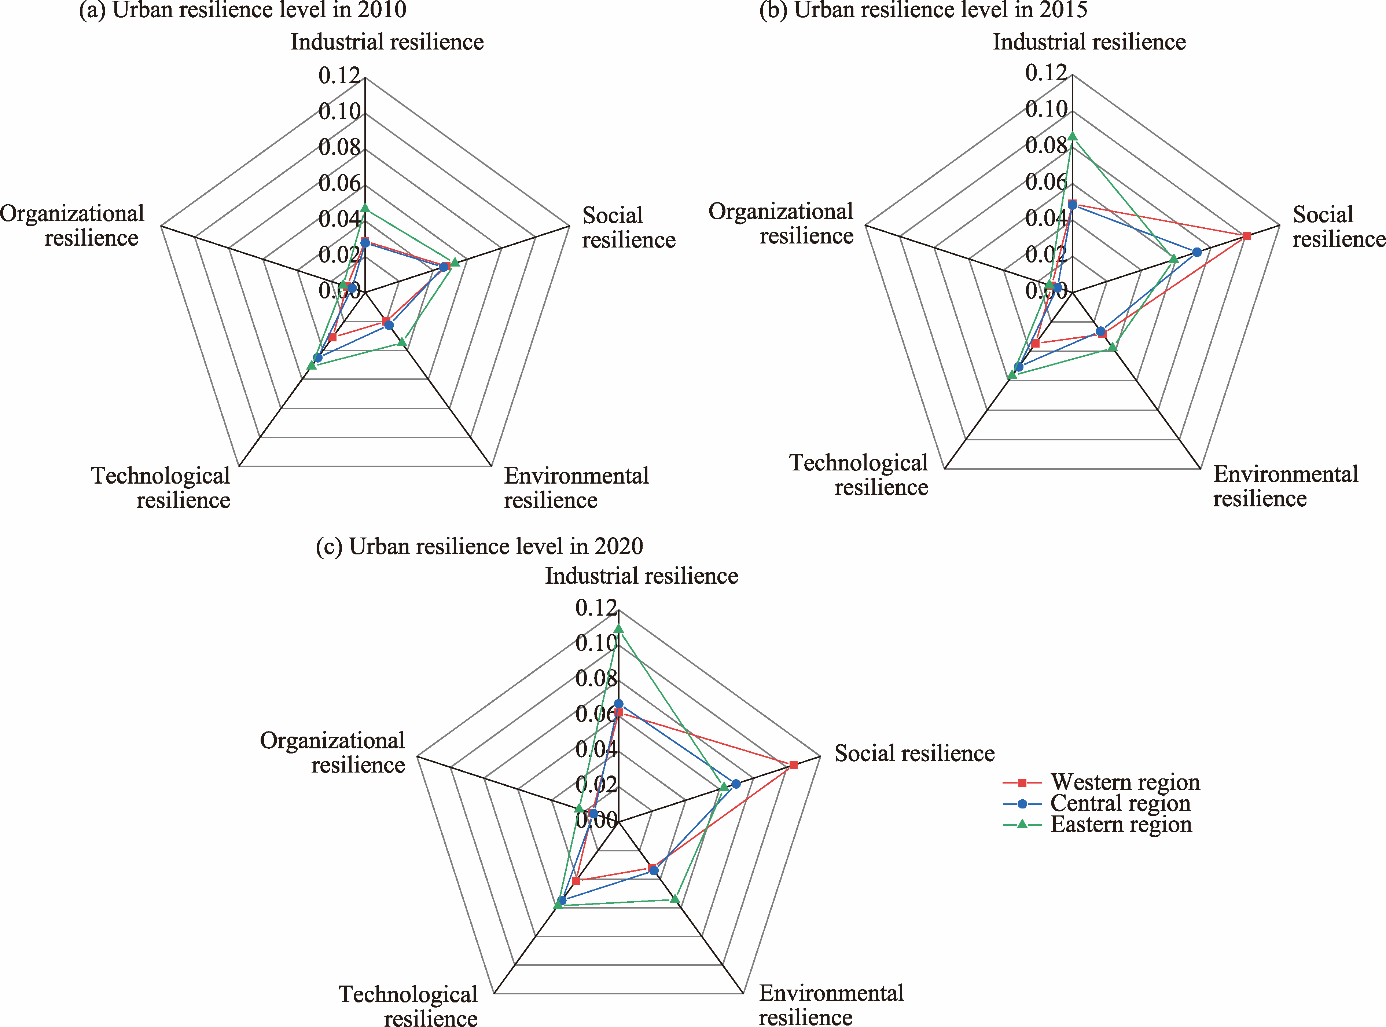
The Yellow River Basin of China is a key region that contains myriad interactions between human activities and natural environment. Industrialization and urbanization promote social-economic development, but they also have generated a series of environmental and ecological issues in this basin. Previous researches have evaluated urban resilience at the national, regional, urban agglomeration, city, and prefecture levels, but not at the watershed level. To address this research gap and elevate the Yellow River Basin’s urban resilience level, we constructed an urban resilience evaluation index system from five dimensions: industrial resilience, social resilience, environmental resilience, technological resilience, and organizational resilience. The entropy weight method was used to comprehensively evaluate urban resilience in the Yellow River Basin. The exploratory spatial data analysis method was employed to study the spatiotemporal differences in urban resilience in the Yellow River Basin in 2010, 2015, and 2020. Furthermore, the grey correlation analysis method was utilized to explore the influencing factors of these differences. The results of this study are as follows: (1) the overall level of urban resilience in the Yellow River Basin was relatively low but showed an increasing trend during 2010-2015, and significant spatial distribution differences were observed, with a higher resilience level in the eastern region and a low-medium resilience level in the western region; (2) the differences in urban resilience were noticeable, with industrial resilience and social resilience being relatively highly developed, whereas organizational resilience and environmental resilience were relatively weak; and (3) the correlation ranking of resilience influencing factors was as follows: science and technology level>administrative power>openness>market forces. This research can provide a basis for improving the resilience level of cities in the Yellow River Basin and contribute to the high-quality development of the region.

Cite this article

JI Xiaomei , NIE Zhilei , WANG Kaiyong , XU Mingxian , FANG Yuhao . Spatiotemporal evolution and influencing factors of urban resilience in the Yellow River Basin, China[J]. Regional Sustainability, 2024 , 5(3) : 100159 . DOI: 10.1016/j.regsus.2024.100159

1. Introduction

Recently, with the growth of urban populations and climate change, disruptive events, such as natural disasters, man-made disasters, and extreme weather disturbances, have occurred frequently. Improving the ability of cities to respond to risk has become a trend. The Yellow River Basin of China is a key area where human activities interact with natural environment. Industrialization and urbanization have promoted socioeconomic development in the basin, but have also caused a series of environmental pollution, soil erosion, and ecological vulnerability concerns. In October 2020, the “Suggestions for Formulating the Fourteenth Five-Year Plan for National Economic and Social Development and Long-term Goals for 2035” initiative proposed the construction of “urban resilience”, emphasizing the necessity to strengthen urban governance and risk prevention and control. In October 2021, the “Outline of Ecological Protection and High-quality Development Plan in the Yellow River Basin” proposed the comprehensive promotion of modernization of the environmental governance system and governance capacity in the Yellow River Basin; this approach may enhance urban resilience of the basin, which is vital for promoting high-quality development within the region. The Yellow River Basin is an important economic region in China, and its urban resilience is a necessary component for ensuring the sustainable development of the basin. The climate, natural environment, economic structure, and social culture of the Yellow River Basin have unique characteristics that substantially impact urban resilience. Research on urban resilience in the basin can provide a scientific basis for ecological protection, economic development, and social stability and ensure the region’s sustainable development. By studying urban resilience in the Yellow River Basin, we can gain a deeper understanding of the relationship between cities and natural environment and provide a reference for future urban planning and construction.
The concept of “resilience” originated from the Latin word “resilio”, meaning to restore to an original state. This term was first applied in the field of ecology and has evolved into engineering, ecological, and social-ecological resilience (Holling, 1973; Berkes and Folke, 1998; Carpenter et al., 2001). After its introduction to China, “resilience” was translated into “elasticity”, “restoring force”, and “resilience”, and later combined with the concept of urban resilience. Scholars have mainly researched the connotation, development, and evolution of urban resilience, as well as its evaluation and influencing factors. The Resilience Alliance believes that urban resilience is a city’s ability to absorb external disturbances and maintain its original functions, structure, and characteristics (Resilience Alliance, 2007). The Rockefeller Foundation defines urban resilience as the ability of individuals, communities, institutions, industries, and other systems to survive, adapt, and develop when faced with external shocks (Spaans and Waterhout, 2017). Chinese scholars have defined urban resilience within various disciplines. In urban planning, Shao and Xu (2015) defined urban resilience as the ability of urban systems or regions to respond to uncertain disturbances through sensible preparation, buffering, and response. From an economic perspective, Ding et al. (2020) defined urban resilience as the resistance, resilience, adjustment, and transformation ability of the economy in the face of impacts. Tao (2022) proposed that the construction of urban resilience in China should have characteristics, such as diversity and functional interaction, versatility and flexibility, humanization and substitution, predictability, and collaboration.
Both domestic and foreign scholars have conducted extensive research on the measurement and evaluation of urban resilience. Research on urban resilience has mainly focused on its impact and pressure points (Maru et al., 2021), constructing a mixed complex system model of urban socio-physical properties, comparing values before and after disasters, and introducing efficiency indicators to measure urban resilience (Cavallaro et al., 2014). Chen et al. (2019) discussed the dimensions and measurement methods of urban resilience and compared them using multiple case studies. Urban resilience assessments in China generally fall into three categories: resilience elements, characteristics, and processes (Ni and Lai, 2021). Indicator systems based on resilience elements generally include economy, society, ecology, and infrastructure. Chen et al. (2020) has constructed an assessment indicator system for the resilience of mega-cities based on the “ecology-economy-social engineering” evaluation framework. Feofilovs and Romagnoli (2021) simulated urban resilience based on a system dynamics model to evaluate urban resilience to natural disasters.
Urban resilience and its changes are influenced by various factors. Zhu and Sun (2020) selected factors closely related to urban resilience based on five aspects: government, market, technology, openness, and finance. Song and Dong (2022) evaluated the factors influencing urban economic resilience from three perspectives: diversification, policy systems, and social factors. Ji et al. (2022) attributed the factors influencing urban resilience to internal city investment and analyzed their impact mechanisms from the perspectives of human resources, capital, and technological investment. In terms of research methods, spatial econometric model, barrier model, and geographic detector method are often used, and some scholars have used geographic detector method to analyze the interactions of influencing factors. Owing to an insignificant spatial correlation, Gao and Ding (2021) adopted a panel regression rather than a spatial econometric analysis to study the factors influencing urban resilience in the northwest region of China. Wang and Zhu (2021) used the geographic detector method and a panel regression analysis to determine the influencing factors and strength of urban economic resilience.
In recent years, the academic community has emphasized the differences between urban resilience and sustainable urban development (Chelleri and Baravikova, 2021). This study believes that these two concepts are not equivalent but are nonetheless interconnected. The sustainable development of a city is inseparable from urban resilience, which is an important component of sustainable development. Urban resilience, by enhancing the resilience, adaptability, and recovery capabilities of cities, protects the stability and development of urban ecological, economic, and social systems; moreover, it incorporates the principles of sustainable development into urban planning, construction, and management, promoting sustainability. Sustainable urban development provides guidance and support for urban resilience, enhances a city’s ability to adapt to climate change, and promotes low-carbon development and energy transition to mitigate urban environmental pressures. Thus, urban resilience and sustainable development are complementary.
In summary, numerous related studies on urban resilience have emerged, providing a sufficient theoretical basis for subsequent research. A summary of existing research is made in this study, and shortcomings and improvements are proposed. Firstly, the existing research on urban resilience is comprehensive, including at the national, regional, urban agglomeration, city, and prefecture levels, but there is a lack of research on resilience at the watershed level. Secondly, research on urban resilience in China is becoming increasingly diverse, shifting from a single-disciplinary perspective to multidisciplinary and interdisciplinary research perspectives. Qualitative research was conducted primarily in the initial stages. Currently, research on urban resilience in China has shifted from theory to empirical analysis, analyzing how cities can resist external interference and measuring their resilience capacity. Thirdly, with the cross-integration of different disciplines and the reference of research methods from different fields, existing evaluation methods show diverse characteristics. The most common is the indicator system evaluation method, which lays the foundation for the study of urban resilience evaluation in the Yellow River Basin. Econometric methods are often used to study influencing factors that are easily affected by collinearity between variables, leading to unstable model results.
To improve the resilience level of cities in the Yellow River Basin and promote high-quality development of the Yellow River Basin, in this study, we constructed an urban resilience evaluation index system based on a combination of resilience elements and characteristics, measured the resilience level of cities in the Yellow River Basin, analyzed the spatiotemporal distribution characteristics of urban resilience level using the exploratory spatial data analysis method, and identified the influencing factors of urban resilience using the grey correlation analysis method.

2. Study area and research methods

2.1. Study area and data sources

2.1.1. Overview of the study area

The Yellow River originates in the Bayan Har Mountains in Qinghai Province of China, and traverses four geomorphic units: the Qinghai-Xizang Plateau, Inner Mongolian Plateau, Loess Plateau, and Huang-Huai-Hai Plain. From west to east, it passes through Qinghai Province, Sichuan Province, Gansu Province, Ningxia Hui Autonomous Region, Inner Mongolia Autonomous Region, Shaanxi Province, Shanxi Province, Henan Province, and Shandong Province (Table 1).
Table 1 Regional scope of the Yellow River Basin.
Province or autonomous region City
Qinghai Province Xining City
Gansu Province Jiuquan, Jiayuguan, Zhangye, Jinchang, Wuwei, Baiyin, Lanzhou, Dingxi, Tianshui, Longnan, Qingyang, and Pingliang cities
Ningxia Hui Autonomous Region Yinchuan, Shizuishan, Wuzhong, Guyuan, and Zhongwei cities
Inner Mongolia Autonomous Region Wuhai, Ordos, Bayannur, Baotou, Hohhot, and Ulanqab cities
Shaanxi Province Xi’an, Tongchuan, Baoji, Hanzhong, Ankang, Shangluo, Xianyang, Weinan, Yan’an, and Yulin cities
Shanxi Province Taiyuan, Datong, Shuozhou, Xinzhou, Lvliang, Linfen, Jincheng, Jinzhong, Changzhi, Yuncheng, and Yangquan cities
Henan Province Zhengzhou, Luoyang, Sanmenxia, Nanyang, Zhumadian, Zhoukou, Xinyang, Xinxiang, Anyang, Shangqiu, Hebi, Puyang, Jiaozuo, Kaifeng, Pingdingshan, Xuchang, and Luohe cities
Shandong Province Jinan, Heze, Liaocheng, Dezhou, Jining, Zaozhuang, Linyi, Tai’an, Weifang, Dongying, Zibo, Binzhou, Rizhao, Qingdao, Yantai, and Weihai cities

Note: Haidong City in Qinghai Province and Aba Tibetan and Qiang Autonomous Prefecture in Sichuan Province in the Yellow River Basin are not included in this study due to a severe lack of data.

The main issues in urban development in the Yellow River Basin are as follows. Firstly, the level of economic and social development in the Yellow River Basin lags behind the national average. In 2022, only Shandong Province (86,000 CNY per capita) and Inner Mongolia Autonomous Region (96,000 CNY per capita) had a gross domestic product (GDP) per capita higher than the national average (85,700 CNY per capita) (National Bureau of Statistics of China, 2023). The lowest value was in Gansu Province, with a GDP per capita of less than half of the national average. Secondly, with global warming, the water volume in the middle and low-medium reaches of the Yellow River has decreased yearly, and improvements to water-saving and environmental protection technologies remain necessary. Thirdly, the ecological environment quality on the Loess Plateau is deteriorating, with severe vegetation destruction and soil erosion. Lastly, the scale of cities continues to expand, with the population increasing yearly. In 2020, the permanent resident population of 78 cities in the basin was approximately 3.14×10⁸ (National Bureau of Statistics of China, 2021), accounting for one-fourth of the country’s total population; however, the basin’s urban carrying capacity is limited. Overall, there remains considerable room for improvement in the economic, ecological, and infrastructure resilience of the Yellow River Basin.

2.1.2. Data sources

The original data for this study were acquired from China Statistical Yearbook for Regional Economy (National Bureau of Statistics of China, 2011a, 2016a, 2021a), China City Statistical Yearbook (National Bureau of Statistics of China, 2011b, 2016b, 2021b), China Urban-Rural Construction Statistical Yearbook (Ministry of Housing and Urban-rural Development of China, 2011, 2016, 2021), and their corresponding databases. Data on urban resilience levels of each province or autonomous region were collected from Qinghai Statistical Yearbook (Qinghai Provincial Bureau of Statistics, 2011, 2016, 2021), Gansu Development Yearbook (Gansu Provincial Bureau of Statistics, 2011, 2016, 2021), Ningxia Statistical Yearbook (Ningxia Autonomous Region Bureau of Statistics, 2011, 2016, 2021), Inner Mongolia Statistical Yearbook (Inner Mongolia Autonomous Region Bureau of Statistics, 2011, 2016, 2021), Shaanxi Statistical Yearbook (Shaanxi Provincial Bureau of Statistics, 2011, 2016, 2021), Shanxi Statistical Yearbook (Shanxi Provincial Bureau of Statistics, 2011, 2016, 2021), Henan Statistical Yearbook (Henan Provincial Bureau of Statistics, 2011, 2016, 2021), and Shandong Statistical Yearbook (Shandong Provincial Bureau of Statistics, 2011, 2016, 2021). Owing to a severe lack of data in Haidong City of Qinghai Province and Aba Tibetan and Qiang Autonomous Prefecture of Sichuan Province, we excluded them to ensure the integrity and consistency of data analysis. In this study, we ultimately selected 78 cities in the Yellow River Basin and collected and processed indicator data in 2010, 2015, and 2020 for analysis purposes. The scope of the data was unified for the entire city rather than the municipal jurisdiction for the following reasons: urban resilience reflects a city’s self-defense ability, disaster resistance ability, and ability to face external interference, and should fall within the scope of the urban functional area, including all administrative regions of the city. Owing to limitations in data sources, citywide data were replaced by data from municipal districts, and the null data of some years were filled by regression fitting using the interpolation method.

2.2. Indicator system construction

Urban resilience involves five dimensions: industrial resilience, social resilience, environmental resilience, technological resilience, and organizational resilience. By combining the elements and characteristics of urban resilience, we selected 18 indicators to evaluate the resilience levels of cities in the Yellow River Basin (Table 2). Urban resilience is a key factor in the sustainable development of cities, and weight quantification is an effective method for measuring urban resilience. Analyzing the resilience levels of cities in different geographical locations within the same region can enhance their ability to resist disasters, promote comprehensive urban development, and reflect the efficiency of urban resource utilization, resource flow capacity, resource allocation capacity, and transportation and energy operations of the city. The carrying capacity and operational efficiency of water and other infrastructure as well as the stability and reliability of these infrastructure types are crucial in developing city resilience. Because they reflect the industrial structure and economic vitality of a city, these factors directly affect the city’s economic development and competitiveness and are vital to developing city resilience. Therefore, using weights to quantify urban resilience is a method that comprehensively considers various factors, such as urban resources, infrastructure, industry, and economy, which can provide strong support for the sustainable development of cities.
Table 2 Urban resilience assessment indicator system for the Yellow River Basin.
Target level Element Layer Indicator layer Weighting Measuring characteristic Unit
Integrated urban resilience Industrial resilience Economic redundancy 0.035 Redundancy CNY
Proportion of added value in the tertiary industry 0.024 Efficiency %
General fiscal budget revenue 0.133 Stability CNY
Per capita disposable income of urban residents 0.054 Adaptability CNY
Social
resilience
Population density 0.019 Stability persons/km2
Number of healthcare beds per capita 0.014 Redundancy sheet/person
Urban registered unemployment rate 0.059 Stability %
Level of social and medical coverage 0.056 Stability %
Environmental resilience Area of park green space per capita 0.027 Redundancy m2
Green space coverage in built-up areas 0.005 Efficiency %
Urban sewage treatment capacity 0.004 Adaptability -
Domestic waste treatment capacity 0.119 Adaptability -
Technological resilience Area of roads per capita 0.042 Redundancy m2
Density of drainage pipes in built-up areas 0.037 Redundancy km/km2
Gas penetration rate 0.008 Efficiency %
Proportion of urban construction land 0.138 Adaptability %
Organizational resilience Proportion of employees in public administration and social organizations 0.028 Organizational %
Investment in the construction of municipal utilities 0.200 Adaptability CNY

Note: - means dimensionless. Weights were calculated using the entropy weight method.

Industrial resilience is mainly manifested in the efficient utilization of funds by urban industrial economic systems in the face of shocks, which ensures sustainable economic development under external disturbances. Four indicators were selected to measure this metric, including economic redundancy, the proportion of added value in the tertiary industry, general fiscal budget revenue, and per capita disposable income of urban residents. Economic redundancy reflects the degree to which GDP per capita is higher than the national average. The proportion of added value in the tertiary industry (Bozza et al., 2015; Fang et al., 2016) shows the efficiency of economy from the perspective of industrial structure. General fiscal budget revenue (Nathwani et al., 2019) and per capita disposable income of urban residents (Nathwani et al., 2019) measure the level of economic strength from the perspectives of the government and individuals, respectively, which to an extent indicate the stability and adaptability of economy (He et al., 2022).
Social resilience refers to a city’s ability to protect and develop itself in the event of a disaster. This resilience type constitutes the link between social structure and development and reflects the resilience and stability of a city (Li and Liu, 2022). Four indicators were selected to measure social resilience, including population density (Zhao et al., 2021), the number of healthcare beds per capita (Zhang et al., 2019a), urban registered unemployment rate (Soufi et al., 2022), and level of social and medical coverage (Zhao et al., 2022).
The urban environment is an ecosystem that integrates human social production and life and has certain requirements for developing and maintaining a city’s urban water environment, air quality, and green space. Four indicators were selected to evaluate environmental resilience: the area of park green space per capita (Fang et al., 2016; Sun et al., 2017; He et al., 2018), green space coverage in built-up areas (Lu et al., 2022; Sun et al., 2024), urban sewage treatment capacity (Lu et al., 2022), and domestic waste treatment capacity.
Infrastructure refers to urban engineering infrastructure, including energy supply, drainage, road traffic, communication, environmental sanitation, and urban disaster prevention systems. Technological resilience refers to the ability of engineering infrastructure to resist and recover when a city is facing a crisis. Four indicators were selected to evaluate this metric, including the area of roads per capita (He et al., 2018), density of drainage pipes in built-up areas (Dong et al., 2020), gas penetration rate, and the proportion of urban construction land.
The resilience of a city’s organizational system reflects the soft power of the city and the resilience of the subjective aspects (Xu et al., 2019). Two indicators were selected to evaluate organizational resilience, including the proportion of employees in public administration and social organizations (Fang et al., 2016; Nathwani et al., 2019) and the investment in the construction of municipal utilities (Cheng and Liu, 2023).

2.3. Methods

2.3.1. Entropy weight method

The entropy weight method was used to assign weights to the evaluation indicators (Zhang et al., 2023) of urban resilience level in the Yellow River Basin, which avoided the interference of subjective factors on the weight and ensured that the evaluation results as objective and scientific as possible (Wang and Lee, 2009). The calculation steps are as follows.
(1) Standardized data. Owing to the large differences in the magnitude and order of magnitude of the selected data, we first standardized the data for extreme differences (Sun et al., 2020; Wang et al., 2020).
Positive indicators: ${{z}_{ij}}=\frac{{{x}_{ij}}-{{x}_{\min }}}{{{x}_{\max }}-{{x}_{\min }}}$,
Negative indicators: ${{z}_{ij}}=\frac{{{x}_{\max }}-{{x}_{ij}}}{{{x}_{\max }}-{{x}_{\min }}}$,
where zij is the normalized value; xij is the original data; xmin is the standardized minimum value of the ith sample under the jth indicator; and xmax represents the standardized maximum value of the ith sample under the jth indicator.
(2) The indicator’s information entropy was calculated as follows:
${{p}_{ij}}=\frac{{{z}_{ij}}}{\sum\limits_{i=1}^{n}{{{z}_{ij}}}}$,
where pij is the proportion of the ith city to the whole under the jth indicator (%); n is the total number of cities; and i is the ith city.
${{e}_{j}}=-k\sum\limits_{i=1}^{n}{{{p}_{ij}}\ln ({{p}_{ij}})},\text{ }j=(1,\text{ }...,\text{ }m)$,
$k=\frac{1}{\ln (n)}$,
where ej is the information entropy of the jth indicator satisfying ej≥0; k is a calculated coefficient; j is the jth urban resilience indicator; and m is the number of indicators.
(3) Indicator weights were determined as follows:
${{d}_{j}}=1-{{e}_{j}},\text{ }j=(1,\text{ }...,\text{ }m)$,
${{w}_{j}}={{{d}_{j}}}/{\sum\limits_{j=1}^{m}{{{d}_{j}}}}\;$,
where dj represents the information entropy redundancy; and wj is the weight of each indicator.

2.3.2. Exploratory spatial data analysis method

The exploratory spatial data analysis method was used to evaluate the spatiotemporal evolution of urban resilience level in the Yellow River Basin. First, the Jenks natural breakpoint method was used to classify urban resilience level indices in 2010, 2015, and 2020 into five types and analyze the changing trend of the urban resilience development level. The global Moran index was utilized to reflect the global spatial correlation of urban areas (Zhang et al., 2022). Therefore, we used the global Moran index to reflect the global spatial correlation of urban resilience in the Yellow River Basin.
The global Moran index determines the existence of spatial correlation in the region and is used to describe the average degree of correlation of all spatial units with their surrounding areas over the entire region (Liu et al., 2024), which can be calculated using the following formulas (Zhang et al., 2019b):
$I=\frac{N}{S_0} \times \frac{\sum_{i^{\prime}=1}^N \sum_{j^{\prime}=1}^N w_{i^{\prime} j^{\prime}}\left(y_{i^{\prime}}-\bar{y}\right)\left(y_{j^{\prime}}-\bar{y}\right)}{\sum_{i^{\prime}=1}^N\left(y_{i^{\prime}}-\bar{y}\right)^2}$,
$S_0=\sum_{i^{\prime}=1}^N \sum_{j^{\prime}=1}^N w_{i^{\prime} j^{\prime}}$,
where I is a rational number whose value is between –1.0 and 1.0; N is the total number of spatial units; S0 is the total weight of indicators; i' and j' denote the space units; wi'j' is the spatial weight value; yi' and yj' represent the attribute values of the spatial units; and $\bar{y}$ is the mean value of the attributes of all spatial units.

2.3.3. Grey correlation analysis method

We used the grey correlation analysis method to analyze the factors affecting the resilience level of cities in the Yellow River Basin. The grey correlation analysis method determines how is the link strength of different series based on the similarity degree of the series curve (Deng, 1990), and is used to solve problems with limited data and uncertainty (Li et al., 2023). A gray correlation model was used to explore the factors influencing urban resilience. The higher the grayscale correlation, the greater the impact on urban resilience. In this study, the openness, market forces, administrative power, and science and technology level were selected as the factors influencing urban resilience, and their correlations were calculated using SPSS software (IBM Company, New York, the USA). The calculation process is as follows.
(1) Determination of reference and comparison sequences. The reference series was urban resilience level value, which is expressed as x0, and the filtered influencing factors were used as the comparison series xi'' (i''=0, 1, 2, …).
(2) Variable normalization process. Owing to the different magnitudes of the influencing factors, raw data must be standardized when performing a grey correlation analysis.
(3) Calculation of correlation using the following equations:
$S_{i^{\prime \prime} k^{\prime \prime}}=\frac{\min _{i^{\prime \prime}} \min _{k^{\prime \prime}}\left|x_{0 k^{\prime \prime}}-x_{i^{\prime \prime} k^{\prime \prime}}\right|+\sigma \max _{i^{\prime \prime}} \max _{k^{\prime \prime}}\left|x_{0 k^{\prime \prime}}-x_{i^{\prime \prime} k^{\prime \prime}}\right|}{\left|x_{0 k^{\prime \prime}}-x_{i^{\prime \prime} k^{\prime \prime}}\right|+\sigma \max _{i^{\prime \prime}} \max _{k^{\prime \prime}}\left|x_{0 k^{\prime \prime}}-x_{i^{\prime \prime} k^{\prime \prime}}\right|}$,
$r_{i^{\prime \prime}}=\frac{1}{n} \sum_{k^{\prime \prime}=1}^{n} S_{i^{\prime \prime} k^{\prime \prime}}$,
where Si''k'' is the correlation coefficient; x0k'' and xi''k'' are the values of reference sequence and comparison sequence, respectively; min min is the minimum difference of these two sequence in k'' year; max max is the maximum difference of these two sequence in k'' year; i'' is the value of each influencing factor; σ is resolution coefficient, and usually the value is 0.5; and ri'' is the correlation of each influencing factor.

3. Results

3.1. Temporal evolution of urban resilience in the Yellow River Basin

Based on an evaluation using the entropy weight method for urban resilience, we obtained the resilience scores of 78 cities in the Yellow River Basin in 2010, 2015, and 2020. The overall resilience level of cities in the Yellow River Basin showed an increasing trend, rising from 0.154 in 2010 to 0.224 in 2015, and further to 0.261 in 2020.
The 78 cities in the Yellow River Basin were divided into eastern (including 16 cities in Shandong Province), central (including 11 cities in Shanxi Province and 17 cities in Henan Province), and western (1 city in Qinghai Province, 12 cities in Gansu Province, 5 cities in Ningxia Hui Autonomous Region, 6 cities in Inner Mongolia Autonomous Region, and 10 cities in Shaanxi Province) regions. Figure 1 shows the changes in urban resilience levels across the three regions in 2010, 2015, and 2020. In 2010 and 2015, urban resilience level was higher in the eastern region than in the central and western regions. With continuous development through scientific management and urban systems, the comprehensive resilience of cities in the western region matched that in the central region by 2020. Regarding the distribution of urban resilience (Fig. 1), the western region exhibited a relatively prominent social resilience, with a continuous increase in urban resilience levels during the study period, but a relatively weaker organizational resilience, which has shown limited improvement in recent years. The distribution of urban resilience in the central region was relatively balanced; however, the overall level was not high. The industrial resilience in the eastern region was notable, whereas the other resilience showed relatively slow growth. The overall organizational resilience level in the basin was low and had ample room for improvement compared with industrial and social resilience.
Fig. 1. Changes in urban resilience levels in the eastern, central, and western regions of the Yellow River Basin in 2010 (a), 2015 (b), and 2020 (c).

3.2. Spatial evolution of urban resilience in the Yellow River Basin

Based on the comprehensive resilience level values of the studied cities, we used the natural breakpoint method to classify the 78 cities into 5 urban resilience levels. The natural breakpoint method comprehensively considers various factors, such as a city’s disaster resistance and recovery capabilities, thereby accurately reflecting the actual situation of urban resilience in the Yellow River Basin and providing a reference for urban planning and sustainable development. The five urban resilience levels were low (0.076-0.156), low-medium (0.157-0.215), medium (0.216-0.279), high (0.280-0.396), and very high (0.397-0.655). Using ArcGIS 10.7 software (ESRI Company, California, the USA), we created a spatial distribution map of urban resilience levels in the Yellow River Basin to analyze the evolutionary characteristics of urban resilience patterns in 2010, 2015, and 2020.
Based on the horizontal spatial analysis, there was a clear spatial heterogeneity in urban resilience levels of cities in the Yellow River Basin. Overall, urban resilience levels showed a pattern of high in the eastern region and low in the western region, with the middle and low-medium reaches having a significantly higher heterogeneity than the upper reaches. This dynamic formed a polarization trend where the Shandong Peninsula urban agglomeration and the eastern provincial capital cities exhibited a relatively strong resilience, whereas the surrounding cities were relatively weaker in resilience. In the central and western regions, urban resilience development was slower, with provincial capital cities playing a central role and forming a distinct “central-peripheral” structure with adjacent cities (Table 3).
Table 3 Spatiotemporal evolution of urban resilience in the Yellow River Basin.
Province or autonomous region City Urban resilience Province or autonomous region City Urban resilience
2010 2015 2020 2010 2015 2020
Qinghai Province Xining City 0.217
(M)
0.246
(M)
0.244
(M)
Inner Mongolia Autonomous Region Wuhai City 0.162
(LM)
0.193
(LM)
0.211
(LM)
Gansu Province Jiuquan City 0.129
(L)
0.201
(LM)
0.226
(M)
Ordos City 0.267
(M)
0.308
(H)
0.312
(H)
Jiayuguan City 0.153
(L)
0.244
(M)
0.291
(VH)
Bayannur City 0.139
(L)
0.179
(LM)
0.162
(LM)
Zhangye City 0.125
(L)
0.222
(M)
0.230
(M)
Baotou City 0.192
(LM)
0.260
(M)
0.238
(M)
Jinchang City 0.111
(L)
0.208
(LM)
0.228
(M)
Hohhot City 0.188
(LM)
0.257
(M)
0.263
(M)
Wuwei City 0.091
(L)
0.184
(LM)
0.225
(M)
Ulanqab City 0.121
(L)
0.178
(LM)
0.197
(LM)
Baiyin City 0.099
(L)
0.188
(LM)
0.203
(LM)
Henan Province Zhengzhou City 0.279
(M)
0.449
(VH)
0.633
(VH)
Lanzhou City 0.155
(L)
0.327
(VH)
0.347
(VH)
Luoyang City 0.197
(LM)
0.230
(M)
0.313
(H)
Dingxi City 0.086
(L)
0.188
(LM)
0.211
(LM)
Sanmenxia City 0.139
(L)
0.143
(L)
0.167
(LM)
Tianshui City 0.098
(L)
0.183
(LM)
0.210
(LM)
Nanyang City 0.120
(L)
0.174
(LM)
0.200
(LM)
Longnan City 0.076
(L)
0.166
(LM)
0.210
(LM)
Zhumadian City 0.122
(L)
0.149
(L)
0.191
(LM)
Qingyang City 0.097
(L)
0.196
(LM)
0.222
(M)
Zhoukou City 0.110
(L)
0.166
(LM)
0.187
(LM)
Pingliang City 0.105
(L)
0.202
(LM)
0.235
(M)
Xinyang City 0.120
(L)
0.139
(L)
0.171
(LM)
Shanxi Province Taiyuan City 0.215
(LM)
0.356
(H)
0.396
(H)
Xinxiang City 0.157
(LM)
0.182
(LM)
0.224
(LM)
Datong City 0.158
(LM)
0.228
(M)
0.265
(M)
Anyang City 0.127
(L)
0.167
(LM)
0.212
(LM)
Shuozhou City 0.165
(LM)
0.225
(M)
0.248
(M)
Shangqiu City 0.086
(L)
0.116
(L)
0.156
(L)
Xinzhou City 0.103
(L)
0.221
(M)
0.263
(M)
Hebi City 0.111
(L)
0.173
(LM)
0.191
(LM)
Lvliang City 0.151
(L)
0.208
(L)
0.237
(M)
Puyang City 0.134
(L)
0.177
(LM)
0.209
(LM)
Linfen City 0.126
(L)
0.201
(LM)
0.235
(M)
Jiaozuo City 0.146
(L)
0.167
(LM)
0.188
(LM)
Jincheng City 0.152
(L)
0.214
(LM)
0.255
(M)
Kaifeng City 0.112
(L)
0.158
(LM)
0.202
(LM)
Jinzhong City 0.169
(LM)
0.237
(M)
0.275
(M)
Pingdingshan City 0.137
(L)
0.167
(LM)
0.189
(LM)
Changzhi City 0.181
(LM)
0.245
(M)
0.257
(M)
Xuchang City 0.238
(M)
0.279
(M)
0.214
(LM)
Yuncheng City 0.158
(LM)
0.211
(LM)
0.233
(M)
Luohe City 0.129
(L)
0.162
(LM)
0.187
(LM)
Yangquan City 0.131
(L)
0.224
(M)
0.234
(M)
Shandong Province Jinan City 0.230
(M)
0.347
(H)
0.519
(VH)
Shaanxi Province Xi’an City 0.288
(H)
0.459
(VH)
0.655
(VH)
Heze City 0.130
(L)
0.175
(LM)
0.237
(M)
Tongchuan City 0.117
(L)
0.207
(LM)
0.252
(M)
Liaocheng City 0.152
(L)
0.193
(LM)
0.216
(M)
Baoji City 0.123
(L)
0.228
(M)
0.250
(M)
Dezhou City 0.179
(LM)
0.206
(LM)
0.243
(M)
Hanzhong City 0.106
(L)
0.205
(LM)
0.230
(M)
Jining City 0.172
(LM)
0.231
(M)
0.306
(H)
Shaanxi Province Ankang City 0.105
(L)
0.209
(LM)
0.224
(M)
Shandong Province Zaozhuang City 0.149
(L)
0.201
(LM)
0.235
(M)
Shangluo City 0.112
(L)
0.179
(LM)
0.220
(M)
Linyi City 0.265
(M)
0.253
(M)
0.306
(H)
Xianyang City 0.225
(M)
0.269
(M)
0.328
(H)
Tai’an City 0.182
(LM)
0.223
(M)
0.262
(M)
Weinan City 0.123
(L)
0.206
(LM)
0.228
(M)
Weifang City 0.177
(LM)
0.249
(M)
0.309
(H)
Yan’an City 0.116
(L)
0.214
(LM)
0.257
(M)
Dongying City 0.203
(LM)
0.257
(M)
0.274
(M)
Yulin City 0.129
(L)
0.269
(M)
0.275
(M)
Zibo City 0.200
(LM)
0.260
(M)
0.315
(H)
Ningxia Hui Autonomous Region Yinchuan City 0.146
(L)
0.263
(M)
0.306
(H)
Binzhou City 0.155
(L)
0.220
(M)
0.265
(M)
Shizuishan City 0.147
(L)
0.221
(M)
0.263
(M)
Rizhao City 0.182
(LM)
0.232
(M)
0.254
(M)
Wuzhong City 0.104
(L)
0.202
(LM)
0.229
(M)
Qingdao City 0.338
(H)
0.388
(H)
0.515
(VH)
Guyuan City 0.125
(L)
0.191
(LM)
0.253
(M)
Yantai City 0.211
(L)
0.288
(H)
0.342
(H)
Zhongwei City 0.118
(L)
0.195
(LM)
0.232
(M)
Weihai City 0.245
(M)
0.308
(VH)
0.327
(VH)

Note: L, low; LM, low-medium; M, medium; H, high; VH, very high.

In 2010, cities in the Yellow River Basin exhibited a low resilience, with low- and medium-resilience cities scattered throughout the eastern region. Only Qingdao and Xi’an cities showed a relatively high resilience; no cities with a high resilience were identified at that time. The number of cities with high resilience has increased, including Lanzhou, Ordos, Taiyuan, Jinan, Yantai, Weihai, and Qingdao cities, most of which are provincial capital cities and cities in the Shandong Peninsula urban agglomeration. In 2010, Xi’an City transitioned from a high resilience to a very high resilience. By 2020, the overall level of urban resilience continued to rise; the proportion of cities with a high resilience and a very high resilience increased from 2.6% in 2010 to 21.8% in 2020, and the proportion of cities with a medium resilience increased to 52.6%. The only city with a low resilience was Shangqiu City, and cities with a relatively poor resilience were mainly located around Shangqiu City.
Overall, urban resilience in the Yellow River Basin showed a significant east-west spatial gradient, with cities in the eastern region generally exhibiting higher resilience levels than those in the central and western regions. Cities with a high resilience were mainly located in the eastern region. However, urban resilience in the central and western regions had also shown significant growth, which was closely related to the overall high-quality development of the basin.

3.3. Global spatial correlated characteristics of urban resilience in the Yellow River Basin

The spatial autocorrelation levels of urban resilience in the Yellow River Basin were analyzed using the global autocorrelation coefficient (Moran’s I index) (Table 4). The Moran’s I index for integrated resilience was consistently greater than 0.000 during the study period, showing a positive spatial correlation. However, the positive spatial correlation in 2020 did not pass the significance test, and the spatial correlation in 2015 decreased compared to that in 2010, indicating a trend towards a more dispersed distribution of urban resilience levels. The Moran’s I index for environmental resilience decreased from the P<0.01 level in 2010 to the P<0.05 level in 2015, eventually becoming negligible and reflecting the gradual weakening of spatial clustering. The Moran’s I index for technological resilience showed a fluctuating pattern, whereas the Moran’s I index for organizational resilience was not significant correlated, indicating the absence of spatial clustering.
Table 4 Results of the global autocorrelation coefficient (Moran’s I index) and significance test.
Urban resilience system 2010 2015 2020
Industrial resilience 0.290*** 0.294*** 0.296***
Social resilience 0.247*** 0.725*** 0.733***
Environmental resilience 0.168*** 0.089* 0.072
Technological resilience 0.179*** 0.272*** 0.131**
Organizational resilience 0.000 -0.001 -0.065
Integrated resilience 0.246*** 0.100* 0.047

Note: ***, **, and * denote significance at the P<0.01, P<0.05, and P<0.10 levels, respectively.

3.4. Analysis of influencing factors of urban resilience in the Yellow River Basin

Based on the measurement of urban resilience levels in the Yellow River Basin and the non-repetition principle regarding influencing factors and indicator systems, we used the grey correlation analysis method to analyze the factors influencing urban resilience in the basin. The grey correlation analysis method can quantify the correlation of influencing factors, compare the relative impact of factors, and assess the strength, size, and order of relationships among the influencing factors. The correlation results for the four influencing factors (openness, market forces, administrative power, and science and technology level) measured in this study are shown in Table 5.
Table 5 Correlation coefficients between influencing factors and urban resilience.
Influencing factor 2010 2015 2020
Openness 0.904 0.891 0.895
Market forces 0.716 0.710 0.696
Administrative power 0.928 0.940 0.943
Science and technology level 0.955 0.971 0.963
The correlation trends of the four influencing factors displayed different features. The correlation coefficient between science and technology level and urban resilience was the highest during the study period, which proved that science and technology level played an important role to urban resilience. The correlation coefficient between administrative power and urban resilience keep continually increase, and become more and more significant. The correlation coefficient between openness and urban resilience first decreased and then increased from 2015 to 2020. The correlation coefficient between market forces and urban resilience was the lowest; however, this did not imply that they had no impact on urban resilience. On the whole, the correlation ranking of urban resilience influencing factors was as follows: science and technology level>administrative power>openness>market forces.

4. Discussion

4.1. Fluctuant dominant resilience characteristics

The Yellow River Basin exhibited different dominant resilience characteristics during different periods. Urban resilience is intrinsically linked to urban functions. Specifically, urban resilience can maintain urban functions in terms of organization, ecology, and spatial structure, whereas urban functions can enhance the comprehensive level of urban resilience. Previous studies explored the impacts of urban resilience on urban spatial continuity and structural balance (Ziervogel et al., 2017; Golubchikov and DeVerteuil, 2021; Eledi Kuusaana et al., 2023) and evaluated urban resilience levels from the perspective of the transformation of urban functions (Sandu et al., 2021). As an integrated and complex economic, social, and ecological system, the Yellow River Basin exhibited varying dominant resilience characteristics during different periods. During 2010-2015, social resilience was growing rapidly. From 2015 to 2020, economic resilience showed a rapid growth trend, and the overall competitiveness of organizational and environmental resilience was not high. The characteristics of dominant resilience impact the ability of the Yellow River Basin to respond to various emergencies. In future development, efforts should be made to improve organizational resilience of the basin and enhance the organizational regulation and restoration ability of the ecological environment in the face of sudden disasters.

4.2. Impacts of regional differences on urban resilience

Spatial agglomeration and regional imbalances are common, whereas development within the study region is relatively balanced. Recent researches have revealed that regional differences are the main causes of different urban resilience levels (Yu and Yang, 2023; Zhou and Wang, 2024). Urban resilience level in the Yellow River Basin showed an upward trend over time, and the spatial pattern of urban resilience level showed a decreasing trend from downstream to midstream and then to upstream (Li et al., 2024). Similarly, urban resilience level in the Yellow River Basin in this study showed a gradual upward trend, with a spatial pattern of high in the eastern region and low in the western region. There were also regional differences in the resilience level of each influencing factor, due to significant differences in natural environmental conditions in the eastern, central, and western regions of the Yellow River Basin. The western region has a relatively high, mountainous, and complex terrain and a cold climate, making it susceptible to natural disasters, whereas the eastern region has a relatively low and flat terrain, a warm climate, and relatively high-quality natural conditions. These differences in natural environments led to variations in urban resilience levels in various regions.

4.3. Different influencing factors on urban resilience

The grey correlation analysis method was used to calculate the correlation between influencing factors and urban resilience level. The final ranking of the correlation results was, from highest to lowest, science and technology level, administrative power, openness, and market forces. The level of technology is important for enhancing urban resilience (Zou et al., 2024). In the current era of high-quality economic development, urban agglomerations must balance urban resilience and technological innovation. Advanced technological means can enhance the ability of cities to respond to natural disasters and social risks as well as strengthen the resilience and sustainability of urban infrastructure. The effectiveness and transparency of governmental administrative institutions are crucial for ensuring a high urban resilience level. A sound governance system can improve the efficiency of a government in responding to crises and disasters, promote the rational allocation of resources and the synergy of social organizations, and enhance a city’s disaster resistance capacity. The development level of market forces also directly affects urban resilience. A fiercely competitive market environment can promote enterprise-level innovation, improve production efficiency, and increase the flexibility and adaptability of the urban economy, thus enhancing urban resilience. Open markets can promote resource allocation efficiency, enhance urban economic vitality, attract investment and talent, and enhance urban risk resistance. However, excessive reliance on external markets may lead to increased urban vulnerability. Therefore, it is necessary to find a balance between openness and autonomous development.

4.4. Promoting regional coordination and cooperation

Promoting regional coordination and cooperation is an effective way to improve the comprehensive urban resilience level and reduce differences in urban resilience in the Yellow River Basin. As discussed above, there were varying levels of dominant resilience in different cities. Scholars have extensively studied the differences in urban resilience, such as Cutter et al. (2016), Hou et al. (2021), and Chen et al. (2023). However, the discussion on resistance differences is only a basis and premise for future efforts; countermeasures should be developed to reduce these differences. These measures can reduce dominant resilience differences among different cities in the Yellow River Basin, including regional scientific and technological innovation and cooperation, promoting cross-regional integration of different resilience measures, and accomplishing regional sustainable development. Synergistic development among cities can occur through formulating reasonable urban planning and policies and strengthening information sharing, resource complementarity, and industrial linkages. The development needs and advantages of different cities should be considered to ensure the coordination of development paths and enhance the integrated resilience.

4.5. Study limitations and recommendations

We must note that this study lacks predictive research on urban resilience in the Yellow River Basin. The difficulty in comprehensively quantifying the impact of other external factors on the prediction results may lead to errors in this study. Based on the resilience measurement values of urban agglomeration in the middle reaches of the Yangtze River in China from 2006 to 2021, Yin et al. (2023) used a grey prediction model to predict urban resilience level from 2023 to 2027. Relevant scholars trained back propagation neural network and used it to predict urban resilience level (Wu et al., 2023; Liao and Zhang, 2024). Future research could be improved and perfected based on these approaches, which is indispensable for enhancing a city’s ability to resist risks. Therefore, we suggest that urban resilience research should promote the combination of process research and countermeasure research, and enhance experimental analysis to improve the ability to solve practical urban resilience problems.

5. Conclusions

Urban resilience in the Yellow River Basin showed temporal and spatial imbalances. The overall level of urban resilience in the Yellow River Basin was not high but showed a gradual increased trend during 2010-2020. Urban resilience level was uneven, with industrial resilience and social resilience being relatively prominent. By contrast, organizational resilience and environmental resilience were relatively weak. The temporal evolution of urban resilience exhibited a certain gradient, gradually increasing trend. Spatially, there was significant spatial heterogeneity in the Yellow River Basin, presenting a characteristic of high in the eastern region and low in the western region. Industrial resilience and social resilience exhibited a significant positive spatial correlation with urban resilience. The factors influencing urban resilience in the Yellow River Basin were, in descending order of correlation coefficient, science and technology level, administrative power, openness, and market forces, with science and technology level playing the most role.

Authorship contribution statement

JI Xiaomei: conceptualization, methodology, formal analysis, writing - original draft, and writing - review & editing; NIE Zhilei: data curation, software, and visualization; WANG Kaiyong: supervision, resources, and validation; XU Mingxian: supervision and resources; and FANG Yuhao: investigation and data curation. All authors approved the manuscript.

Declaration of conflict interest

WANG Kaiyong is a Young Editorial Board member of Regional Sustainability and was not involved in the editorial review or the decision to publish this article. All authors declare that there are no competing interests.

Acknowledgements

This work was supported by the Institute of Geographic Sciences and Natural Resources Research, Chinese Academy of Sciences.
[1]
Berkes F., Folke C., 1998. Linking Social and Ecological Systems for Resilience and Sustainability. Cambridge: Cambridge University Press, 13-20.

[2]
Bozza A., Asprone D., Manfredi G., 2015. Developing an integrated framework to quantify resilience of urban systems against disasters. Nat. Hazards. 78(3), 1729-1748.

[3]
Carpenter S., Walker B., Anderies M.J., et al., 2001. From metaphor to measurement: Resilience of what to what? Ecosystems. 4(8), 765-781.

[4]
Cavallaro M., Asprong D., Latora V., et al., 2014. Assessment of urban ecosystem resilience through Hybrid Social-Physical complex networks. Comput-Aided. Civ. Inf. 29(8), 608-625.

[5]
Chelleri L., Baravikova A., 2021. Understandings of urban resilience meanings and principles across Europe. Cities. 108, 102985, doi: 10.1016/j.cities.2020.102985.

[6]
Chen X.H., Lou J.N., Wang Y., 2020. Evolution and dynamic simulation of the temporal-spatial pattern of urban resilience in Harbin-Changchun Urban Group. Scientia Geographica Sinica. 40(12), 2000-2009 (in Chinese).

DOI

[7]
Chen Y., Li K.Y., Zhou Q., 2023. Spatial differentiation of urban economic resilience and its influencing factors: Evidence from Baidu migration big data. Technol. Econ. Dev. Eco. 29(2), 353-381.

[8]
Chen Y.M., Huang Y.X., Li K.C., et al., 2019. Dimensions and measurement of city resilience in theory and in practice. In:Proceedings of the 12th International Conference on Theory and Practice of Electronic Governance. Melbourne: Association for Computing Machinery.

[9]
Cheng Y.R., Liu J.H., 2023. Evaluation of urban resilience in the post-COVID-19 period: A case study of the Yangtze delta city group in China. Int. J. Disast. Risk. Re. 97, 104028, doi: 10.1016/j.ijdrr.2023.104028.

[10]
Cutter S.L., Ash K.D., Emrich C.T., 2016. Urban-rural differences in disaster resilience. Ann. Am. Assoc. Geogr. 106(6), 1236-1252.

[11]
Deng J.L., 1990. Tutorial on Grey System Theory. WuHan: Huazhong University of Technology Press (in Chinese).

[12]
Ding J.J., Wang Z., Liu Y.H., et al., 2020. Measurement of economic resilience of contiguous poverty-stricken areas in China and influencing factor analysis. Progress in Geography. 39(6), 924-937 (in Chinese).

DOI

[13]
Dong X.J., Shi T., Zhang W., et al., 2020. Temporal and spatial differences in the resilience of smart cities and their influencing factors: Evidence from Non-Provincial cities in China. Sustainability. 12(4), 1321, doi: 10.3390/su12041321.

[14]
Eledi Kuusaana J.A., Monstadt J., Smith S., 2023. Toward urban resilience? Coping with blackouts in Dar es Salaam, Tanzania. J. Urban. Technology. 30(2), 79-101.

[15]
Fang C.L., Wang Y., Fang J.W., 2016. A comprehensive assessment of urban vulnerability and its spatial differentiation in China. J. Geogr. Sci. 26(2), 153-170.

DOI

[16]
Feofilovs M., Romagnoli F., 2021. Dynamic assessment of urban resilience to natural hazards. Int. J. Disaster Risk. Re. 62, 102328, doi: 10.1016/j.ijdrr.2021.102328.

[17]
Gansu Provincial Bureau of Statistics, 2011. Gansu Development Yearbook. Beijing: China Statistics Press (in Chinese).

[18]
Gansu Provincial Bureau of Statistics, 2016. Gansu Development Yearbook. Beijing: China Statistics Press (in Chinese).

[19]
Gansu Provincial Bureau of Statistics, 2021. Gansu Development Yearbook. Beijing: China Statistics Press (in Chinese).

[20]
Gao Z.G., Ding Y.Y., 2021. Measurement of urban resilience and its influencing factors in Northwest China. Science & Technology Review. 39(24), 118-129 (in Chinese).

[21]
Golubchikov O., DeVerteuil G., 2021. Urban Inequalities and the Lived Politics of Resilience. Volume 4: Policy and Planning. Bristol: Bristol University Press, 69-78.

[22]
He B.J., Zhao D.X., Zhu J., et al., 2018. Promoting and implementing urban sustainability in China: An integration of sustainable initiatives at different urban scales. Habitat. Int. 82, 83-93.

[23]
He S.F., Liang S., Wu S.H., et al, 2022. Spatial and temporal evolution of urban flood resilience in the Yangtze River Delta region and its correlation analysis. Yangtze River Basin Resources and Environment. 31(9), 1988-1999 (in Chinese).

[24]
Henan Provincial Bureau of Statistics, 2011. Henan Statistical Yearbook. Beijing: China Statistics Press (in Chinese).

[25]
Henan Provincial Bureau of Statistics, 2016. Henan Statistical Yearbook. Beijing: China Statistics Press (in Chinese).

[26]
Henan Provincial Bureau of Statistics, 2021. Henan Statistical Yearbook. Beijing: China Statistics Press (in Chinese).

[27]
Holling C.S., 1973. Resilience and stability of ecological systems. Annu. Rev. Ecol. Syst. 4(1), 1-23.

[28]
Hou X., Ma Q.L., Wang, X., 2021. Spatial differentiation and elements influencing urban resilience in the middle reaches of the Yangtze River under the COVID-19 pandemic. Discrete Dyn. Nat. Soc. doi: 10.1155/2021/6687869.

[29]
Inner Mongolia Autonomous Region Bureau of Statistics, 2011. Inner Mongolia Statistical Yearbook. Beijing: China Statistics Press (in Chinese).

[30]
Inner Mongolia Autonomous Region Bureau of Statistics, 2016. Inner Mongolia Statistical Yearbook. Beijing: China Statistics Press (in Chinese).

[31]
Inner Mongolia Autonomous Region Bureau of Statistics, 2021. Inner Mongolia Statistical Yearbook. Beijing: China Statistics Press (in Chinese).

[32]
Ji X.M., Nie Z.L., Liang H.Y., 2022. Evaluation of changes in urban resilience and analysis of influencing factors Jinan City, Shandong Province as an example. Science and Management. 42(3), 87-94 (in Chinese).

[33]
Li H.Y., Wang Y., Zhang H.W., et al., 2024. The spatial-temporal evolution and driving mechanism of urban resilience in the Yellow River Basin cities. J. Clean. Prod. 447, 141614, doi: 10.1016/j.jclepro.2024.141614.

[34]
Li M.J., Liu D.L., 2022. Spatial and temporal evolution of urban disaster resilience and barrier factors in the Zhongyuan urban agglomeration. Chinese Journal of Safety Science. 32(9), 144-151 (in Chinese).

[35]
Li Y.T., Chen T., Wang Y.L., 2023. Grey forecasting the impact of population and GDP on the carbon emission in a Chinese region. J. Clean Production. 425, 139025, doi: 10.1016/j.jclepro.2023.139025.

[36]
Liao Z.J., Zhang L.J., 2024. Spatio-temporal pattern evolution and dynamic simulation of urban ecological resilience in Guangdong Province, China. Heliyon. 10(3), e25127, doi: 10.1016/j.heliyon.2024.e25127.

[37]
Lu H., Lu X., Jiao L.D., et al., 2022. Evaluating urban agglomeration resilience to disaster in the Yangtze Delta city group in China. Sustainable Cities. 76, 103464, doi: 10.1016/j.scs.2021.103464.

[38]
Maru M., Worku H., Bikmann J., 2021. Factors affecting the spatial resilience of Ethiopia’s secondary cities to urban uncertainties: A study of household perceptions of Kombolcha city. Heliyon. 7(12), e08472, doi: 10.1016/j.heliyon.2021.e08472.

[39]
Ministry of Housing and Urban-Rural Development of China, 2011. China Urban-Rural Construction Statistical Yearbook. Beijing: China Planning Press (in Chinese).

[40]
Ministry of Housing and Urban-Rural Development of China, 2016. China Urban-Rural Construction Statistical Yearbook. Beijing: China Planning Press (in Chinese).

[41]
Ministry of Housing and Urban-Rural Development of China, 2021. China Urban-Rural Construction Statistical Yearbook. Beijing: China Planning Press (in Chinese).

[42]
Nathwani J., Lu X.L., Wu C.Y., et al., 2019. Quantifying security and resilience of Chinese coastal urban ecosystems. Sci. Total Environ. 672, 51-60.

[43]
National Bureau of Statistics of China, 2011a. China Statistical Yearbook for Regional Economy. Beijing: China Statistics Press (in Chinese).

[44]
National Bureau of Statistics of China, 2011b. China City Statistical Yearbook. Beijing: China Statistics Press (in Chinese).

[45]
National Bureau of Statistics of China, 2016a. China Statistical Yearbook for Regional Economy. Beijing: China Statistics Press (in Chinese).

[46]
National Bureau of Statistics of China, 2016b. China City Statistical Yearbook. Beijing: China Statistics Press (in Chinese).

[47]
National Bureau of Statistics of China, 2021a. China Statistical Yearbook for Regional Economy. Beijing: China Statistics Press (in Chinese).

[48]
National Bureau of Statistics of China, 2021b. China City Statistical Yearbook. Beijing: China Statistics Press (in Chinese).

[49]
National Bureau of Statistics of China, 2023. China Statistical Yearbook. Beijing: China Statistics Press (in Chinese).

[50]
Ningxia Autonomous Region Bureau of Statistics, 2011. Ningxia Statistical Yearbook. Beijing: China Statistics Press (in Chinese).

[51]
Ningxia Autonomous Region Bureau of Statistics, 2016. Ningxia Statistical Yearbook. Beijing: China Statistics Press (in Chinese).

[52]
Ningxia Autonomous Region Bureau of Statistics, 2021. Ningxia Statistical Yearbook. Beijing: China Statistics Press (in Chinese).

[53]
Qinghai Provincial Bureau of Statistics, 2011. Qinghai Statistical Yearbook. Beijing: China Statistics Press (in Chinese).

[54]
Qinghai Provincial Bureau of Statistics, 2016. Qinghai Statistical Yearbook. Beijing: China Statistics Press (in Chinese).

[55]
Qinghai Provincial Bureau of Statistics, 2021. Qinghai Statistical Yearbook. Beijing: China Statistics Press (in Chinese).

[56]
Resilience Alliance, 2007. Urban Resilience Research Prospectus. Australia: CSIRO.

[57]
Sandu A., Banica A., Muntele I., 2021. Urban resilience: An instrument to decode the postsocialist socio-economic and spatial transformations of cities from Central and Eastern Europe. East. J. Eur. Stud. 12(Special Issue), 170-195.

[58]
Shaanxi Provincial Bureau of Statistics, 2011. Shaanxi Statistical Yearbook. Beijing: China Statistics Press (in Chinese).

[59]
Shaanxi Provincial Bureau of Statistics, 2016. Shaanxi Statistical Yearbook. Beijing: China Statistics Press (in Chinese).

[60]
Shaanxi Provincial Bureau of Statistics, 2021. Shaanxi Statistical Yearbook. Beijing: China Statistics Press (in Chinese).

[61]
Shandong Provincial Bureau of Statistics, 2011. Shandong Statistical Yearbook. Beijing: China Statistics Press (in Chinese).

[62]
Shandong Provincial Bureau of Statistics, 2016. Shandong Statistical Yearbook. Beijing: China Statistics Press (in Chinese).

[63]
Shandong Provincial Bureau of Statistics, 2021. Shandong Statistical Yearbook. Beijing: China Statistics Press (in Chinese).

[64]
Shanxi Provincial Bureau of Statistics, 2011. Shanxi Statistical Yearbook. Beijing: China Statistics Press (in Chinese).

[65]
Shanxi Provincial Bureau of Statistics, 2016. Shanxi Statistical Yearbook. Beijing: China Statistics Press (in Chinese).

[66]
Shanxi Provincial Bureau of Statistics, 2021. Shanxi Statistical Yearbook. Beijing: China Statistics Press (in Chinese).

[67]
Shao Y.W., Xu J., 2015. Understanding urban resilience: A conceptual analysis based on integrated international literature review. International Urban Planning. 30(2), 48-54 (in Chinese).

[68]
Song Y.R., Dong X.J., 2022. The factors influencing the economic resilience of Chinese cities and the path of improvement. Lingnan Journal. (4), 97-105 (in Chinese).

[69]
Soufi H.R., Esfahanipour A., Shirazi M.A., 2022. A quantitative approach for analysis of macroeconomic resilience due to socio-economic shocks. Socio-Econ. Plan. Sci. 79, 101101, doi: 10.1016/j.seps.2021.101101.

[70]
Spaans M., Waterhout B., 2017. Building up resilience in cities worldwide-Rotterdam as participant in the 100 Resilient Cities Programme. Cities. 61, 109-116.

[71]
Sun J., Liu S.D., Wang L., et al., 2020. Safety resilience evaluation of urban public bus based on comprehensive weighting method and fuzzy comprehensive evaluation method. In: International Conference on Urban Engineering and Management Science. Zhuhai, China.

[72]
Sun J., Zhai N.N., Mu H.R., et al., 2024. Assessment of urban resilience and subsystem coupling coordination in the Beijing-Tianjin-Hebei urban agglomeration. Sustain. Cities. Soc. 100, 105058, doi: 10.1016/j.scs.2023.105058.

[73]
Sun Y., Zhang L.C., Yao S.M., 2017. Evaluating resilience of prefecture cities in the Yangtze River delta region from a socio-ecological perspective. China Population, Resources and Environment. 27(8), 151-158 (in Chinese).

[74]
Tao X.D., 2022. Resilient city construction in China: Connotation characteristics, shortcomings, and planning strategies. Urban Planning. 46(12), 28-34, 66 (in Chinese).

[75]
Wang C.Y., Xu M., Olsson G., et al., 2020. Characterizing of water-energy-emission nexus of coal-fired power industry using entropy weighting method. resources. Resour. Conserv. Recy. 161, 104991, doi: 10.1016/j.resconrec.2020.104991.

[76]
Wang Q.Z., Zhu Y.M., 2021. Research on economic resilience and influencing factors of Chinese cities. Ecological Economy. 37(10), 84-92 (in Chinese).

[77]
Wang T.C., Lee H.D., 2009. Developing a fuzzy TOPSIS approach based on subjective weights and objective weights. Expert. Syst. Appl. 36(5), 8980-8985.

[78]
Wu J.P., Pan Y.J., Luo H.S., et al., 2023. Study on the spatiotemporal pattern evolution and dynamic prediction of urban resilience in the central Yunnan urban agglomeration. Ecological Economy. 39(8), 95-105 (in Chinese).

[79]
Xu Z.F., Tian J.F., Zhang J., 2019. Urban resilience evaluation system and optimization strategy from perspective of disaster prevention. China Safety Science Journal. 29(3), 1-7 (in Chinese).

DOI

[80]
Yin J.J., Hu J., Huang Y.X., 2023. Study on the spatiotemporal evolution characteristics and dynamic prediction of urban resilience in the middle reaches of the Yangtze River Urban Agglomeration. Resources and Environment in the Yangtze Basin. 32(11), 2312-2325 (in Chinese).

[81]
Yu J.L., Yang S.G., 2023. Study on the spatiotemporal differentiation and influencing factors of urban resilience level in the Yangtze River Delta. Economic System Reform. (6), 53-61 (in Chinese).

[82]
Zhang M.D., Ren Y.T., Zhou L., 2023. Analysis of spatiotemporal evolution characteristics and influencing factors of urban ecological resilience in the Yellow River Basin. Arid Land Geography. 47(3), 445-454 (in Chinese).

[83]
Zhang M.M., Chen W.G., Cai K., et al., 2019a. Analysis of the spatial distribution characteristics of urban resilience and its influencing factors: A case study of 56 cities in China. Int. J. Environ. Res. Public Health. 16(22), 4442, doi: 10.3390/ijerph16224442.

[84]
Zhang M.M., Tan S.K., Pan Z.C., 2022. The spatial spillover effect and nonlinear relationship analysis between land resource misallocation and environmental pollution: Evidence from China. J. Environ. Manage. 321, 115873, doi: 10.1016/j.jenvman.2022.115873.

[85]
Zhang X.S., Zhang M.M., He J., et al., 2019b. The spatial-temporal characteristics of cultivated land and its influential factors in the Low Hilly Region: A case study of Lishan Town, Hubei Province, China. Sustainability. 11(14), 3810, doi: 10.3390/su11143810.

[86]
Zhao R.D., Fang C.L., Liu H.M., et al., 2021. Evaluating urban ecosystem resilience using the DPSIR framework and the ENA model: A case study of 35 cities in China. Sustain. Cities. Soc. 72, 102997, doi: 10.1016/j.scs.2021.102997.

[87]
Zhao R.D., Fang C.L., Liu J., et al., 2022. The evaluation and obstacle analysis of urban resilience from the multidimensional perspective in Chinese cities. Sustain. Cities. Soc. 86, 104160, doi: 10.1016/j.scs.2022.104160.

[88]
Zhou X., Wang J., 2024. Study on the spatiotemporal evolution characteristics and spatial differences of urban resilience in the Beijing Tianjin Hebei urban agglomeration: Based on an improved PSR framework. Resource Development and Market. 40(2), 231-239 (in Chinese).

[89]
Zhu J.H., Sun H.X., 2020. A study on the spatial and temporal evolution of urban resilience and influencing factors in three major urban agglomerations in China. Soft Science. 34(2), 72-79 (in Chinese).

[90]
Ziervogel G., Pelling M., Cartwright A., et al., 2017. Inserting rights and justice into urban resilience: A focus on everyday risk. Environ. Urban. 29(1), 123-138.

[91]
Zou W., Wang X.Y., Wan F.J., et al., 2024. Research on the coupling and coordinated development of urban resilience and technological innovation level: Taking the Yangtze River Delta Urban Agglomeration as an example. Ecological Economy. 40(1), 78-87 (in Chinese).

Outlines

/