Full Length Article

Green transformation paths of resource-based cities in China from the configuration perspective

  • GONG Qunxi , *
Expand
  • School of Economics and Management, Chongqing Jiaotong University, Chongqing, 400074, China
* E-mail address: (GONG Qunxi).

Received date: 2023-11-06

  Revised date: 2024-04-28

  Accepted date: 2024-08-21

  Online published: 2025-08-14

Abstract

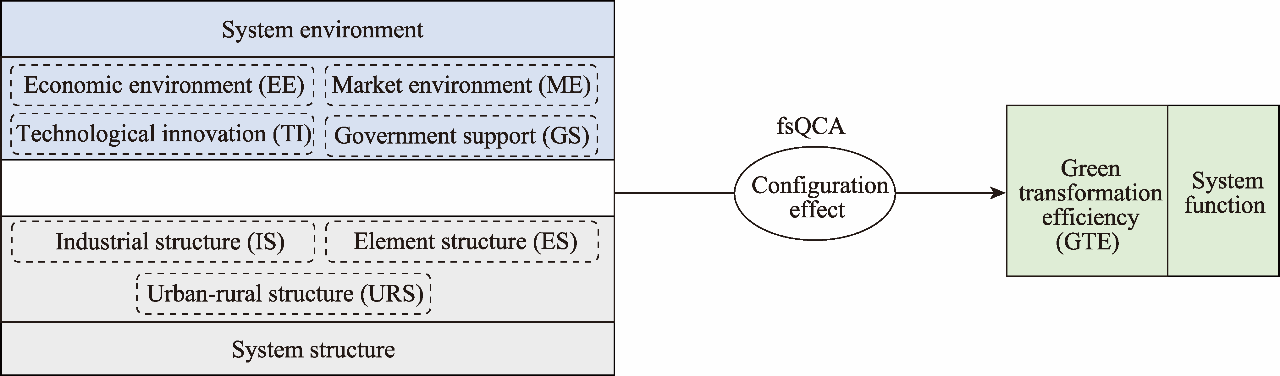
Green transformation is an unavoidable choice for resource-based cities (RBCs) that face resource depletion and environmental pollution. Existing research has focused primarily on specific RBCs, making it challenging to apply green transformation strategies universally across cities. The fuzzy set qualitative comparative analysis (fsQCA) is a combination of qualitative and quantitative analyses that can handle multiple concurrent causality problems and determine how different conditions combine into configurations and generate an outcome. Thus, to address this gap, in this study, we established a research framework for green transformation and utilized the fsQCA to examine the configurations of 113 RBCs in China. By incorporating the element of time, this study explored the dynamic evolution of solutions in 2013, 2016, and 2019. The main findings indicate that individual elements do not constitute the necessary conditions for improving the green transformation efficiency (GTE), and the systematic combination of multiple conditions is an effective path for realizing the improvement of the GTE in RBCs. Green transformation paths of RBCs exhibit the same destination through different paths. Additionally, the combination of system environment elements and system structure elements is both complementary and alternative. Differences in RBCs have led to various factor combinations and development paths, but there are some similarities in the key elements of the factor combinations at different stages. Economic environment, government support, and technological innovation are key factors that universally enhance the GTE in RBCs. These insights can assist city managers in formulating policies to drive green transformation and contribute to a better theoretical understanding of green transformation paths in RBCs.

Cite this article

GONG Qunxi . Green transformation paths of resource-based cities in China from the configuration perspective[J]. Regional Sustainability, 2024 , 5(3) : 100158 . DOI: 10.1016/j.regsus.2024.100158

1. Introduction

Relying on leading industries such as resource development and processing, resource-based cities (RBCs) in China have experienced rapid growth, becoming a crucial pillar supporting the national economy (Fan et al., 2023; Pan et al., 2023). For a long time, RBCs have played a vital role in China’s industrialization and modernization (He et al., 2017). As stated by the “National Sustainable Development Plan for Resource-based Cities (2013-2020)”, China has a cornucopia of RBCs that are widely distributed, with a total of 262 RBCs, accounting for 40.00% of its total land area (Li and Dewan, 2017). However, with the intensification of resource depletion and environmental deterioration, sustainable development faces more severe crises in RBCs than in other cities (Ruan et al., 2020). As the resource dividend diminishes, RBCs are at greater risk of falling into the “resource curse” phenomenon (Wang et al., 2023b; Wu et al., 2023). Therefore, green transformation has become a pressing requirement for the sustainable development of RBCs and a realistic demand for high-quality development under the new economic normal.
The green transformation of RBCs is a complex systematic project (Ruan et al., 2020). It is necessary to assess the development level to grasp the situation of green transformation as well as to clarify the influencing factors to accelerate the development of green transformation. Research on the green transformation measurement of RBCs has focused on two main aspects: (1) the comprehensive evaluation of green transformation from the perspective of multidimensional subsystems (Liu et al., 2020; Long et al., 2021; Wang et al., 2023a); and (2) the measurement of the green transformation efficiency (GTE) from the perspective of input and output (Zhai and An, 2021). The GTE can truly and systematically reflect the green transformation level, and it is a comprehensive evaluation indicator of green transformation, providing a new perspective for investigating the transformation effects and development quality of cities (Zhai and An, 2021). Currently, common efficiency measurement methods include data envelopment analysis and stochastic frontier analysis (Su, 2020). Stochastic frontier analysis can test the significance of variables, but it can only assess the efficiency of a single output project (Gao et al., 2020). It is difficult to evaluate the GTE of complex urban multi-input and multi-output systems. Data envelopment analysis that can assess the efficiency of multi-input and multi-output complex systems has the advantage of nonsubjective weighting, and has been widely used (Wang et al., 2020; Chang et al., 2021). Using the traditional data envelopment analysis, Slack Based Measure (SBM) model, super-efficient model, etc., researchers have carried out extensive studies focusing on RBCs (Luo et al., 2017; Hu et al., 2020; Wang et al., 2022), which lays the foundation for this study.
To optimize the development environment of RBCs, consolidate the foundation for green transformation, and provide good supporting conditions for green transformation, the Chinese government has announced substantial policies, such as “Guiding Opinions on Strengthening the Classification, Guidance and Cultivation of New Dynamics for the Transformation and Development of RBCs” and the “14th Five-Year Plan to Support the High-quality Development of Demonstration Zones for Industrial Transformation and Upgrading of Old Industrial Cities and RBCs” (Li et al., 2020; Ruan et al., 2021; Wang et al., 2022). In the green transformation of RBCs, some cities have achieved certain results and accumulated rich experience (He et al., 2017). There have been studies focusing on RBCs in China, such as Jixi City in Heilongjiang Province and Yulin City in Shaanxi Province, that make recommendations for transformational development based on city characteristics (Tian and Ning, 2014; Wen et al., 2022). However, these recommendations are difficult to apply to most RBCs due to differences in their development stages, resource endowments, development dilemmas, and industrial bases (Jing et al., 2020).
There are two gaps in the existing research. First, the green transformation of RBCs is the result of the systematic action of multiple factors that interact to produce alternative or complementary effects, but the current research is unable to clarify the complex relationships among them. Second, existing studies have mostly utilized regression models, spatial econometric models, etc., to explore the mechanism of multiple factors; however, these approaches may ignore the joint effects of multiple factors or may strengthen or weaken the role of one factor. Therefore, this study first constructed a research framework for green transformation paths. Furthermore, we used the fuzzy set qualitative comparative analysis (fsQCA) to inspect the necessity and grouping of environment elements and structure elements, clarify the dynamic evolution trend of elemental grouping and grouping solutions for green transformation, and explore green transformation paths that adapt RBCs to provide decision support for high-quality development of RBCs and a reference for other cities’ green transformation.
Compared with the current literature, the main contributions of this study are as follows. This study constructs a research framework of green transformation paths from the system perspective and configuration perspective and analyses the multiple joint effects of system environment elements and structure elements on the green transformation of RBCs, effectively avoiding the issues of ignoring the joint effects of multiple factors or strengthening or weakening the role of one factor when the diversity of influencing factors is explored using traditional linear methods (Du et al., 2021). A total of 113 RBCs in China were taken as the study cases, several green transformation paths adapted to most RBC characteristics were proposed, and typical cities were given; these paths are more generalizable than those used in prior studies of specific RBCs. This study extends the application of configuration theory to sustainable urban development, which provides persuasive and scientific theory and empirical evidence for the selection of a path to improve the GTE in RBCs.

2. Research framework

By investing various elements, such as capital, labor, land, energy, and water resources, it can be found that the urban system provides the material, energy, and information needed for urban transformation to obtain corresponding outputs and further development, such as economic development, social progress, and environmental pollution management. However, the development of cities is dynamic and cyclical and involves complex system engineering (Ruan et al., 2020). Faced with the dilemma of extensive growth and a single industry, an urban system will adjust its system environment, optimize its structure, reshape its function, and enter the next development cycle (Jing et al., 2020).
An urban system is a human-dominated, complex, and open giant system organization that includes multiple dimensions, such as society, economy, environment, and resources (Gao et al., 2020). The organizational management system theory proposed from the general analysis dimension of “environment-function-structure” in systems science can well explain the essence, mechanism, and method of organizational management and clarify the complex relationship between systems and elements (Hou, 2018). Therefore, this study can provide theoretical support for exploring the mechanism of urban transformation and development. Drawing on the theory of organizational management systems, this study presents a research framework for urban management system. In an urban management system, the urban system environment, urban system function, and urban system structure are three important interconnected dimensions that influence each other and jointly determine the state of the system (Yu, 2014). The urban system environment is a collective that affects the urban management system mainly through the exchange of resources and elements. At the same time, the structural adjustment and institutional changes of the urban management system will also affect the urban system environment. The urban system structure refers to the aggregation and dispersal state, mode of action, and connection form of elements dominated by people in the process of realizing the functions of the urban management system. The urban system function refers to the development direction of the urban management system under changes in the system environment and system structure. Through interactions between the system structure and the internal-external environment, the realization of system functions is jointly promoted. The realization of system functions will also further optimize the system structure and system environment.
The economy and society of RBCs are unique, and their development has a certain dependence on resources (Yang et al., 2019). With the prominence of resource and environment problems, the development of RBCs has gradually fallen into a development predicament (Ruan et al., 2020). Focusing on development issues, RBCs actively adjust the urban system structure and optimize the urban environment to reshape urban functions and achieve green transformation and development. The system structure mainly includes three parts: industrial structure, element structure, and urban-rural structure. RBCs can solve the current development predicament of strong resource dependence and low-level urban industries through industrial rationalization and advanced development. RBCs can overcome the primary predicaments of resource elements and accelerate clean and low-carbon development of RBCs by adjusting the structure of elements such as talent and resources. RBCs will accelerate the coordinated development of urban and rural areas by adjusting the urban-rural structure and weakening the development gap between urban and rural areas. RBCs’ system structure optimization and system functions also require support from the city system environment. In the green transformation process, RBCs rely on their own economic development, actively improve government support, market environment, etc., and enhance their technological innovation to adapt to industrial and economic structures. The system function is realized under the synergy of system environment elements and system structure elements, that is, the green transformation of RBCs. This study combines the system environment and system structure to construct a research framework for green transformation in RBCs, as shown in Figure 1.
Fig. 1. Research framework for green transformation used in this study. fsQCA, fuzzy set qualitative comparative analysis.

3. Research design

3.1. Method

The elements of the green transformation system in RBCs are complex and systemic in nature (Ruan et al., 2020). Research to determine what kind of urban system environment and system structure model can improve the GET in RBCs belongs to the category of complex cause‒effect relationship analysis. The idea of configuration, which focuses on multiple causes and effects and different paths, can be used to study the complexity of multiple concurrent problems and is an ideal approach for investigating the matching and linkage impacts of the urban system environment and system structure elements on the urban GTE (Tao et al., 2021). We used the fsQCA v3.0 software (Charles Ragin and Sean Davey, California, USA) to analyze the configuration effect of influencing factor of the green transformation of RBCs, explore suitable development models and practical paths, and provide new ideas for the high-quality development of RBCs. This method has the advantages of qualitative and quantitative analysis and has been broadly employed in the fields of innovation ecosystems (Bacon et al., 2020), sharing economies (Chuah et al., 2021) and smart cities (Ruhlandt et al., 2020; Duygan et al., 2022). This method can be used to analyze the complex relationship between result variables and condition variables from a systematic perspective and realize a comprehensive exploration of the combination of various influencing factors, which is highly compatible with the research problem of the green transformation path of RBCs (Ragin and Strand, 2008).

3.2. Case selection

This study focused on the green transformation of RBCs. There are 126 prefecture-level RBCs in China (He et al., 2017). Considering the rationality, continuity, and availability of the data, this study excluded 13 RBCs with missing data and selected 113 RBCs as research cases. The representativeness of case selection is the main factor affecting the robustness of the results of the fsQCA (Stokke, 2007). The selected cases accounted for 89.68% of all RBCs in China (as shown in Table 1), covering the eastern (19 RBCs), central (37 RBCs), western (38 RBCs), and northeastern (19 RBCs) regions, and included growing, mature, declining, and regenerating RBCs. Moreover, there are 57 coal-type cities, 10 oil-type cities, 28 nonferrous metal-type cities, 13 ferrous metal-type cities, and 5 forest industry-type cities among the 113 cities. Thus, the sample cases can reflect regional differences and development differences and are representative to a certain extent.
Table 1 Details of the selected 113 resource-based cities (RBCs) in China.
Region Number of cities City
Eastern region 19 Zhangjiakou, Chengde, Tangshan, Xingtai, Handan, Xuzhou, Suqian, Huzhou, Nanping, Sanming, Longyan, Dongying, Zibo, Linyi, Zaozhuang, Jining, Tai’an, Shaoguan, and Yunfu cities
Central region 37 Datong, Shuozhou, Yangquan, Changzhi, Jincheng, Xinzhou, Jinzhong, Linfen, Yuncheng, Lvliang, Suzhou, Huaibei, Bozhou, Huainan, Chuzhou, Ma’anshan, Tongling, Chizhou, Xuancheng, Jingdezhen, Xinyu, Pingxiang, Ganzhou, Yichun, Sanmenxia, Luoyang, Jiaozuo, Hebi, Puyang, Pingdingshan, Nanyang, Ezhou, Huangshi, Hengyang, Chenzhou, Shaoyang, and Loudi cities
Western region 38 Baotou, Wuhai, Chifeng, Hulun Buir, Ordos, Baise, Hechi, Hezhou, Guangyuan, Nanchong, Guang’an, Zigong, Luzhou, Panzhihua, Dazhou, Ya’an, Liupanshui, Bijie, Anshun, Qujing, Baoshan, Zhaotong, Lijiang, Lincang, Yan’an, Tongchuan, Weinan, Xianyang, Baoji, Yulin, Baiyin, Wuwei, Zhangye, Qingyang, Pingliang, Longnan, Shizuishan, and Karamay cities
Northeastern region 19 Fuxin, Fushun, Benxi, Anshan, Panjin, Huludao, Songyuan, Jilin, Liaoyuan, Tonghua, Baishan, Heihe, Daqing, Yichun, Hegang, Shuangyashan, Qitaihe, Jixi, and Mudanjiang cities.
During the green transformation of RBCs, the relative importance of various conditions to urban development is adjusted. In particular, policy implementation affects the development path of RBCs (Li et al., 2020). The Chinese government released “China’s Sustainable Development Plan of National Resource-based Cities (2013-2020)” in 2013 and “Administrative Measures for Industrial Transformation and Upgrading Demonstration Zones in Old Industrial Cities and Resource-based Cities” in 2016. To reflect the evolution of the green transformation path of RBCs in different years, in this study, we selected 113 RBCs in 2013, 2016, and 2019 for calibration and modeling and conducted a qualitative comparative analysis of the three years.

3.3. Data and calibration

3.3.1. Conditional selection

This study considers the GTE as an outcome variable. We constructed an input-output index system from the economy-society-resources-environment perspective and used the super-efficient SBM model to assess the GTE of 113 RBCs of China in 2013, 2016, and 2019 (Muvingi et al., 2023). The input indicators include the total investment in urban fixed assets, the number of employees in urban units, the area of urban construction land, the total amount of water supply, and the total electricity consumption of the whole society (Xu et al., 2013; Li and Dewan, 2017; Wang and Sun, 2020; Lin et al., 2021). The output indicators include the gross domestic product (GDP), the social development index, and the environmental stress index (Luo et al., 2017; Sun et al., 2017; Wang et al., 2021). The data used were mainly from the China Urban Statistical Yearbook (National Bureau of Statistics of China, 2014, 2017, 2020) and China Urban Construction Statistical Yearbook (Ministry of Housing and Urban-Rural Development of the People’s Republic of China, 2014, 2017, 2020). Some missing data were imputed by the interpolation method.
In this study, the selection of conditional variables was primarily carried out from the perspectives of the urban system environment and urban system structure. The urban system environment includes four main variables: economic environment, technological innovation, government support, and market environment. Economic environment was measured using GDP per capita. Cities with a greater economic environment can provide more support for their green transformation, such as funds and resources, to accelerate the urban GTE (Qiu et al., 2018). Technological innovation was measured from the perspective of scientific input and output, including the proportion of scientific and technological expenditures in the general public budget and the number of patents obtained in the year. On the one hand, the improvement of technological innovation can support the research and development of new technologies and new products; on the other hand, it can promote the extension of the industrial chain, increase the added value of products, and reduce resource consumption and pollution emissions (Liao and Li, 2022). Government support was measured from the perspective of urban fiscal revenue and expenditure, including the proportion of urban general public fiscal revenue to GDP and the proportion of general public fiscal expenditure to GDP. Government financial support can provide material support for urban development and improve the urban infrastructure construction level, technological innovation capabilities, labor security, etc. (Wang and Sun, 2020). Market environment was measured from the perspective of marketization, openness level, and market size, including the marketization index, the proportion of total import and export trade to GDP, and the proportion of total retail sales to GDP. The calculation of the marketization index refers to the research results of Fan et al. (2011). Marketization improvement and market scale expansion can stimulate the vitality of urban development and improve resource allocation and utilization efficiency (Li and Xu, 2018), and market openness improvement can attract more talent, funds, and technologies to improve urban technological innovation capabilities and management levels (Liu et al., 2019).
The urban system structure mainly includes three variables: industrial structure, element structure, and urban-rural structure. Industrial structure was calculated from advanced dimension and rational dimension. We calculated industrial structure according to the research results of Yuan and Zhu (2018). RBCs optimize industrial structure and improve resource allocation and utilization efficiency through industrial chain extension and expansion, thereby reducing resource dependence and realizing green transformation (Zhou et al., 2020). Element structure was calculated from human, capital, and resource perspectives. Element structure includes the proportion of professional and technical employees to the number of employees in urban units, the proportion of fixed investment in the whole society to GDP, and the proportion of electricity consumption to the total energy consumption. Human, capital, energy, etc., provide effective support for technological innovation and diffusion and contribute to energy conservation, emission reduction, and green transformation in cities (Dong et al., 2021). Urban-rural structure was estimated from the perspective of the urban-rural economic structure and urbanization level, including the proportion of urban residents’ per capita income to rural residents’ per capita income and the urbanization rate. The urban-rural economic structure is a negative indicator, and a value close to 1.0000 indicates that the income gap between urban and rural areas is not large and that urban and rural areas are coordinated for development. The development of urbanization will also narrow the gap between urban and rural areas in terms of financial inputs, remuneration for labor and production, and quality of life, and optimize the urban-rural structure (Jiang et al., 2022). The optimization of the urban-rural structure can provide more resources for urban green transformation, promote the improvement of urban service functions, and improve infrastructure construction (Zhai and Nie, 2010).
The abovementioned raw data were collected from the China Urban Statistical Yearbook (National Bureau of Statistics of China, 2014, 2017, 2020), and some data were obtained through calculations. The entropy weight method has strong objectivity in determining the index weight and has been widely used (Li and Yan, 2018). Therefore, the data of condition variables were calculated by the entropy weight method.

3.3.2. Data calibration

Referring to Amara et al. (2020) and Du et al. (2020), in this study, we selected 75.00%, 50.00%, and 25.00% of the descriptive statistics of the study cases as the three calibration points of the full membership, the cross-over point, and the full nonmembership, respectively. When the GTE is greater than 1.0000, it is considered effective, so the full membership was selected as 1.0000. The descriptive statistics and variable calibration points are shown in Table 2.
Table 2 Descriptive statistics and variable calibration points.
Year Variable Mean Standard deviation Max Min Full membership Cross-over point Full nonmembership
2013 GTE 0.6668 0.2562 1.5008 0.3429 1.0000 0.5849 0.4775
EE 44,310 38,660 256,877 8816 52,515 31,183 23,129
TI 0.1633 0.1468 0.8608 0.0055 0.1854 0.1214 0.0725
GS 0.2928 0.1489 0.9760 0.0001 0.3627 0.2619 0.1840
ME 0.3738 0.1162 0.6684 0.1158 0.4436 0.3779 0.2866
IS 0.6602 0.1670 0.9944 0.1511 0.7973 0.6665 0.5226
ES 0.3966 0.0992 0.7153 0.1019 0.4537 0.4063 0.3377
URS 0.5517 0.1574 0.9758 0.1228 0.6649 0.5639 0.4736
2016 GTE 0.6757 0.2930 1.5166 0.2599 1.0000 0.5536 0.4417
EE 47,034 29,906 215,488 13,805 56,410 40,059 27,102
TI 0.1239 0.1480 0.5926 0.0018 0.1471 0.0629 0.0224
GS 0.3187 0.1506 1.0001 0.0540 0.4049 0.2937 0.2106
ME 0.3640 0.1186 0.6922 0.1001 0.4277 0.3754 0.2861
IS 0.6348 0.1785 0.9771 0.1948 0.7774 0.6473 0.5019
ES 0.4140 0.1007 0.6337 0.1458 0.4761 0.4146 0.3621
URS 0.4591 0.1644 0.9164 0.0601 0.5691 0.4684 0.3489
2019 GTE 0.8290 0.2179 1.2834 0.4256 1.0000 0.7733 0.6360
EE 52,531 28,722 188,857 16,868 59,552 43,213 34,481
TI 0.1374 0.1543 0.6108 0.0024 0.1748 0.0721 0.0259
GS 0.3166 0.1493 0.9303 0.0254 0.3945 0.3152 0.2029
ME 0.3191 0.1021 0.6317 0.0775 0.3702 0.3156 0.2626
IS 0.6195 0.1746 0.9783 0.2097 0.7686 0.6163 0.4928
ES 0.4370 0.0919 0.7250 0.0795 0.4903 0.4330 0.3944
URS 0.4305 0.1676 0.9189 0.0361 0.5425 0.4408 0.3191

Note: GTE, green transformation efficiency; EE, economic environment; TI, technological innovation; GS, government support; ME, market environment; IS, industrial structure; ES, element structure; URS, urban-rural structure; Max, maximum; Min, minimum.

4. Result analysis

In this study, we used data from 2019 to analyze the green transformation configuration of RBCs. The different configurations represent the paths of urban green transformation combined with economic environment, technological innovation, government support, market environment, and other conditions. Then, this study used the data from 2013, 2016, and 2019 to explore the dynamic evolution trend of configuration solutions.

4.1. Green transformation configuration analysis

4.1.1. Necessity conditions analysis

Before conducting conditional configuration analysis of green transformation, we examined the necessity of a single condition. Using the calibrated data, a necessity conditions analysis was carried out, as shown in Table 3. The consistency of all conditions in Table 3 is less than 0.9000, indicating that a single condition cannot constitute a necessary condition for interpreting the results. This result shows the systematic nature and complexity of the green transformation of RBCs; that is, the system functions of RBCs are affected by the linkage and matching of the system environment and system structural conditions to achieve green transformation.
Table 3 Results of necessary conditions analysis.
Condition Consistency Coverage Condition Consistency Coverage
EE 0.5322 0.5701 ~ME 0.5906 0.6193
~EE 0.5437 0.5549 IS 0.5262 0.5491
TI 0.5157 0.5546 ~IS 0.5621 0.5887
~TI 0.5676 0.5771 ES 0.5044 0.5309
GS 0.5073 0.5222 ~ES 0.5852 0.6075
~GS 0.5584 0.5928 URS 0.5215 0.5447
ME 0.4937 0.5145 ~URS 0.5589 0.5847

Note: ~ indicates that the condition does not exist.

4.1.2. Conditional configuration analysis

Different from the necessity conditions analysis, the conditional configuration analysis was used to configure the adequacy of different conditions for the green transformation of RBCs. Since consistency can measure the adequacy of a conditional configuration, it should generally be greater than the empirical critical value of 0.8000. Therefore, we chose a consistency threshold of 0.8000 and a case frequency threshold of 1.0000. After configuration analysis of cases that meet the requirements, complex solutions, parsimonious solutions, and intermediate solutions were generally obtained. This study used the fsQCA to explore the conditional configuration of green transformation and present the configuration analysis results, as shown in Table 4. A conditional factor is a core condition if it occurs in both intermediate and parsimonious solutions and a marginal condition if it occurs only in intermediate solutions.
Table 4 Conditional configuration analysis of green transformation.
Variable Configuration
1 2a 2b 3 4 5 6
System environment EE $\otimes$
TI $\otimes$ $\otimes$
GS - $\otimes$
ME - $\otimes$
System structure IS $\otimes$ $\otimes$ $\otimes$ $\otimes$ $\otimes$ $\otimes$
ES - $\otimes$ $\otimes$ $\otimes$ $\otimes$
URS $\otimes$ $\otimes$ $\otimes$
Consistency 0.8159 0.9157 0.8881 0.8433 0.8100 0.8220 0.8956
Raw coverage 0.0818 0.0975 0.1021 0.0428 0.0713 0.0571 0.0726
Unique coverage 0.0252 0.0154 0.0215 0.0266 0.0398 0.0422 0.0562
Overall solution consistency 0.8870
Overall solution coverage 0.3322

Note: ● indicates the presence of core conditions; indicates the presence of marginal conditions; $\otimes$ indicates the absence of core conditions; indicates the absence of marginal conditions; - represents that the conditions are dispensable.

Table 4 shows that there are seven configurations (1, 2a, 2b, 3, 4, 5, and 6) that produce high-efficiency green transformation of RBCs, thus forming six paths. The overall solution consistency is 0.8870 and the overall solution coverage is 0.3322, indicating that 88.70% of the study cases that meet the seven types of configurations achieve the high GTE. The following description is a detailed analysis of the configuration path of the green transformation of RBCs.
Path 1: economy-innovation co-driven model. The economic environment and technological innovation play a central role in this path. By relying on a sound economic foundation and strong technological innovation, RBCs can achieve a high GTE. The economic foundation provides strong material support, such as funds and resources, for the green transformation of RBCs, thereby improving the GTE of RBCs. As a typical city, Luzhou City has adhered to the support of scientific and technological innovation in recent years and has created 39 national-level scientific and technological innovation platforms, and the added value of industrial high-tech industries above a designated size was expected to increase by 14.00% in 2020. Luzhou City has gradually explored a new road of high-quality development with ecological priority and green development, providing a “Luzhou Model” that can be used for reference in the green transformation of resource-exhausted cities.
Path 2: innovation-driven model. Technological innovation is a fundamental driving force for the green transformation of RBCs. When a city’s technological innovation is high, it can reduce the impact of deficiencies in industrial structure and element structure, effectively enhance its industrial, technological, and ecological competitiveness, and help its green transformation. Therefore, the innovation-driven model can be applied to cities with better resource endowments and economic conditions, as well as cities with poor urban development conditions and foundations, and its universality is strong. Typical cities include Bozhou and Hechi cities. In recent years, Bozhou City has focused on improving technological innovation capabilities and continuously promoted energy-saving industry development. It has released a multitude of innovative policies, such as the “Five Development Action Plans of Bozhou”. Currently, Bozhou City has successively approved 5 national-level green factories, 5 national-level green products, and 11 provincial-level green factories, effectively promoting the city’s green transformation.
Path 3: economic-government support model. Path 3 shows that a better economic environment and a greater financial support can achieve a high GTE. Taking Yulin City as an example and relying on resource advantages, the economy of Yulin City has developed rapidly. In 2019, the total GDP reached 4.1363×10¹¹ CNY, and the GDP per capita was 1.2091×10⁵ CNY, ranking the first in Shaanxi Province. The sound economic foundation and financial support provided strong support for Yulin City to establish an industry-university-research exchange mechanism, strengthen the introduction of talent and technological innovation, improve the transformation and exchange of achievements, and continuously promote its green transformation.
Path 4: market-element-urban-rural co-driven model. In this path, market environment, element structure, and urban-rural structure play a core role, and economic environment and technological innovation play an auxiliary role. According to the urban management concept, RBCs can use the market mechanism to adjust the dislocation of urban development requirements and the development environment and then reconfigure resource elements and functions to solve problems, such as insufficient urban development elements and backward infrastructure, to achieve green transformation. Therefore, improving the level of marketization can help RBCs form a more competitive and broader market environment and a more complete market mechanism, further optimize their resource allocation, and promote green transformation and development. Typical cities for this path include Sanming and Longyan cities. Relying on a better market environment, Sanming City has continuously promoted ecological industrialization and industrial ecologicalization. In 2020, the energy consumption per unit of GDP in Sanming City decreased by 5.78% annually, and the cumulative decrease was 21.20%. The total energy consumption decreased by 1.92% year-on-year, and the reduction rate ranked the second in Fujian Province. Moreover, Sanming City continuously optimizes the structure of investment, talent, and energy, effectively transforms ecological advantages and resource advantages into development advantages, and realizes the green transformation of the industrial base.
Path 5: government-market-urban-rural co-driven model. This path reflects the combined role of government support, market environment, and urban-rural structure in the green transformation process of RBCs. When the economic foundation and industrial structure are relatively insufficient, cities rely on the guiding role of the government to establish and improve a long-term mechanism for adjusting market environment and urban-rural structure and to form an effective model for urban transformation. Typical case cities include Heihe and Hegang cities. Heihe City relies on resources and location advantages to vigorously develop the port economy, continuously increase investment promotion, accelerate urban ecological industry development, and strive to build a highland for Sino-Russian cross-border cooperation to promote the city’s green development.
Path 6: industry-urban-rural co-driven model. The path shows that a reasonable industrial structure and urban-rural structure supplemented by a good economic foundation can alleviate the impact of relative deficiencies, such as technological innovation and market environment. Typical cities on this path include Wuhai and Yangquan cities. Wuhai City is an important coal and coke base in China. In recent years, relying on advantageous industries, Wuhai City has continuously explored industrial transformation and upgrading, actively developed a green circular economy, and shifted from extensive production to deep processing. Focusing on leading industries, such as coke oven gas, coal tar, methanol, and liquefied natural gas, Wuhai City has continuously extended its industrial chain and has become a pilot city for the green transformation of RBCs in China and a demonstration city for a circular economy.

4.1.3. Alternative relationship analysis

Identifying the interaction between factors is one of the advantages of configuration analysis. By comparing and analyzing the configuration of RBCs with the high GTE, this study finds that there is a certain alternative relationship between the element combinations of system environment and system structure.
By comparing configurations 1, 3, and 6, it can be found that for RBCs with a favorable economic environment, the combination of technological innovation, government support, industrial structure, and urban-rural structure can achieve mutual substitution and realize a green transformation of RBCs, as shown in Figure 2a. A comparative analysis of configurations 4 and 5 shows that when RBCs have a relatively reasonable market environment and urban-rural structure, government support can compensate for deficiencies in economic environment, technological innovation, and element structure, as shown in Figure 2b. According to the comparative analysis results of configurations 4 and 6, when cities do not have advantages in technological innovation, market environment, factor structure, etc., they can choose to adjust and transform the industry reasonably and optimize the industrial structure to achieve green transformation, as shown in Figure 2c. By comparing configurations 5 and 6, it can be found that in cities with relatively balanced urban-rural structure, government support, and market environment, economic environment and industrial structure can have a certain alternative relationship in the urban green transformation, as shown in Figure 2d.
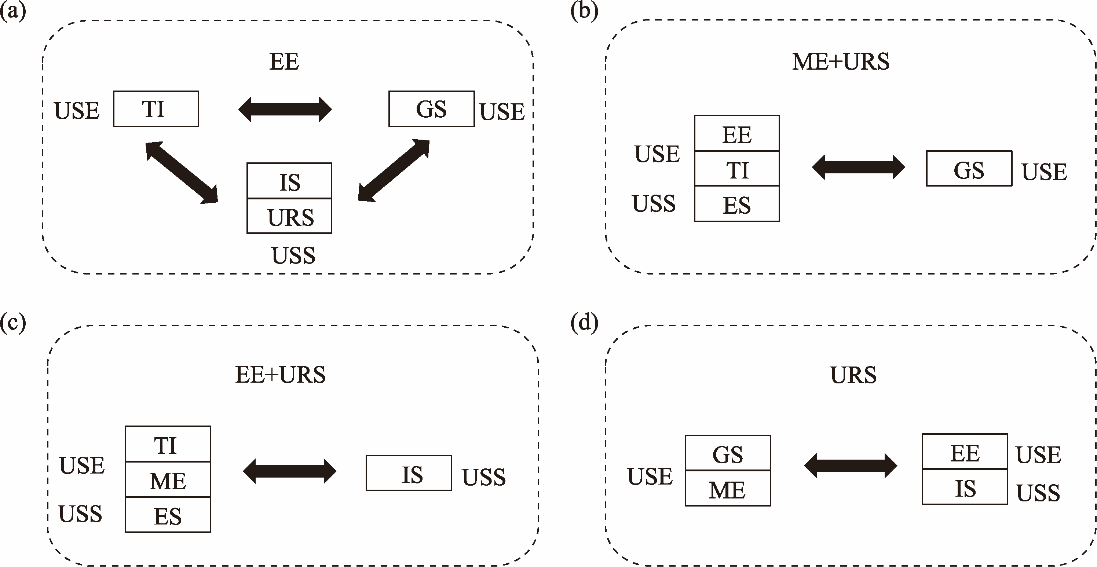
Fig. 2. Alternative relationship of condition combinations. (a), alternative relationships for configurations 1, 3, and 6; (b), alternative relationships for configurations 4 and 5; (c), alternative relationships for configurations 4 and 6; (d), alternative relationships for configurations 5 and 6. USE, urban system environment; USS, urban system structure.
The alternative relationship between system environment and system structure elements shows that for the green transformation of RBCs in 2019, economic environment, market environment, and urban-rural structure play more important roles. Economic environment plays a fundamental role; market environment can provide transformative vitality and improve resource allocation and utilization efficiency; and the optimization of urban-rural structure can provide more resources for urban transformation and development and accelerate the development of urban market environment.

4.2. Dynamic evolution of configuration solutions

The dynamic evolution trend of configuration solutions exhibits staged characteristics, as shown in Figure 3, which shows the dynamic evolution trend of configuration solutions in 2013, 2016, and 2019. This study revealed that with changes in the development characteristics and key issues of RBCs, the factors and effects affecting the green transformation also change, resulting in different configuration solutions.
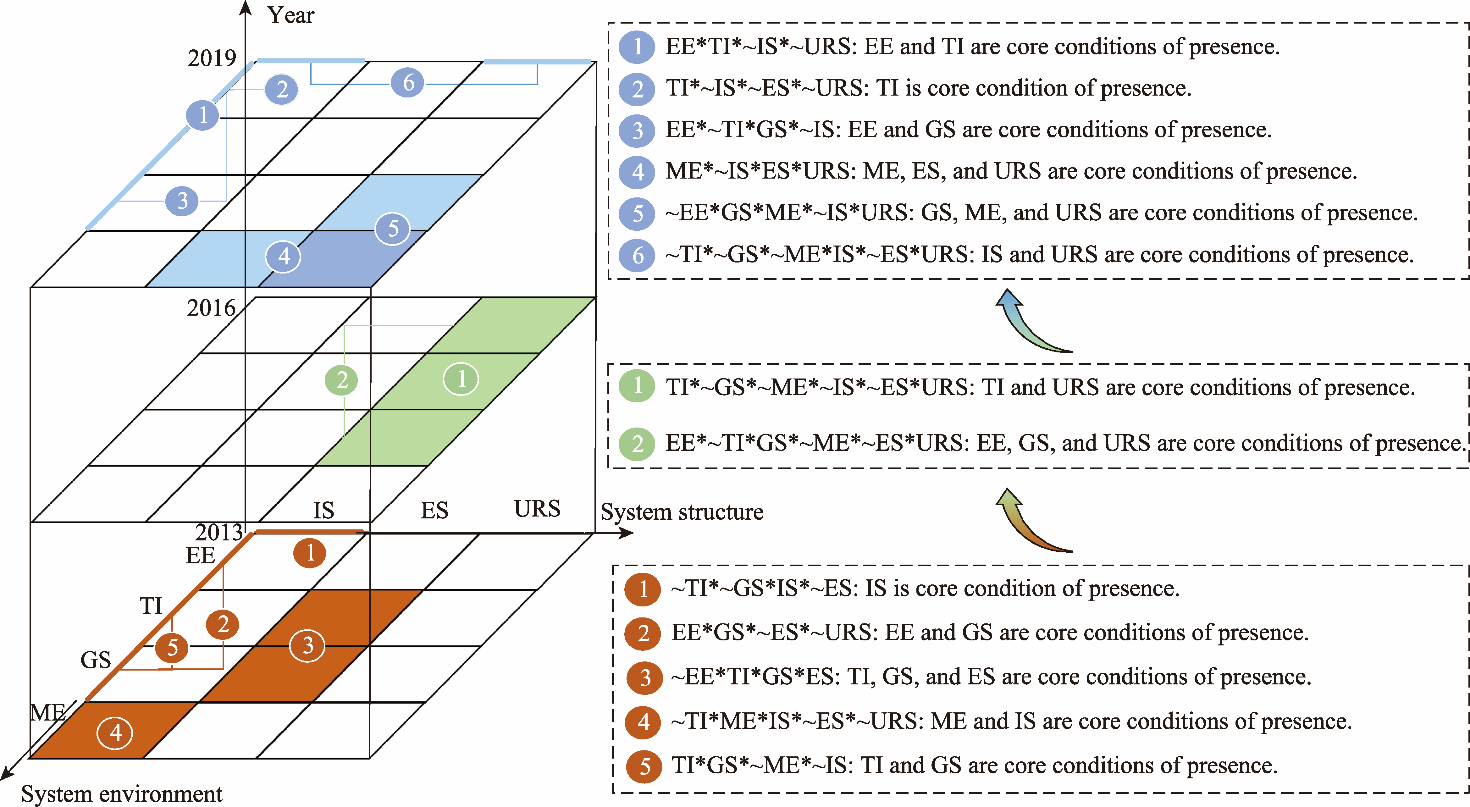
Fig. 3. Dynamic evolution of configuration solutions from 2013 to 2016 then to 2019. * indicates Boolean multiplication and ~ indicates that the condition does not exist.
The stage differences of RBCs lead to dissimilar element combinations and development paths. Specifically, in 2013, five development paths were formed: industry-led, economy-government co-driven, market-industry co-driven, innovation-government factor co-driven, and innovation-government support. In 2016, two development paths of innovation-led and economic-government support under the urban and rural economic structure were formed. In 2019, under the synergy of system environment elements and system structure elements, six paths were formed: economy-innovation co-driven, innovation-driven, economic-government support, market-element- urban-rural co-driven, government-market-urban-rural co-driven, and industry-urban-rural co-driven. The interaction between system environment elements (economic environment, technological innovation, government support, and market environment) and system structure elements (industrial structure, element structure, and urban-rural structure) is obvious, both intertwining and complementing each other.
There are similarities in the key factors of the combination of elements at different stages. Economic environment, technological innovation, and government support are the core conditions of configuration in three stages, indicating that these three conditions play essential roles in urban green transformation. By focusing on technological innovation, which relies on the city’s economic environment and government support, a variety of green transformation paths, such as innovation-driven, innovation-government support, and economy-innovation co-driven, have been explored and formed. Economic environment and government support provide a better material foundation for the green transformation of RBCs, while technological innovation provides an inexhaustible impetus.

5. Discussion

Using the fsQCA, this study provides several highly adaptable reference paths for the green transformation of RBCs from a configuration perspective. Compared to the existing studies, this study mainly emphasizes the following points.
First, this study revealed that no single factor is a necessary condition for the green transformation of RBCs. According to the necessity analysis results, we found that the highest consistency among the single conditions is 0.5906, which is far lower than the standard of 0.9000, indicating that there is no necessary condition for improving GTE in the system environment and system structure elements of RBCs (Schneider and Wagemann, 2012). This is in line with the findings in the study of Jing et al. (2020) related to urban economic development. The green transformation of RBCs is a complex systematic project (He et al., 2023); we cannot discuss the driving role of a factor without considering other factors, and we cannot ignore the influence of interactions between factors (Dong et al., 2021). This study further revealed that the combination of multiple conditional elements is an effective path for realizing the green transformation of RBCs.
Eliminating the dependence on energy-intensive and polluting resource-based sectors is an indispensable component of realizing the green transformation of RBCs (Zhang et al., 2022; Hou et al., 2024). RBCs can choose a variety of ways to reduce energy and resource consumption and improve sustainable development (Du et al., 2024; Liu et al., 2024). Hence, a green transformation path has the characteristic of the same destination through different paths; that is, a green transformation is a systematic action resulting from various factors. Moreover, the research results also revealed that the lack of a single element is not a key factor in green transformation, and there are multiple feasible paths for realizing the green transformation of RBCs. Similarly, one path does not fit all RBCs (Ruhlandt et al., 2020). Therefore, when formulating urban development strategies, managers do not need to pay much attention to a certain environment or structure element of urban system but should focus on the comparative advantages and disadvantages of the city to choose an appropriate transformation path. For example, cities with insufficient openness in market environment can choose the industry-urban-rural co-driven path, and cities with insufficient industrial structure can choose the innovation-driven path, market-element-urban-rural co-driven path, etc.
Second, urban differences have an important impact on the formation of green transformation paths. A possible explanation for this might be that differences in the resource endowment, economic foundation, and industrial structure of RBCs play a critical role in the formation of different green transformation paths (Wang et al., 2021). Since there are differences in resource endowment, economic foundation, industrial structure, etc., among RBCs, there are also discrepancies in their green development level (Yang et al., 2019; Hu et al., 2020; Liu et al., 2020), and variances in the roles of policy support (Li et al., 2020; Wang et al., 2022), technological innovation (Zhai and An, 2021), and environmental legislation (Zhou et al., 2023). This has led to the formation of different combinations of elements and transformation paths. By focusing on urban system environment and system structure elements and relying on RBCs’ development characteristics, multiple paths, such as economy-innovation co-driven, innovation-driven, and economy-government support, were identified in 2019. For example, Luzhou City, which has a relatively high level of economic foundation and technological innovation, has chosen the economy-innovation co-driven transformation path. Sanming and Longyan cities, which have better market environment and element structure have formed a path of market-element-urban-rural co-driven. Therefore, city managers can compare improvement paths to achieve a greater GTE according to the city’s development status, resource endowments, etc., and choose a path that is suitable for their development. Referring to the transformation path of typical cities, low-efficiency cities can adjust the element combination of urban system environment and system structure to realize the green transformation of the city.
Third, economic environment, government support, and technological innovation play a more common role in promoting the green transformation of RBCs. According to the results of the multi-period analysis, economic environment, technological innovation, and government support are the core conditions of the multiple paths, which are important conditions for realizing the green transformation of RBCs. This is similar to the findings of previous study related to urban green development (Lin et al., 2021). Although these elements are not necessary factors for urban green transformation, effectively improving, enhancing, and utilizing these conditions can have a multiplier effect on the accelerated realization of the green transformation of RBCs. In particular, technological innovation is the key driver of the green transformation of RBCs (Liao and Li, 2022). On the one hand, technological innovation can enhance the production level, improve resource input-output efficiency and recycling efficiency, and alleviate the problem of resource constraints in urban transformation (Cheng et al., 2024). On the other hand, technological innovation can accelerate the upgrading of clean energy technologies and products, reduce pollution emissions, and help cities develop in a green and high-quality way (Zhao et al., 2023). RBCs need to adhere to an innovation-driven orientation, improve policy guidance and support mechanisms, continue to enhance technological innovation capabilities, and create a new engine for urban green transformation. Thus, local governments should formulate economic and environmental policy systems for the green transformation of RBCs based on urban development patterns, accelerating technological innovation to drive urban green transformation by establishing financial support and policy guidance mechanisms (Ruan et al., 2020). According to the “14th Five-Year Plan to Support the High-quality Development Implementation Scheme of Demonstration Zones for Industrial Transformation and Upgrading of Old Industrial Cities and Resource-Based Cities”, cities such as Changzhi and Tongling can formulate and issue various new policies for science and technology and new policies for talent, accelerate the construction of national innovative cities, and strive for national policy and financial support. Meanwhile, cities should optimize the system of policy tools based on the effects of existing policies and institutions, improve the allocation and utilization efficiency of resources, such as capital, labor, energy, and water resources, and achieve continuous improvement in the green transformation of RBCs.

6. Conclusions

Based on organizational management system theory, in this study, we first constructed an urban management system analysis framework for the green transformation of RBCs. Then, we used the fsQCA to explore the adaptability and alternative factors influencing the green transformation of RBCs and to clarify a development model that adapts to the green transformation of RBCs in China. Moreover, multi-period analysis was used to determine the dynamic evolution trend of the green transformation configuration solution and clarify the key influencing factors.
The main conclusions are as follows. The green transformation paths of RBCs have the characteristic of the same destination through different paths. The interaction and synergy of various system environment elements and structure elements have produced six paths to drive a high GTE: economy-innovation co-driven, innovation-driven, economy-government support, market-element-urban-rural co-driven, government-market-urban-rural co-driven, and industry-urban-rural co-driven. Under certain conditions, the element combinations of system environment and system structure are complementary and substitutable. For example, in cities with better economic environments, there is a substitution relationship among technological innovation, government support, industrial structure, and urban-rural structure. The core conditions (market environment, element structure, and urban-rural structure) and marginal conditions (economic environment and technological innovation) work together to promote the green transformation of RBCs, showing complementary effects. Differences in RBCs lead to different element combinations and green transformation paths, but there are certain similarities in key factors. Economic environment, government support, and technological innovation play a universal role in improving the green transformation of RBCs.

Authorship contribution statement

GONG Qunxi: data curation, writing - original draft, writing - review & editing, conceptualization, methodology, project administration, and funding acquisition. The author approved the manuscript.

Declaration of conflict of interest

The author declares that he has no known competing financial interests or personal relationships that could have appeared to influence the work reported in this paper.

Acknowledgements

This study was supported by the Chongqing Social Science Planning Fund, China (2023BS034) and the Science and Technology Project of Chongqing Jiaotong University, China (F1230069).
[1]
Amara N., Rhaiem M., Halilem N., 2020. Assessing the research efficiency of Canadian scholars in the management field: Evidence from the DEA and fsQCA. J. Bus. Res. 115, 296-306.

[2]
Bacon E., Williams M., Davies G., 2020. Coopetition in innovation ecosystems: A comparative analysis of knowledge transfer configurations. J. Bus. Res. 115, 307-316.

[3]
Chang H.S., Man C.Y., Su Q., 2021. Research on the site selection of watershed public facilities as multi-use detention basin: An environmental efficiency perspective. Environ. Sci. Pollut. Res. 28, 38649-38663.

[4]
Cheng M.L., Wang J.B., Yang S.L., et al., 2024. The driving effect of technological innovation on green development: From the perspective of efficiency. Energ. Policy. 188, 114089, doi: 10.1016/j.enpol.2024.114089.

[5]
Chuah S.H.W., Tseng M.L., Wu K.J., et al., 2021. Factors influencing the adoption of sharing economy in B2B context in China: Findings from PLS-SEM and fsQCA. Resour. Conserv. Recy. 175, 105892, doi: 10.1016/j.resconrec.2021.105892.

[6]
Dong F., Li Y.F., Qin C., et al., 2021. How industrial convergence affects regional green development efficiency: A spatial conditional process analysis. J. Environ. Manage. 300, 113738, doi: 10.1016/j.jenvman.2021.113738.

[7]
Du X.L., Wang Y., Chen F.X., 2024. Evaluation of coal-resource-based cities transformation based on CRITIC-TOPSIS model. Sustain. Cities. Soc. 103, 105271, doi: 10.1016/j.scs.2024.105271.

[8]
Du Y.Z., Liu Q.C., Cheng J.Q., 2020. What kind of ecosystem for doing business will contribute to city-level high entrepreneurial activity? A research based on institutional configurations. Journal of Management World. 36, 141-155 (in Chinese).

[9]
Du Y.Z., Li J.X., Liu Q.C., et al., 2021. Configurational theory and QCA method from a complex dynamic perspective: Research progress and future directions. Journal of Management World. 37(3), 180-197 (in Chinese).

[10]
Duygan M., Fischer M., Pärli R., et al., 2022. Where do smart cities grow? The spatial and socio-economic configurations of smart city development. Sustain. Cities. Soc. 77, 103578, doi: 10.1016/j.scs.2021.103578.

[11]
Fan G.G., Wang X.L., Ma G.R., 2011. The contribution of marketization to China’s economic growth. Economic Research Journal. 46, 4-16 (in Chinese).

[12]
Fan X.Y., Liu B., Wang K., et al., 2023. Research on the spatiotemporal characteristics of RECC in resource-based cities based on the EWM-CPM: A case study of Sichuan Province, China. Ecol. Indic. 147, 109979, doi: 10.1016/j.ecolind.2023.109979.

[13]
Gao J., Wu X.X., Zhang Y., 2020. Research on systematic urban regeneration and implementation way: Based on the complex adaptive system theory. Urban Development Studies. 27(2), 62-68 (in Chinese).

[14]
He S.Y., Lee J., Zhou T., et al., 2017. Shrinking cities and resource-based economy: The economic restructuring in China’s mining cities. Cities. 60, 75-83.

[15]
He T.T., Song H.P., Chen W.Q., 2023. Recognizing the transformation characteristics of resource-based cities using night-time light remote sensing data: Evidence from 126 cities in China. Resour. Policy. 85, 104013, doi: 10.1016/j.resourpol.2023.104013.

[16]
Hou G.M., 2018. Discussion on the construction of organizational management systematics based on China’s practice in innovational development. China Soft Science. 7, 105-116 (in Chinese).

[17]
Hou Y.R., Yang M., Li Y.J., 2024. Coordinated effect of green expansion and carbon reduction: Evidence from sustainable development of resource-based cities in China. J. Environ. Manage. 349, 119534, doi: 10.1016/j.jenvman.2023.119534.

[18]
Hu B.W., Zhou L., Wang Z.H., et al., 2020. Spatiotemporal differentiation of green economic efficiency of resource-based cities in arid area. Resources Science. 42, 383-393 (in Chinese).

DOI

[19]
Jiang C.J., Li J.T., Liu J.L., 2022. Does urbanization affect the gap between urban and rural areas? Evidence from China. Socio-Econ. Plan. Sci. 82, 101271, doi: 10.1016/j.seps.2022.101271.

[20]
Jing R., Wang J.P., Shi X., et al., 2020. Influencing factors and models of economic development of China’s resource-based cities from a systematic perspective. Journal of Industrial Technological Economics. 317, 132-142 (in Chinese).

[21]
Li B., Dewan H., 2017. Efficiency differences among China’s resource-based cities and their determinants. Resour. Policy. 51, 31-38.

[22]
Li J.L., Xu B., 2018. Curse or blessing: How does natural resource abundance affect green economic growth in China? Economic Research Journal. 53(9), 151-167 (in Chinese).

[23]
Li M.Y., Yan T.H., 2018. Evaluation of industrial transformation efficiency of China’s resource-based cities based on DEA model and information entropy: Case study of 40 resource-based cities in China. Science and Technology Management Research. 38, 86-93 (in Chinese).

[24]
Li Q., Zeng F.E., Liu S., et al., 2020. The effects of China’s sustainable development policy for resource-based cities on local industrial transformation. Resour. Policy. 71, 101940, doi: 10.1016/j.resourpol.2020.101940.

[25]
Liao B., Li L., 2022. Spatial division of labor, specialization of green technology innovation process and urban coordinated green development: Evidence from China. Sustain. Cities. Soc. 80, 103778, doi: 10.1016/j.scs.2022.103778.

[26]
Lin J.B., Wang Y.J., Zhang X.H., et al., 2021. Spatial and temporal characteristics and influencing factors of urban resources and environmental efficiency in the Yellow River Basin. Journal of Natural Resources. 36(1), 208-222 (in Chinese).

[27]
Liu B., Wang J.M., Jing Z.R., et al., 2020. Measurement of sustainable transformation capability of resource-based cities based on fuzzy membership function: A case study of Shanxi Province, China. Resour. Policy. 68, 101739, doi: 10.1016/j.resourpol.2020.101739.

[28]
Liu Q., Li F.J., Peng L., et al., 2024. Multiple evaluation framework of sustainability development in resource-based cities: A case study of China. Ecol. Indic. 158, 111338, doi: 10.1016/j.ecolind.2023.111338.

[29]
Liu T., Li Y.J., Ren Y.Y., et al., 2019. Economic transformation influencing factors of resources-exhausted cities in China. Resources & Industries. 21(1), 45-53 (in Chinese).

[30]
Long R.Y., Li H.F., Wu M.F., et al., 2021. Dynamic evaluation of the green development level of China’s coal-resource-based cities using the TOPSIS method. Resour. Policy. 74, 102415, doi: 10.1016/j.resourpol.2021.102415.

[31]
Luo X., Jin Y.Y., Wang C.C., 2017. Research on the green development efficiency of resource-based cities in central China in terms of transformation and upgrading. Journal of Southwest Jiaotong University (Social Sciences). 18(6), 77-83 (in Chinese).

[32]
Ministry of Housing and Urban-Rural Development of the People’s Republic of China, 2014. China Urban Construction Statistical Yearbook 2013. Beijing: China Statistics Press (in Chinese).

[33]
Ministry of Housing and Urban-Rural Development of the People’s Republic of China, 2017. China Urban Construction Statistical Yearbook 2016. Beijing: China Statistics Press (in Chinese).

[34]
Ministry of Housing and Urban-Rural Development of the People’s Republic of China, 2020. China Urban Construction Statistical Yearbook 2019. Beijing: China Statistics Press (in Chinese).

[35]
Muvingi J., Peer A.A.I., Jablonský J., et al., 2023. Hierarchical groups DEA super-efficiency and group TOPSIS technique: Application on mobile money agents locations. Expert Syst. Appl. 234, 121033, doi: 10.1016/j.eswa.2023.121033.

[36]
National Bureau of Statistics of China, 2014. China Urban Statistical Yearbook 2013. Beijing: China Statistics Press (in Chinese).

[37]
National Bureau of Statistics of China, 2017. China Urban Statistical Yearbook 2016. Beijing: China Statistics Press (in Chinese).

[38]
National Bureau of Statistics of China, 2020. China Urban Statistical Yearbook 2019. Beijing: China Statistics Press (in Chinese).

[39]
Pan M.J., Zhao X., Lv K.J., et al., 2023. Internet development and carbon emission-reduction in the era of digitalization: Where will resource-based cities go? Resour. Policy. 81, 103345, doi: 10.1016/j.resourpol.2023.103345.

[40]
Qiu F.D., Yuan H., Zhu C.G., et al., 2018. The industrial transformation effects and influencing factors of regenerative resource-based cities in China. Economic Geography. 38(11), 68-77 (in Chinese).

[41]
Ragin C.C., Strand S.I., 2008. Using qualitative comparative analysis to study causal order: Comment on Caren and Panofsky. Sociol. Method. Res. 36(4), 431-441.

[42]
Ruan F.L., Yan L., Wang D., 2020. The complexity for the resource-based cities in China on creating sustainable development. Cities. 97, 102571, doi: 10.1016/j.cities.2019.102571.

[43]
Ruan F.L., Yan L., Wang D., 2021. Policy effects on the sustainable development of resource-based cities in China: A case study of Yichun City. Resour. Policy. 72, 102145, doi: 10.1016/j.resourpol.2021.102145.

[44]
Ruhlandt R.W.S., Levitt R., Jain R., et al., 2020. One approach does not fit all (smart) cities: Causal recipes for cities’ use of “data and analytics”. Cities. 104, 102800, doi: 10.1016/j.cities.2020.102800.

[45]
Schneider C., Wagemann C., 2012. Set-Theoretic Methods for the Social Sciences:A Guide to Qualitative Comparative Analysis. Cambridge: Cambridge University Press.

[46]
Stokke O.S., 2007. Qualitative comparative analysis, shaming, and international regime effectiveness. J. Bus. Res. 60(5), 501-511.

[47]
Su Q., 2020. Long-term flood risk assessment of watersheds under climate change based on the game cross-efficiency DEA. Nat. Hazards. 104, 2213-2237.

[48]
Sun C.Z., Jiang K., Zhao L.S., 2017. Measurement of green efficiency of water utilization and its spatial pattern in China. Journal of Natural Resources. 32(12), 1999-2011 (in Chinese).

[49]
Tao K.T., Zhang S.D., Zhao Y.H., 2021. What does determine performance of government public health governance? A study on co-movement effect based on QCA. Journal of Management World. 37(5), 128-138, 156 (in Chinese).

[50]
Tian X.S., Ning Y.C., 2014. The countermeasures research into industries transformation and upgrading approaches of maturing resource-based city: Take the case of Jixi. China Mining Magazine. 23(12), 33-36 (in Chinese).

[51]
Wang X.N., Sun W., 2020. Transformation efficiency of resource-based cities in the Yellow River Basin and its influencing factors. Progress in Geography. 39(10), 1643-1655 (in Chinese).

DOI

[52]
Wang Y.Q., Li Y.Y., Zhu Z.W., et al., 2021. Evaluation of green growth efficiency of oil and gas resource-based cities in China. Clean Technol. Envir. 23, 1785-1795.

[53]
Wang Y.J., Chen H., Long R.Y., et al., 2022. Has the sustainable development planning policy promoted the green transformation in China’s resource-based cities? Resour. Conserv. Recy. 180, 106181, doi: 10.1016/j.resconrec.2022.106181.

[54]
Wang Y.J., Chen H., Long R.Y., et al., 2023a. How does population aging affect urban green transition development in China? An empirical analysis based on spatial econometric model. Environ. Impact Asses. 99, 107027, doi: 10.1016/j.eiar.2022.107027.

[55]
Wang Z.R., Fu H.Q, Zhou L., 2023b. Multiple urban resilience evaluation of resource-based cities’ sustainable transformation effect. Resour. Conserv. Recy. 191, 106912, doi: 10.1016/j.resconrec.2023.106912.

[56]
Wen Q., Hou K.Y., Zheng D.Y., et al., 2022. Evaluation of industrial transformation capability and optimization path of growing resource-based cities: A case study of Yulin, China. Scientia Geographica Sinica. 42(4), 682-691 (in Chinese).

DOI

[57]
Wu J.X., Nie X., Wang H., 2023. Curse to blessing: The carbon emissions trading system and resource-based cities’ carbon mitigation. Energ. Policy. 183, 113796, doi: 10.1016/j.enpol.2023.113796.

[58]
Xu J.W., Xu X.Y., Chen X.P., et al., 2013. Evaluation on urban efficiencies of Gansu Province based on DEA-Cross Model. Journal of Natural Resources. 28(4), 618-624 (in Chinese).

[59]
Yang Y.Y., Guo H.X., Chen L.F., et al., 2019. Regional analysis of the green development level differences in Chinese mineral resource-based cities. Resour. Policy. 61, 261-272.

[60]
Yu J.Y., 2014. Qian Xuesen system scientific thought and system science system. Scientific Decision Making. 12, 2-22 (in Chinese).

[61]
Yuan H., Zhu C.L., 2018. Do national high-tech zones promote the transformation and upgrading of China’s industrial structure. China Industrial Economics. 8, 60-77 (in Chinese).

[62]
Zhai B., Nie H., 2010. Study on the coordinated urban-rural development in the transformation of resource-based cities-Take Baiyin of Gansu Province as an example. Urban Stud. 17, 68-90.

[63]
Zhai X.Q., An Y.F., 2021. The relationship between technological innovation and green transformation efficiency in China: An empirical analysis using spatial panel data. Technol. Soc. 64, 101498, doi: 10.1016/j.techsoc.2020.101498.

[64]
Zhang M., Yan T.H., Ren Q.Z., 2022. Does innovative development drive green economic growth in resource-based cities? Evidence from China. Front. Env. Sci. 9, 745498, doi: 10.3389/fenvs.2021.745498.

[65]
Zhao X.C., Long L.C., Yin S., et al., 2023. How technological innovation influences carbon emission efficiency for sustainable development? Evidence from China. Environ. Dev. Sustain. 14, 100135, doi: 10.1016/j.resenv.2023.100135.

[66]
Zhou J.T., Yu X.W., Chen X., 2023. How does environmental legislation guide urban green transition development? Evidence from China. J. Environ. Manage. 345, 118813, doi: 10.1016/j.jenvman.2023.118813.

[67]
Zhou L., Che L., Zhou C.H., et al., 2020. Spatio-temporal evolution and influencing factors of urban green development efficiency in China. J. Geogr. Sci. 30, 724-742.

Outlines

/