Full Length Article

Climatic and non-climatic factors driving the livelihood vulnerability of smallholder farmers in Ahafo Ano North District, Ghana

  • Frank BAFFOUR-ATA , a, * ,
  • Louisa BOAKYE a ,
  • Moses Tilatob GADO a ,
  • Ellen BOAKYE-YIADOM a ,
  • Sylvia Cecilia MENSAH a ,
  • Senyo Michael KWAKU KUMFO a ,
  • Kofi Prempeh OSEI OWUSU a ,
  • Emmanuel CARR a ,
  • Emmanuel DZIKUNU a ,
  • Patrick DAVIES b
Expand
  • aDepartment of Environmental Science, Kwame Nkrumah University of Science and Technology, Kumasi, AK-039-5028, Ghana
  • bDepartment of Meteorology and Climate Science, Kwame Nkrumah University of Science and Technology, Kumasi, AK-039-5028, Ghana
* E-mail address: (Frank BAFFOUR-ATA).

Received date: 2023-08-19

  Revised date: 2024-03-13

  Accepted date: 2024-08-24

  Online published: 2025-08-14

Abstract

Smallholder farmers in Ahafo Ano North District, Ghana, face multiple climatic and non-climatic issues. This study assessed the factors contributing to the livelihood vulnerability of smallholder farmers in this district by household surveys with 200 respondents and focus group discussions (FGDs) with 10 respondents. The Mann-Kendall trend test was used to assess mean annual rainfall and temperature trends from 2002 to 2022. The relative importance index (RII) value was used to rank the climatic and non-climatic factors perceived by respondents. The socioeconomic characteristics affecting smallholder farmers’ perceptions of climatic and non-climatic factors were evaluated by the binary logistic regression model. Results showed that mean annual rainfall decreased (P>0.05) but mean annual temperature significantly increased (P<0.05) from 2002 to 2022 in the district. The key climatic factors perceived by smallholder farmers were extreme heat or increasing temperature (RII=0.498), erratic rainfall (RII=0.485), and increased windstorms (RII=0.475). The critical non-climatic factors were high cost of farm inputs (RII=0.485), high cost of healthcare (RII=0.435), and poor condition of roads to farms (RII=0.415). Smallholder farmers’ perceptions of climatic and non-climatic factors were significantly affected by their socioeconomic characteristics (P<0.05). This study concluded that these factors negatively impact the livelihoods and well-being of smallholder farmers and socioeconomic characteristics influence their perceptions of these factors. Therefore, to enhance the resilience of smallholder farmers to climate change, it is necessary to adopt a comprehensive and context-specific approach that accounts for climatic and non-climatic factors.

Cite this article

Frank BAFFOUR-ATA , Louisa BOAKYE , Moses Tilatob GADO , Ellen BOAKYE-YIADOM , Sylvia Cecilia MENSAH , Senyo Michael KWAKU KUMFO , Kofi Prempeh OSEI OWUSU , Emmanuel CARR , Emmanuel DZIKUNU , Patrick DAVIES . Climatic and non-climatic factors driving the livelihood vulnerability of smallholder farmers in Ahafo Ano North District, Ghana[J]. Regional Sustainability, 2024 , 5(3) : 100157 . DOI: 10.1016/j.regsus.2024.100157

1. Introduction

Agriculture is a vital sector that determines the economy and livelihoods of Sub-Saharan Africa (SSA). This is because it accounts for approximately 17.0% of the gross domestic product (GDP) of the SSA (OECD/FAO, 2016). It employs more than half of the total labor force in the SSA and provides a livelihood for millions of smallholder farmers who manage 80.0% of the farmland (Sakho-Jimbira and Hathie, 2020). Agriculture is very important for food security and is an important food source for the population of the SSA, which is projected to increase to 21.00×10⁹ persons by 2050 (OECD/FAO, 2016). Agriculture is a driving factor of sustainable development, poverty reduction, and human rights protection as it can contribute to building inclusive and participatory approaches that empower females, youth, indigenous people, and other vulnerable and marginalized groups (Sakho-Jimbira and Hathie, 2020).
In Ghana, agriculture continues to be the backbone of the national economy. It contributed approximately 18.3% of Ghana’s GDP in 2019 (Oxford Business Group, 2022). It also employs about 45.0% of the labor force, especially in rural areas (Oxford Business Group, 2022). It is a source of food, income, foreign exchange, and raw materials for the industries in Ghana (FAO, 2023). However, some climatic and non-climatic factors hinder agricultural productivity and sustainability in Ghana. Climatic factors are related to changes in weather, such as rainfall, temperature, drought, flood, and storms. Non-climatic factors are related to the social, economic, political, institutional, and environmental conditions that influence the availability and access of resources, services, markets, and opportunities for smallholder farmers (Nyantakyi-Frimpong and Bezner-Kerr, 2015).
Climatic and non-climatic factors drive the livelihood vulnerability of smallholder farmers by reducing their ability to cope with and adapt to risks and uncertainties. Livelihood vulnerability is the degree to which a livelihood system is susceptible to harm due to exposure to a perturbation (Antwi-Agyei et al., 2017). It depends on three dimensions: exposure, sensitivity, and adaptive capacity (IPCC, 2007). Exposure is the extent to which a livelihood system is subjected to potential harm due to external environmental stresses or changes. Sensitivity is the degree to which a livelihood system is affected by a climatic or non-climatic factor. Adaptive capacity is the ability of a livelihood system to adjust to a climatic or non-climatic factor or cope with its consequences. Climatic and non-climatic factors can affect the exposure, sensitivity, and adaptive capacity of smallholder farmers in different ways. For example, erratic rainfall can increase the risk of drought and crop failure (Baffour-Ata et al., 2021). Land degradation increases the sensitivity of smallholder farmers to soil erosion and nutrient loss (Stocking, 2014). Poverty reduces the adaptive capacity of smallholder farmers to invest in improved seeds and fertilizers (Asfaw et al., 2016). These factors can also interact and create synergistic effects that amplify their impacts on smallholder farmers (Morton, 2007). For instance, drought can intensify land degradation by reducing soil moisture and vegetation cover. Land degradation can also exacerbate poverty by reducing agricultural productivity and income. Poverty can limit smallholder farmers’ access to climate information and extension services that can help them cope with drought.
Although climatic and non-climatic factors pose threats to the livelihood vulnerability of smallholder farmers, few studies have explored these threats in Ghana. For instance, Antwi-Agyei et al. (2017) stated that climatic factors (such as lack of rainfall, high temperature, and drought) and non-climatic factors (such as lack of infrastructure, high labor cost, and land tenure issues) affect agricultural activities of smallholder farmers in the northern zone of Ghana. Similarly, Derbile et al. (2022) reported that smallholder farmers in the Upper West Region of Ghana are highly vulnerable to climatic and non-climatic factors such as rainstorms, bushfires, and sand mining.
All these studies have documented impressive evidence that smallholder farmers are exposed to the adverse effects of climatic and non-climatic factors in Ghana. However, sustained research is required to investigate the climatic and non-climatic factors driving the livelihood vulnerability of smallholder farmers in Ahafo Ano North District, a predominantly agricultural district in Ghana. Furthermore, empirical evidence on the effect of the socioeconomic characteristics of smallholder farmers on their perceptions of climatic and non-climatic factors in Ghana is lacking.
To reduce the livelihood vulnerability of smallholder farmers and enhance their resilience, it is essential to consider their perceptions of climatic and non-climatic factors and integrate their socioeconomic characteristics in the design and implementation of adaptation strategies. Therefore, the following questions were analysed: (i) what are the trends of mean annual rainfall and temperature in Ahafo Ano North District from 2002 to 2022? (ii) what are the existing climatic and non-climatic factors driving the livelihood vulnerability of smallholder farmers in Ahafo Ano North District? and (iii) what are the socioeconomic characteristics that affect smallholder farmers’ perceptions of climatic and non-climatic factors in Ahafo Ano North District?

2. Materials and methods

2.1. Study area

This study was conducted in Ahafo Ano North District (06°47′-07°02′N, 02°26′-02°04′W) of Ashanti Region, Ghana, with a total area of 593.7 km2 (Fig. 1). The mean annual temperature of Ahafo Ano North District is 28.0°C, the mean annual rainfall is 1750 mm, and vegetation is mostly moist deciduous forest type, which is quite similar to the rain forest in this district. Agriculture employs about 70.0% of the total labor force in this district. Crops cultivated in Ahafo Ano North District include cocoa, plantain, maize, cassava, cocoyam, rice, oil palm, citrus, and vegetables. Ahafo Ano North District was selected because it is one of the major cocoa-producing districts in Ghana (GSS, 2024). Cocoa is very important to the economy of this country and to the livelihoods of many smallholder farmers (Oyekale, 2021). This district is located in the wet semi-equatorial zone, which is vulnerable to the adverse effects of climate change (MoFA, 2024). Furthermore, Ahafo Ano North District has a diverse population of approximately 6.35×10⁴ persons with different ethnics, religious, and socioeconomic backgrounds (GSS, 2024). We selected four intensive-farming communities, namely, Manfo, Odikrom Nkwanta, Tepa, and Subriso, based on the advice of district agricultural extension officers.
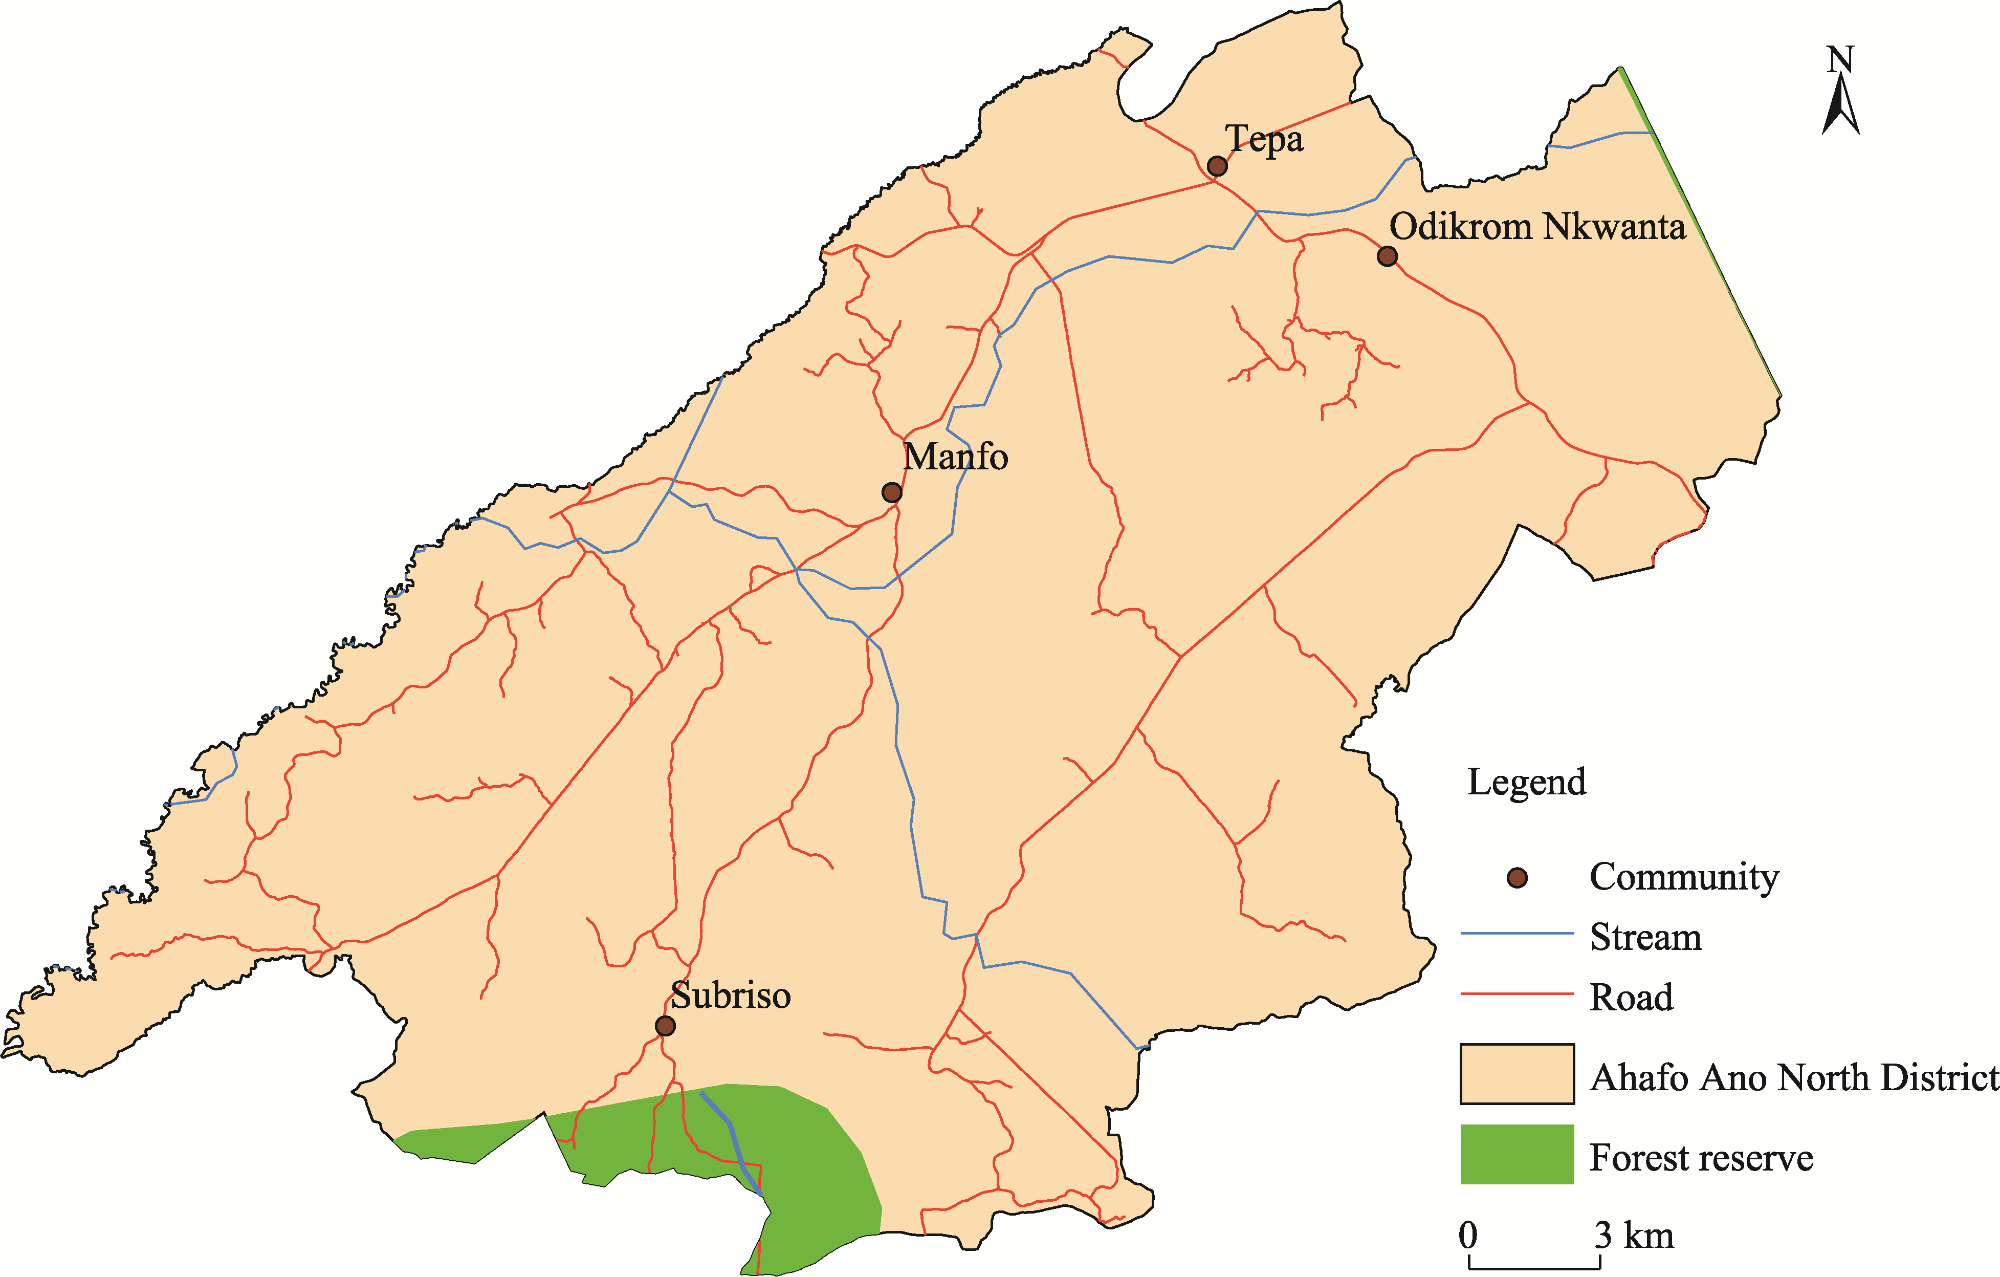
Fig. 1. Overview of the study area.

2.2. Data collection

2.2.1. Rainfall and temperature data

Monthly rainfall and temperature data from 2002 to 2022 in Ahafo Ano North District were obtained from the Ghana Meteorological Agency (GMet) in Accra, Ghana. Rainfall and temperature are the most critical climatic factors affecting the agricultural production and food security of smallholder farmers in Ahafo Ano North District (GSS, 2014; Oyekale, 2021). This is because rainfall and temperature determine the length and onset of the growing season, the yield and quality of crops, the incidence of pests and diseases, and the fertility and erosion of soil (Lobell et al., 2011). Moreover, rainfall and temperature also influence the income, expenditure, and consumption patterns of smallholder farmers, as well as their coping and adaptation strategies (Fosu-Mensah et al., 2012). Other climatic factors, such as wind speed, humidity, and solar radiation, have less direct and significant impacts on the livelihood vulnerability of smallholder farmers (Thornton et al., 2014).

2.2.2. Questionnaire survey

Primary data were collected through household surveys and focus group discussions (FGDs). A questionnaire was designed to capture relevant information about the climatic and non-climatic factors affecting the livelihoods and well-being of smallholder farmers in Ahafo Ano North District. This questionnaire included the demographic and socioeconomic characteristics of smallholder farmers, their farming practices and systems, and their perceptions and experiences of climatic and non-climatic factors. It was pre-tested with a small sample of smallholder farmers and other relevant actors, including the director of the Department of Agriculture and the agricultural extension officers in Ahafo Ano North District, and then we revised the questionnaire based on their feedback. The minimum sample size required for this study was estimated using the formula of Yamane (1973) as follows:
$n=\frac{N}{1+N{{(\varphi )}^{2}}}$,
where n is the sample size; N is the total population (N=402 persons); and φ is the margin of error (φ=0.05). The sample size was approximated to be 200 persons. We randomly selected 50 households in each community. Some local enumerators who spoke the local language (Asante Twi) and understood the local culture were hired and trained to assist in conducting the household surveys. A face-to-face interview method was adopted to administer the questions to the heads of households, who were smallholder farmers at their homes or farms. This helped establish rapport and trust with smallholder farmers, clarify any doubts or misunderstandings, and observe the contexts and conditions of smallholder farmers. Each survey lasted about 20 min. The responses of smallholder farmers were translated into English and appropriately indicated on the physical questionnaires. The questionnaire survey was conducted in April 2023.

2.2.3. Focus group discussions (FGDs)

FGDs were designed to facilitate productive and interactive discussions among respondents. FGDs included a set of open-ended questions that elicit the views, experiences, and preferences of respondents concerning the climatic and non-climatic factors that affect their livelihoods and well-being. Care was taken to ensure that FGDs were clear, relevant, and culturally appropriate for respondents. This study preliminary tested FGDs with a small group of smallholder farmers and then revised it based on their feedback. We selected respondents based on criteria such as gender and in-depth knowledge of climatic and non-climatic factors. Gender is a significant factor driving the livelihood vulnerability of smallholder farmers due to the differing roles, responsibilities, and access to resources between males and females. By including respondents of different genders, we aimed to capture a broad spectrum of experiences and insights that reflect the gender dimensions of vulnerability and resilience in the face of climatic and non-climatic factors. Also, respondents with substantial knowledge of climatic and non-climatic factors are likely to provide detailed information on the complex interactions between these factors and livelihood systems. On average, 10 respondents, including chief smallholder farmers, assemblypersons, youth leaders, and traditional authorities, were selected from each community for FGDs. Before FGDs, local moderators who spoke the local language and understood the local culture were hired and trained to facilitate the discussions. It was ensured that respondents and moderators were informed and willing to participate in this interview, following the principles of informed consent, confidentiality, and anonymity. With the permission of respondents, a digital recorder was used to record the responses of FGDs. FGDs were later transcribed and translated into English. Each FGD lasted about 15 min. Respondents were allowed to review the data after FGDs to confirm whether their responses were representative of their real willingness.

2.3. Research methods

Thematic analysis was performed to analyze the qualitative data obtained from FGDs because it provided a thorough understanding of the perceptions of respondents by identifying common themes and patterns (King and Brooks, 2018). Climatic data were not interpreted arbitrarily and were subjected to rigorous statistical tests and uncertainty assessments to determine the significance and confidence of the observed trends.
Therefore, mean annual rainfall and temperature trends were determined using the Mann-Kendall trend test, which is a valuable method for evaluating trends in climatic data because it has several advantages over other methods. Some of its advantages are as follows: (i) it is a nonparametric test, which means it does not assume any specific data distribution and makes it more robust and flexible to deal with different data types, such as skewed, non-normal, or missing values (Wang et al., 2020); (ii) it can detect linear, nonlinear, and monotonic trends such as consistently increasing or decreasing, which is important because climatic data may exhibit complex and nonlinear patterns over time; and (iii) it is less sensitive to outliers and extreme values, which may distort the results of other methods such as linear regression. Here, the magnitudes of mean annual rainfall and temperature trends were estimated using Sen’s slope estimator (Atta-ur-Rahman and Dawood, 2017). The procedure for calculating the Mann-Kendall trend test was as follows:
$S=\sum\limits_{k=1}^{m-1}{\sum\limits_{j=k+1}^{m}{sign({{x}_{j}}-{{x}_{k}})}}$,
where S is the statistic value of the Mann-Kendall trend test; m represents the total number of data points during 2002-2022; k is the earlier time point during 2002-2022; j is the later time point at the time series; sign is the mathematical symbolic function; xj represents the data point at time point j; and xk represents the data point at earlier time point k. An extremely high positive value of S denotes an upward trend, while a highly negative value of S denotes a downward trend.
$sign({{x}_{j}}-{{x}_{k}})=\left\{ \begin{matrix} 1 \\ 0 \\ -1 \\ \end{matrix} \right.\begin{matrix} \text{ if }{{x}_{j}}-{{x}_{k}}>0 \\ \text{ if }{{x}_{j}}-{{x}_{k}}=0 \\ \text{ if }{{x}_{j}}-{{x}_{k}}<0 \\ \end{matrix}$
Moreover, it was critical to calculate the probability between the statistic value of the Mann-Kendall trend test and the sample size. This study computed probability according to the study of Forthofer and Lehnen (1981) as follows:
$VAR(S)=\frac{1}{18}\left( n(n-1)(2n+5)-\sum\nolimits_{q=1}^{g}{{{t}_{q}}}-{{1}_{q}}+5 \right)$,
where VAR(S) means the variance of the Mann-Kendall trend test; g is the number of tied groups (a tied group is a set of sample data having the same value); and tq is the number of data points in the qth group.
A normalized test statistic value Z was computed as follows:
$Z=\left\{ \begin{matrix} \begin{matrix} \frac{S-1}{\sqrt{VAR(S)}} & \text{if }S>0 \\ \end{matrix} \\ \begin{matrix} {} & \text{ 0 if }S=0 \\ \end{matrix} \\ \begin{matrix} \frac{S+1}{\sqrt{VAR(S)}} & \text{if }S<0 \\ \end{matrix} \\ \end{matrix} \right.$.
The probability linked with the normalized test statistic value was computed. The probability density function for a normal distribution with a mean of 0 and a standard deviation of 1 was given as follows:
$f(Z)=\frac{1}{\sqrt{2\text{ }\!\!\pi\!\!\text{ }}}{{\text{e}}^{\frac{-{{Z}^{2}}}{2}}}$,
where f(Z) is the probability density function.
The coefficient of variation (CV) was used to estimate rainfall and temperature variability during the study period. The CV was calculated as follows:
$\text{CV}=\frac{\sigma }{\mu }$,
where σ is the standard deviation of rainfall or temperature during the study period and μ  is the mean value of rainfall or temperature during the study period.
The relative importance index (RII) was also used to rank the climatic and non-climatic factors perceived by respondents. The RII was calculated as follows:
$\text{RII}=\sum{\frac{W}{A\times n}}$,
where W is the weight given to each climatic or non-climatic factor perceived by respondents and ranges from 1 to 2 (where “1” indicates “Yes” and “2” means “No”); and A is the highest weight (A=2 in this case). The range of RII is as follows: 0.000<RII≤1.000.
The effect of socioeconomic characteristics of smallholder farmers on their perceptions of climatic and non-climatic factors was assessed by the binary logistic regression model. The model was shown as follows:
$Y=\log \left( \frac{p}{1-p} \right)={{\beta }_{0}}+{{\beta }_{1}}{{X}_{1}}+{{\beta }_{2}}{{X}_{2}}+\cdots +{{\beta }_{z}}{{X}_{z}}+\varepsilon $,
where Y is the dependent variable; p represents the estimated likelihood of the dependent variable; β0 is the intercept; β1, β2, …, βz are the coefficients of the independent variables; z is the number of independent variables; X1, X2, …, Xz are the independent variables; and ε is the error term.
In this study, the dependent variable was smallholder farmers’ perceptions of each climatic or non-climatic factor, while the independent variables were the socioeconomic characteristics of smallholder farmers. A variance inflation factor (VIF) was used to perform multicollinearity tests to check whether the independent variables were highly correlated—a high correlation among independent variables can affect the accuracy and interpretation of the model (Alin, 2010). However, the VIF values of all independent variables were less than 3.0. The VIF value of more than 3.0 for an independent variable in a regression model implies probable multicollinearity (Baffour-Ata et al., 2023a). A 95.0% confidence interval was set for the binary logistic regression model. The fundamental hypothesis was that smallholder farmers’ perceptions of climatic and non-climatic factors would be affected positively or negatively by their socioeconomic characteristics. All statistical analyses were performed using the SPSS version 26 (International Business Machines, Armonk, the United States).

3. Results and discussion

3.1. Socioeconomic characteristics of respondents

Respondents comprised more males (131 persons) than females (69 persons) (Table 1). This was not surprising as males constitute the highest proportion of the employment sector in Ahafo Ano North District (GSS, 2014). Amengor et al. (2016) and Bolang and Osumanu (2019) reported that males dominate agriculture in Ghana, unlike females who play minor roles in agriculture. This is because farming is regarded as a male-dominated occupation, whereas females are expected to perform domestic and reproductive roles in many rural areas of Ghana (OWP, 2020). Females also face discrimination and stereotypes that limit their access to land, credit, education, agricultural extension services, and markets. Moreover, approximately 58.5% of respondents (117 persons) were between 41 and 60 years old. Szabo et al. (2021) claimed that most smallholder farmers are between 41 and 60 years old in many parts of the world. This finding indicates an aging crisis in agriculture, as young people increasingly choose urban areas over rural areas. This threatens food security and sustainability, as the current generation of experienced smallholder farmers will retire soon, and there will be fewer smallholder farmers to take over the task of growing food for the country.
Table 1 Socioeconomic characteristics of respondents.
Independent
variable
Category Male (n=131) Female (n=69) Total sample size (n=200)
Frequency Percentage (%) Frequency Percentage
(%)
Frequency Percentage
(%)
Age 21-40 years old 34 26.0 28 40.6 62 31.0
41-60 years old 84 64.1 33 47.8 117 58.5
Above 60 years old 13 9.9 8 11.6 21 10.5
Years of living in the
community
Below 5 a 4 3.1 4 5.8 8 4.0
5-10 a 31 23.7 12 17.4 43 21.5
Above 10 a 96 73.3 53 76.8 149 74.5
Origin Native 104 79.4 50 72.5 154 77.0
Settler 27 20.6 19 27.5 46 23.0
Household size 1-5 persons 36 27.5 21 30.3 57 28.5
6-10 persons 80 61.1 45 65.2 125 62.5
11-15 persons 15 11.4 3 4.4 18 9.0
Educational level Non-formal education 40 30.5 23 33.3 63 31.5
Primary education 72 55.0 43 62.3 115 57.5
Secondary school education 19 14.5 3 4.4 22 11.0
Marital status Single 17 13.0 5 7.2 22 11.0
Married 106 81.0 58 84.1 164 82.0
Divorced or separated 8 6.0 6 8.7 14 7.0
Type of farmland tenure system Rented 22 16.8 9 13.0 31 15.5
Owned 87 66.4 48 69.6 135 67.5
Purchased 22 16.8 12 17.4 34 17.0
Farming experience Less than 5 a 15 11.5 14 20.3 29 14.5
6-10 a 37 28.2 24 34.8 61 30.5
11-20 a 30 22.9 17 24.6 47 23.5
Above 20 a 49 37.4 14 20.3 63 31.5
Access to agricultural extension services 110 84.0 41 59.4 151 75.5
Access to climate and weather information 51 39.0 17 24.6 68 34.0
Estimated farm income
per season
<65.15 USD/season 5 3.8 11 16.0 16 8.0
65.15-129.20 USD/season 16 12.2 18 26.1 34 17.0
>129.20 USD/season 110 84.0 40 58.0 150 75.0
Membership in an organization 90 68.7 36 52.2 126 63.0
Estimated farm size <2 hm2 29 22.1 33 47.8 62 31.0
2-4 hm2 61 46.6 22 31.9 83 41.5
>4 hm2 41 31.3 14 20.3 55 27.5

Note: n, sample size.

Specifically, 74.5% of respondents (149 persons) lived in the community above 10 a, and approximately 77.0% of them (154 persons) were natives of the region, implying that they were aware of the past and present climatic conditions in their localities. Most respondents (115 persons; 57.7%) had primary education, indicating that smallholder farmers had some literacy and numeracy skills that could improve their agricultural productivity and income. Most respondents (135 persons; 67.5%) had their farmlands, implying that they had more security, autonomy, and incentives to invest in their land and improve their productivity and income (Tenaw et al., 2009).
Approximately 75.5% of respondents (151 persons) had access to agricultural extension services—this is a good indicator because these services provide smallholder farmers with the necessary goods and services to boost their agricultural output and most importantly increase their awareness of the best adaptation practices to combat climatic and non-climatic factors (Afsar and Idrees, 2019). Less than half of respondents (68 persons; 34.0%) had access to climate and weather information. Such information allows smallholder farmers to make climate-smart decisions that can improve their adaptation and resilience to climate change (Baffour-Ata et al., 2022).

3.2. Trends of mean annual rainfall and temperature

Results showed that mean annual rainfall was variable (CV=0.101) but decreased (Kendall’s tau= -0.110, Sen’s slope= -0.299) from 2002 to 2022 (Fig. 2). The mean annual temperature was also erratic (CV=0.011) but significantly increased (P<0.05) during 2002-2022 in Ahafo Ano North District. Anning et al. (2022) and Baffour-Ata et al. (2023b) suggested that rainfall is erratic and temperature is significantly increasing in most parts of the Ashanti Region in Ghana. The decreasing rainfall and increasing temperature trends significantly impact agricultural production, food security, livelihoods, and income of smallholder farmers in Ahafo Ano NorthDistrict (GSS, 2014). For instance, changes in the timing, amount, and distribution of rainfall affect the availability and quality of water for irrigation, which is essential for many crops, especially during the drought period (Baffour-Ata et al., 2021). Moreover, changes in rainfall patterns affect soil moisture, nutrient cycling, erosion, and salinity, all of which are important factors for crop growth (Rojas Corradi et al., 2019). The changing rainfall patterns also alter the suitability and productivity of different crops in Ahafo Ano North District because different crops have different water requirements and tolerance levels to drought or flood (Kaur and Kaur, 2017).
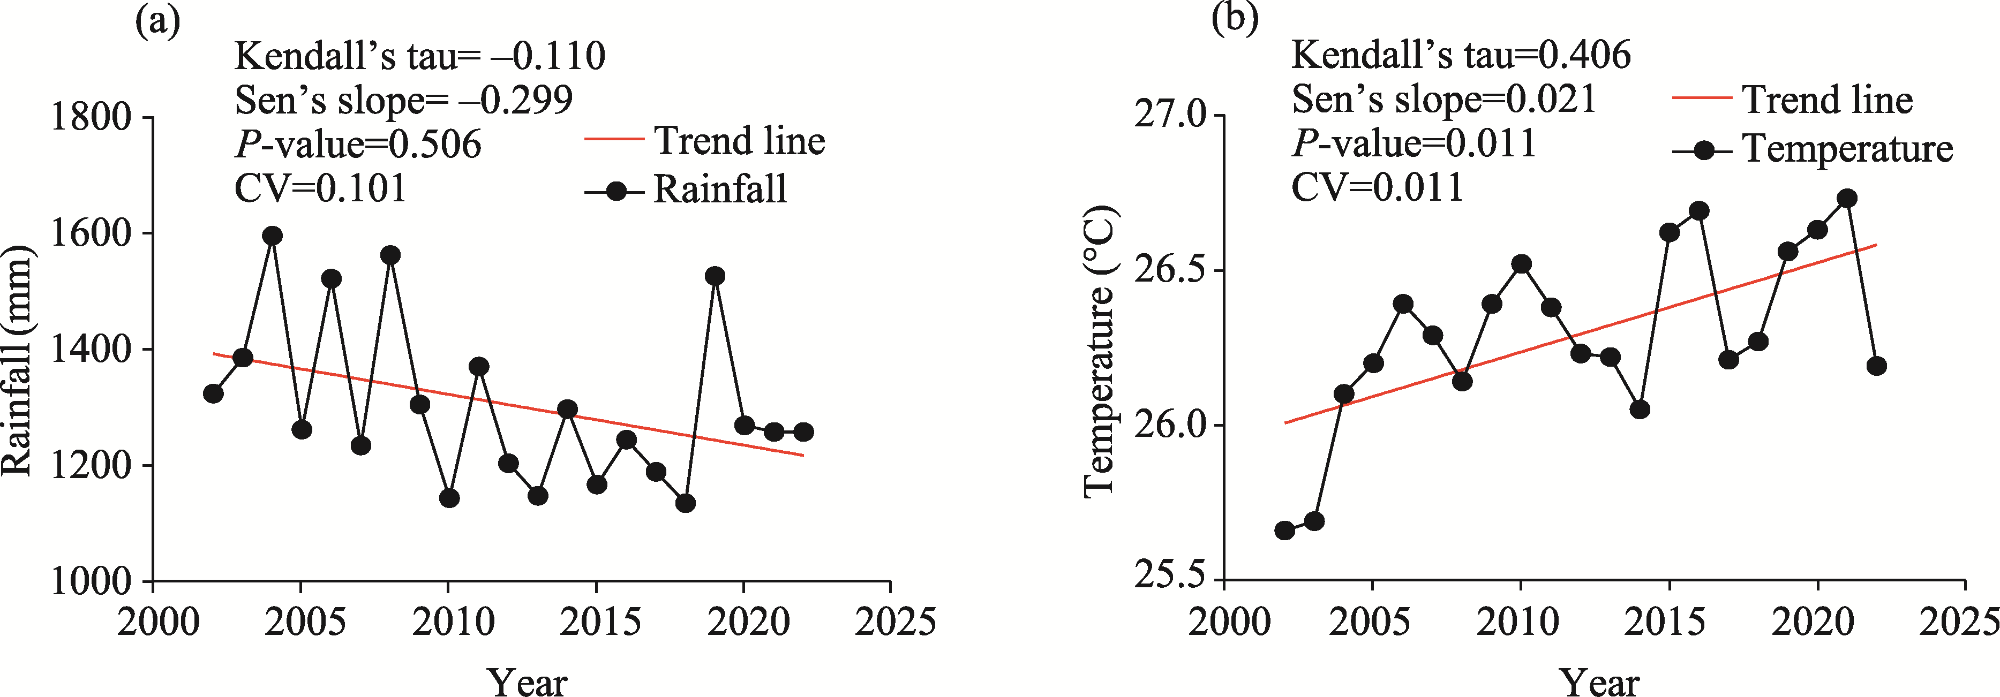
Fig. 2. Mean annual rainfall (a) and temperature (b) in Ahafo Ano North District during 2002-2022. CV, coefficient of variation.
The quantity and quality of agricultural products and the losses in property and other aspects caused by climate change in Ahafo Ano North District were reported by the District Agricultural Development Unit and the Ghana Living Standards Survey (GLSS). For instance, the average crop yield, biomass, and protein content of grain declined by 15.0%, 12.0%, and 10.0% in the study area, respectively, because of changes in rainfall and temperature (MoFA, 2024). The reports also showed that the average cocoa yield and quality decreased by 20.0% and 25.0%, respectively (GSS, 2024; MoFA, 2024). The GSS (2024) indicated that the average income, asset value, and health status of smallholder farmers declined by 18.0%, 22.0%, and 15.0%, respectively, and the number of floods, droughts, and pest outbreaks increased by 30.0%, 25.0%, and 35.0%, respectively. This information provided evidence for the negative impacts of climate change on the quantity and quality of agricultural products, as well as the losses in terms of property and other aspects (e.g., income reduction, increased costs, reduced agricultural productivity, and increased health risks) in Ahafo Ano North District.

3.3. Climatic factors driving the livelihood vulnerability of respondents

The results indicated that the most ranked climatic factor was extreme heat or increasing temperature (RII=0.498) (Table 2). This was followed closely by erratic rainfall (RII=0.485). Increased windstorms ranked the third (RII=0.475); however, low temperature ranked the lowest (RII=0.035). These findings were validated by FGDs.
Table 2 Perceptions of respondents on climatic factors.
Climatic factor Male (n=131) Female (n=69) Total sample size (n=200) RII Rank
Frequency Percentage (%) Frequency Percentage (%) Frequency Percentage (%)
Extreme heat or increasing
temperature
130 99.2 69 100.0 199 99.5 0.498 1
Erratic rainfall 129 98.5 65 94.2 194 97.0 0.485 2
Increased windstorms 125 95.4 65 94.2 190 95.0 0.475 3
Drought or dry period 127 97.0 61 88.4 188 94.0 0.470 4
Reducing rainfall 109 83.2 58 84.1 167 83.5 0.418 5
Decreased air quality 113 86.3 50 72.5 163 81.5 0.408 6
Increased incidence of floods 97 74.0 38 55.1 135 67.5 0.338 7
Increasing rainfall 38 29.0 33 47.8 71 35.5 0.178 8
Lack of rainfall 17 13.0 8 11.6 25 12.5 0.063 9
Low temperature 7 5.3 7 10.1 14 7.0 0.035 10

Note: RII, relative importance index.

Smallholder farmers’ perceptions of erratic rainfall and extreme heat or increasing temperature were consistent with the trend analysis results of mean annual rainfall and temperature in Ahafo Ano North District from 2002 to 2022 (Fig. 2). Similarly, Asamoah and Ansah-Mensah (2020) reported that smallholder farmers in the Bawku area of Ghana perceived increasing temperatures and erratic rainfall as key climatic factors impacting their communities. Moreover, Guodaar et al. (2021) also reported that smallholder farmers in the upper east, upper west, and northern regions of Ghana experienced droughts and intensified heat waves.
Extreme heat or increasing temperature was a critical climatic factor because of its adverse effects on crop production, income, and food security. It can reduce crop yields by affecting the growth, development, and quality of crops and increasing water evaporation from the soil and plants, leading to water stress and drought (Harvey et al., 2018). It can also increase the incidence and severity of pests and diseases that damage crops and reduce their marketability. Furthermore, extreme heat or increasing temperature can affect the health and well-being of smallholder farmers, their families, and livestock by causing heat stress, dehydration, and heat-related illnesses (Harvey et al., 2018). These impacts can reduce the income and food security of smallholder farmers, especially those who depend on rainfed agriculture and have limited access to irrigation, inputs, technology, and insurance. Therefore, extreme heat or increasing temperature was a major challenge for smallholder farmers in Ahafo Ano North District as well as in many other regions worldwide. For example, extreme heat or increasing temperature has reduced the suitability and productivity of some crops, such as cocoa, which is the main cash crop and export commodity of Ahafo Ano North District (Oyekale, 2021). Cocoa requires a humid and cool climate, with optimal temperature in the range of 18.0°C-32.0°C. However, extreme heat or increasing temperature has increased the evapotranspiration and water stress of cocoa trees, leading to lower yield and quality in Ahafo Ano North District. In addition, extreme heat or increasing temperature has increased the vulnerability of crops to pests and diseases, such as the cocoa swollen shoot virus, thereby causing significant losses and income reduction.
Erratic rainfall severely affected crop production, income, and food security of smallholder farmers. Erratic rainfall leads to some adverse consequences such as reduced crop yields, increased incidence and severity of pests and diseases, reduced farm income because of lower yields, higher production costs and lower market prices, and reduced food security (Boillat et al., 2019; Mujeyi et al., 2021). In Ahafo Ano North District, erratic rainfall has affected pest and disease dynamics because some pests and pathogens have benefited from the changing moisture and temperature conditions. For example, erratic rainfall increased the incidence and severity of fungal and bacterial diseases, such as cocoa black pod, reducing cocoa yield and quality (Amfo and Ali, 2020; Oyekale, 2021). Erratic rainfall has also favored the emergence and spread of insect pests such as stem borers, which cause significant damage to maize and other crops in Ahafo Ano North District (Baffour-Ata et al., 2023b).
In addition to these factors, increased windstorms were perceived as a critical climatic factor by smallholder farmers because they can cause severe damage to their crops, livestock, infrastructure, and livelihoods. For instance, increased windstorms destroy crops by uprooting, breaking, or flattening crops (FAO, 2020). Furthermore, increased windstorms can harm livestock by injuring, killing, or displacing them, reducing their productivity and health. They damage infrastructure by blowing away roofs, fences, irrigation systems, and storage facilities, increasing production costs and postharvest losses (FAO, 2020). Increased windstorms enhance vulnerability by exposing smallholder farmers to heightened risks of hunger, poverty, debt, and displacement (FAO, 2020).
In contrast, low temperature was ranked as the least climatic factor in Ahafo Ano North District. Compared with other climatic hazards such as drought, flooding, heat stress, pests, and diseases, low temperature events were less likely to occur and had less impact on crops and livestock. A survey of 860 smallholder farmers of coffee and primary grain in Central America revealed that only 9.0% of smallholder farmers reported negative impacts of low temperature on crop production, 87.0% of smallholder farmers claimed that drought has negative impacts on crop production, 66.0% of them thought that heat stress had negative impacts on crop production, 54.0% of smallholder farmers found negative impacts of pests and diseases on crop production, and 40.0% of smallholder farmers discovered negative impacts of flooding on crop production (Harvey et al., 2018). Similarly, a study of 600 smallholder farmers in Ethiopia showed that low temperature was the least frequently observed climatic factor, and it affected only 8.0% of smallholder farmers, whereas drought, erratic rainfall, and high temperature affected 98.0%, 96.0%, and 88.0% of smallholder farmers, respectively (Frost et al., 2023). One possible reason for the low perceptions of low temperature as a climatic factor is that most smallholder farmers live in low-latitude regions such as Africa, South and Southeast Asia, and Latin America, where mean temperature is relatively high and temperature variability is low. Therefore, low temperature is not a common or severe threat to agricultural systems.
Another possible reason is that some crops and livestock can tolerate or even benefit from low temperatures as long as the temperature does not reach freezing levels. For example, some coffee varieties can produce higher-quality beans in cooler areas (Woetzel et al., 2020), and some animals can cope with cold weather by growing thicker fur or feathers. However, this does not mean that low temperatures do not pose a problem for smallholder farmers. In some regions, such as the highlands of East Africa and South America, low temperatures caused frost damage to crops, thereby reducing crop yields (Adhikari et al., 2015). Low temperatures can also affect the health and productivity of livestock by increasing their energy requirements, reducing their feed intake, and lowering their immunity (Savsani et al., 2015). Moreover, climate change may increase the frequency and intensity of cold spells in some areas, posing new challenges for smallholder farmers who are unprepared or have not adapted to cope with them. Therefore, although low temperature may not be the most pressing climatic factor for smallholder farmers in general, it should be considered and addressed in some situations.

3.4. Non-climatic factors driving the livelihood vulnerability of respondents

The results indicated that the highest ranked non-climatic factor perceived by respondents was high cost of farm inputs (RII=0.485) (Table 3). This was followed by high cost of healthcare (RII=0.435). Poor condition of roads to farms was ranked the third perceived by respondents (RII=0.415). The lowest ranked non-climatic factor was lack of electricity (RII=0.095). These findings were validated using FGDs.
Table 3 Perceptions of respondents on non-climatic factors.
Non-climatic factor Male (n=131) Female (n=69) Total sample size (n=200) RII Rank
Frequency Percentage (%) Frequency Percentage (%) Frequency Percentage (%)
High cost of farm inputs 129 98.5 65 94.2 194 97.0 0.485 1
High cost of healthcare 112 85.5 62 89.9 174 87.0 0.435 2
Poor condition of roads to farms 111 84.7 55 79.7 166 83.0 0.415 3
Lack of money 108 82.4 57 82.6 165 82.5 0.413 4
Lack of infrastructure 96 73.3 46 66.7 142 71.0 0.355 5
High population 81 61.8 52 75.4 133 66.5 0.333 6
High cost of education 79 60.3 45 65.2 124 62.0 0.310 7
Scarcity of labor 77 58.8 44 63.8 121 60.5 0.303 8
Lack of irrigation facilities 77 58.8 43 62.3 120 60.0 0.300 9
Lack of adequate lands 78 59.5 36 52.2 114 57.0 0.285 10
Limited access to the market 60 45.8 28 40.6 88 44.0 0.220 11
Lack of agricultural equipment 56 42.7 26 37.7 82 41.0 0.205 12
Lack of drinking water 47 35.9 29 42.0 76 38.0 0.190 13
Damage to crops by livestock 34 26.0 22 31.9 56 28.0 0.140 14
Sand mining 32 24.4 18 26.1 50 25.0 0.125 15
Illegal mining 37 28.2 13 18.8 50 25.0 0.125 15
Ill health 30 23.0 18 26.1 48 24.0 0.120 17
Lack of electricity 26 19.8 12 17.4 38 19.0 0.095 18
These findings are in line with those of Antwi-Agyei et al. (2017), who reported that smallholder farmers in Ghana perceived high cost of farm inputs, lack of money, and limited access to the market as the key non-climatic factors. Smallholder farmers perceived high cost of farm inputs as a critical non-climatic factor because it affects their profitability and productivity. Farm inputs such as seeds, fertilizers, pesticides, and irrigation systems are essential for improving crop yields and quality and reducing crop losses and environmental impacts (Fan and Rue, 2020). However, many smallholder farmers face barriers to accessing these inputs, because of a lack of credit, insurance, information, infrastructure, and market linkages (Langyintuo, 2020). Therefore, they often have to buy inputs at relatively high prices from informal or unreliable sources or use low-quality or inappropriate inputs that may harm their crops or the environment (Langyintuo, 2020). These factors can reduce the returns on investment and income of smallholder farmers and limit their ability to adopt more sustainable and resilient farming practices.
High cost of healthcare was also perceived as a critical non-climatic factor in Ahafo Ano North District because it can affect the health, income, and food security of smallholder farmers and their families. According to the World Business Council for Sustainable Development (2023), smallholder farmers are highly vulnerable to health shocks and diseases, such as malaria, tuberculosis, etc., because of their limited access to resources, credit, and basic healthcare facilities. These health problems can reduce their productivity and income, and increase their medical expenses (World Economic Forum, 2022). Moreover, high cost of healthcare can force smallholder farmers to sell their assets (e.g., land, livestock, or crops) to pay for their treatment or cope with income losses. This can reduce their food security and resilience.
Poor condition of roads to farms negatively affected the production, marketing, and income of smallholder farmers in Ahafo Ano North District. It reduces crop quality and quantity because of increased vibrations and damage during transportation (Steyn, 2016). Additionally, Lokesha and Mahesha (2016) claimed that poor condition of roads to farms increases transport costs because of higher fuel consumption, vehicle maintenance, and repair expenses. Such roads also reduce the market value of crops and affect access through delays, spoilage, and loss of crops; and they also reduce farm income because of lower returns on investment, higher production costs, and lower market prices (Sieber and Allen, 2016). Therefore, poor condition of roads to farms poses a substantial challenge for smallholder farmers, especially in Ghana.
The lowest ranked non-climatic factor was lack of electricity, possibly because smallholder farmers in Ghana did not rely heavily on electricity for their farming activities. Most smallholder farmers use traditional or manual methods of cultivation, harvesting, processing, and storage that do not require electricity. Moreover, some smallholder farmers in rural areas of Ghana may have access to off- or mini-grids that provide reliable and affordable electricity for remote areas. Therefore, lack of electricity may not affect the productivity, income, or food security of smallholder farmers to the same extent as other non-climatic factors. However, this does not mean that electricity is not essential or beneficial for smallholder farmers. Electricity can help them improve the efficiency, quality, and added value of their products and increase access to information, markets, and services that can enhance their livelihoods and resilience. Therefore, it is important to improve the access, reliability, affordability, and sustainability of electricity for smallholder farmers.

3.5. Effect of socioeconomic characteristics on smallholder farmers’ perceptions of climatic and non-climatic factors

Results showed that socioeconomic characteristics affected smallholder farmers’ perceptions of climatic factors (Table 4). For example, gender significantly affected (β= -1.348, P=0.001) smallholder farmers’ perceptions of increasing rainfall in Ahafo Ano North District. Males and females may have different tasks and expectations related to farming, such as crop selection, land preparation, irrigation, harvesting, and marketing. These tasks and expectations may influence how they observe and interpret the patterns and impacts of rainfall. For example, females may be more concerned about water availability for domestic use and food security, whereas males may focus more on income generation and market opportunities (Piya et al., 2019). However, mean annual rainfall indicated a decreasing trend in Ahafo Ano North District (Fig. 2a). This trend agrees with the fact that males and females perceived rainfall to be decreasing in the study area (Table 2).
Table 4 Effect of socioeconomic characteristics on smallholder farmers’ perceptions of climatic factors.
Socioeconomic characteristic Extreme heat or increasing temperature Erratic rainfall Increased windstorms Drought or dry period Reducing rainfall Decreased air quality Increased incidence of floods Increasing rainfall Lack of rainfall Lower temperature
Gender -5.313 1.416 0.277 1.064 0.324 0.568 0.541 -1.348** 0.129 -1.214
Age 7.773** 2.931** -0.429 0.475 0.562 0.433 0.823** -1.186** 0.333 -0.983
Years of living in the community -2.005** -1.200 0.844 1.050 -0.883** 1.035 0.130 0.682 -1.450** -0.268
Origin -8.417 -0.413 -2.104 0.775 -0.277 0.188 -0.808 1.099** 0.286 -0.540
Household size 0.962 -1.029 -1.288 -0.474 -0.007 -0.128 -0.413 0.179 -0.502 -1.229
Educational level -4.638 -1.318 1.717 -0.127 0.376 0.706 0.529 0.139 -0.919** -0.524
Marital status -9.394 -1.874 1.221 -0.615 -0.598 0.113 0.369 0.595 -0.409 -2.722**
Type of farmland tenure system 11.022 0.121 -0.071 -0.728 -0.447 -0.513 0.435 0.977** -0.024 0.908
Farming experience -4.276** -1.042 -0.590 0.045 -0.195 0.005 -0.210 0.159 0.162 0.186
Access to agricultural extension services -18.227 -0.011 1.364 0.017 0.676 0.669 1.745** -0.276 -2.017** -1.203
Access to weather and climate information 5.893** -1.945 -0.872 0.078 -0.885 1.863** -0.174 -0.133 -1.135** -1.838
Estimated farm income per season -10.215 0.312 -0.480 -0.693 0.459 -0.770 -0.078 -0.546 -0.426 1.899**
Membership in an organization 1.711 0.558 1.201 0.199 0.871 0.067 -0.361 -0.949** 1.215 5.233**
Estimated farm size -1.514 -1.317 1.509** -0.366 0.448 0.656 -0.415 -0.356 1.062** -1.304**
Nagelkerke R2 0.381 0.378 0.333 0.219 0.164 0.273 0.277 0.311 0.362 0.372

Note: **, significance at the P<0.05 level.

From Table 4 we can see that the age of smallholder farmers had a significant effect on their perceptions of extreme heat or increasing temperature (β=7.773, P=0.032), erratic rainfall (β=2.931, P=0.028), increased incidence of floods (β=0.823, P=0.050), and increasing rainfall (β= -1.186, P=0.004). For example, older smallholder farmers have different levels of exposure and adaptation to extreme heat or increasing temperature compared with younger smallholder farmers. These differences may affect smallholder farmers’ perceptions and interpretations of temperature changes. For instance, older smallholder farmers may not have difficulty remembering past weather patterns, paying attention to current weather forecasts, processing information quickly, and making appropriate decisions based on temperature changes (Eggenberger et al., 2021). It is important to highlight that most smallholder farmers surveyed for this study were older smallholder farmers (Table 1). Additionally, age may affect the perceptions of erratic rainfall for several reasons. For example, older smallholder farmers may have more experience and memory of past rainfall patterns and how they have changed over time. They may be able to compare the current rainfall situation with their historical observations and notice deviations and irregularities (Habtemariam et al., 2016). Furthermore, older smallholder farmers may be more exposed and vulnerable to the effects of erratic rainfall, such as droughts, floods, crop failures, and food insecurity. These factors may make them more aware of and concerned about rainfall variability and its impacts on their livelihoods (Huda, 2013).
Furthermore, smallholder farmers’ perceptions of non-climatic factors were affected by their socioeconomic characteristics. From Table 5 we can see that access to agricultural extension services significantly affected their perceptions of lack of money (β=1.290, P=0.026), high population (β= -1.618, P=0.006), and damage to crops by livestock (β=1.427, P=0.013). Access to agricultural extension services affected their perceptions of lack of money in different ways such as the quality, relevance, and availability of services. According to some studies (Danso-Abbeam et al., 2018; Maake and Antwi, 2022), access to agricultural extension services had positive effects on farm productivity and income, in turn reducing poverty and food insecurity among smallholder farmers. However, these effects were not uniform and depended on various factors such as the education level and age of smallholder farmers, farm size, and type of extension methods used (Maake and Antwi, 2022). Some smallholder farmers perceive access to agricultural extension services as ineffective if they do not meet their needs, preferences, and expectations. For example, some smallholder farmers prefer extension services that are demand-driven and equitable and that prioritize their problems and interests (Maake and Antwi, 2022). Others may value extension services that provide information on improving agricultural production, such as cultivation practices, fertilization, plant protection, and marketing. Moreover, some smallholder farmers may need access to the technologies required for implementing the extension recommendations, such as improved seeds, fertilizers, pesticides, and irrigation systems. Thus, if access to agricultural extension services is effective and responsive to the needs and conditions of smallholder farmers, they can help them increase their farm output and income, thereby improving their livelihoods. However, if access to agricultural extension services is ineffective and irrelevant to the situations and goals of smallholder farmers, it can generate frustration and dissatisfaction among smallholder farmers, thus worsening their sense of poverty.
Table 5 Effect of socioeconomic characteristics on smallholder farmers’ perceptions of non-climatic factors.
Socioeconomic characteristic High cost of farm inputs High cost of healthcare Poor condition of roads to farms Lack of money Lack of infrastructure High population High cost of education Scarcity of labor Lack of irrigation facilities
Gender -1.698 -0.873 -0.150 -0.366 0.065 -0.553 -0.052 -0.265 0.037
Age -0.973 -0.649 0.177 -0.329 -0.129 -0.858** 0.135 -0.012 -0.406
Years of living in the community 15.516 0.949 1.063** -0.676 -0.147 -0.810** -0.328 -0.538 0.129
Origin -17.386 0.796 0.560 -0.770 -0.087 0.206 -0.272 0.483 -0.435
Household size 2.848 0.261 0.148 -0.002 -0.138 0.402 -0.392 0.656** -0.378
Educational level 0.625 0.340 0.836** 0.335 0.164 -0.424 -0.571 -0.063 -0.193
Marital status 1.736 0.400 0.408 0.169 -0.120 -0.256 -0.672 -0.235 -0.288
Type of farmland tenure system 2.106 0.321 -0.150 0.947** -0.310 0.757** 0.724** -0.001 -0.006
Farming experience 2.733 0.250 0.370 0.509 0.134 0.234 -0.145 0.081 0.485**
Access to agricultural extension services 6.062 -0.314 0.560 1.290** 0.441 -1.618** -0.987 -0.127 -0.333
Access to weather and climate information 0.898 -0.309 0.664 0.607 0.609 -1.181** 0.499 -0.427 -0.379
Estimated farm income per season -5.399** -0.342 -0.502 -0.304 -0.365 0.478 0.742** -0.123 0.810
Membership in an organization -1.002 0.889 0.168 -0.838 0.023 1.221** -0.081 0.909** 1.685
Estimated farm size 1.042 -0.666 -0.551 -0.410 0.019 -0.558 1.057** -0.011 -0.221
Nagelkerke R2 0.675 0.155 0.172 0.223 0.092 0.301 0.237 0.131 0.187
Socioeconomic characteristic Lack of adequate lands Limited access to the market Lack of agricultural equipment Lack of drinking water Damage to crops by livestock Sand mining Illegal mining Ill health Lack of electricity
Gender 0.205 -0.033 0.316 -0.289 -0.756 -0.126 0.073 0.213 0.397
Age -0.209 -0.054 0.101 -0.037 0.015 0.489 0.129 -0.156 0.398
Years of living in the community 0.756** 0.321 0.373 -0.401 0.346 -0.284 0.479 0.181 -0.492
Origin -0.825 0.027 0.988** -0.522 0.875 -0.268 -0.295 0.943** -0.375
Household size -0.026 0.246 0.755** 0.694** 0.096 -0.382 0.215 0.220 0.189
Educational level 0.417 0.646** -0.051 -0.015 -0.131 0.214 0.170 0.743** 0.333
Marital status -0.199 0.553 -0.805 0.103 0.967** -0.265 -0.253 0.116 -0.565
Type of farmland tenure system -0.452 -0.549 0.134 0.470 0.243 0.176 0.000 -0.034 0.799
Farming experience 0.047 -0.077 -0.116 -0.213 0.079 -0.018 -0.158 -0.260 -0.081
Access to agricultural extension services -0.120 -0.543 -0.673 0.342 1.427** -0.004 1.433 -0.478 0.241
Access to weather and climate information 1.476** 2.660** 1.112** -0.322 1.076** 0.060 0.716 -0.421 1.013**
Estimated farm income per season -0.319 -0.532 -0.372 0.984** 0.989** -0.360 -0.330 0.585 0.539
Membership in an organization -0.213 0.959** -0.278 0.791 1.909** -0.467 0.507 1.207** 1.215**
Estimated farm size 0.195 -0.042 0.423 0.569** 1.121** -0.108 -0.077 0.454 0.060
Nagelkerke R2 0.228 0.347 0.195 0.143 0.328 0.047 0.182 0.149 0.136

Note: **, significance at the P<0.05 level.

In addition, estimated farm income per season of smallholder farmers significantly affected their perceptions of high cost of farm inputs (β= -5.399, P=0.034), high cost of education (β=0.742, P=0.046), lack of drinking water (β=0.984, P=0.006), and damage to crops by livestock (β=0.989, P=0.013). For instance, estimated farm income per season affected their perceptions of high cost of farm inputs in different ways. According to Myers (2022), farming input costs are rising faster than commodity prices, making it harder to break even. Some of the main inputs that have become more expensive are fertilizers, pesticides, seeds, and land. Some smallholder farmers may perceive high cost of farm inputs as a major challenge threatening their livelihoods and food security. They will struggle to afford the necessary inputs to maintain or increase production and quality. They may face difficulty in accessing credit or insurance to cope with price volatility and weather risks. They have to reduce their input use, diversify their crops, adopt low-cost technologies, or seek off-farm income sources to survive (FAO, 2016). Other smallholder farmers perceive high cost of farm inputs as an opportunity to improve their efficiency and competitiveness. They invest in inputs with high returns and benefits, such as improved seeds, fertilizers, andirrigation systems, and adopt best management practices, such as integrated pest management, conservation agriculture, and precision farming to optimize their input use and reduce their environmental impact, thereby boosting their farm income, and also seek market information, value addition, certification, or collective action to enhance their bargaining power and profitability (FAO, 2016).

4. Conclusions and recommendations

In this study, the livelihood vulnerability of smallholder farmers in Ahafo Ano North District of Ghana was examined. These smallholder farmers were affected by various climatic and non-climatic factors that threaten their food security and well-being. This study provided a comprehensive and contextualized understanding of the livelihood vulnerability of smallholder farmers in Ahafo Ano North District.
This study found that mean annual rainfall decreased but mean annual temperature increased significantly in Ahafo Ano North District from 2002 to 2022. The most important climatic factors for smallholder farmers were extreme heat or increasing temperature, erratic rainfall, and increased windstorms. The most important non-climatic factors were high cost of farm inputs, high cost of healthcare, and poor condition of roads to farms. Smallholder farmers’ perceptions of these factors were influenced by socioeconomic characteristics, such as age, gender, educational level, estimated farm income per season, and estimated farm size.
Smallholder farmers and other stakeholders in the study area should be involved in designing and evaluating interventions that aim to reduce vulnerability and enhance the resilience of local smallholder farmers, and participatory methods and tools should be used for such purposes. The findings from Ahafo Ano North District should be compared with those from other districts or regions in Ghana or other countries. Lessons and best practices for improving the livelihoods and well-being of smallholder farmers should be drawn in similar contexts. It is acknowledged that smallholder farmers’ perceptions of climatic and non-climatic factors may have some limitations, such as recall bias and subjective interpretation. Therefore, future research should complement the perception-based approach with more objective and reliable methods, such as remote sensing and modeling.

Authorship contribution statement

Frank BAFFOUR-ATA: conceptualization, methodology, writing - original draft, writing - review & editing, visualization, and supervision; Louisa BOAKYE: methodology, writing - original draft, and writing - review & editing; Moses Tilatob GADO: formal analysis, investigation, resources, and data curation; Ellen BOAKYE-YIADOM: formal analysis, investigation, resources, and data curation; Sylvia Cecilia MENSAH: formal analysis, investigation, resources, and data curation; Senyo Michael KWAKU KUMFO: formal analysis, investigation, resources, and data curation; Kofi Prempeh OSEI OWUSU: formal analysis, investigation, resources, and data curation; Emmanuel CARR: formal analysis, investigation, resources, and data curation; Emmanuel DZIKUNU: formal analysis, investigation, resources, and data curation; and Patrick DAVIES: data curation. All authors approved the manuscript.

Ethics statement

This study was approved by the Ethics Committee of Kwame Nkrumah University of Science and Technology Humanities and Social Sciences Research, Ghana. Furthermore, respondents provided their informed consent to either provide data or participate in this study.

Declaration of conflict of interest

The authors declare that they have no known competing financial interests or personal relationships that could have appeared to influence the work reported in this paper.

Acknowledgements

The authors truly appreciate the support and contributions of the smallholder farmers surveyed in this study.
[1]
Adhikari U., Nejadhashemi A.P., Woznicki S.A., 2015. Climate change and eastern Africa: A review of impact on major crops. Food Energy Secur. 4(2), 110-132.

[2]
Afsar N., Idrees M., 2019. Farmers’ perception of agricultural extension services in disseminating climate change knowledge. Sarhad Journal of Agriculture. 35(3), 942-947.

[3]
Alin A., 2010. Multicollinearity. In: Gentle, J.E., Scott, D.W., (eds.). Computational Statistics. New York: John Wiley & Sons, Inc. 370-374.

[4]
Amengor E.N., Yeboah H., Fordjour E.K., et al., 2016. Gender analysis of sweet potato production in Ghana. American-Eurasian Journal of Scientific Research. 11(1), 13-20.

[5]
Amfo B., Ali E.B., 2020. Climate change coping and adaptation strategies: How do cocoa farmers in Ghana diversify farm income? Forest Policy Econ. 119, 102265, doi: 10.1016/j.forpol.2020.102265.

[6]
Anning A.K., Ofori-Yeboah A., Baffour-Ata F., et al., 2022. Climate change manifestations and adaptations in cocoa farms: Perspectives of smallholder farmers in the Adansi South District, Ghana. Curr. Res. Environmental Sustainability. 4, 100196, doi: 10.1016/j.crsust.2022.100196.

[7]
Antwi-Agyei P., Quinn C.H., Adiku S.G.K., et al., 2017. Perceived stressors of climate vulnerability across scales in the Savannah zone of Ghana: A participatory approach. Reg. Envir. Chang. 17(1), 213-227.

[8]
Asamoah Y., Ansah-Mensah K., 2020. Temporal description of annual temperature and rainfall in the Bawku Area of Ghana. Adv. Meteorol. (1), 3402178, doi: 10.1155/2020/3402178.

[9]
Asfaw S., McCarthy N., Lipper L., et al., 2016. What determines farmers’ adaptive capacity? Empirical evidence from Malawi. Food Secur. 8(3), 643-664.

[10]
Atta-ur-Rahman, Dawood, M., 2017. Spatio-statistical analysis of temperature fluctuation using Mann-Kendall and Sen’s slope approach. Clim. Dyn. 48(3), 783-797.

[11]
Baffour-Ata F., Antwi-Agyei P., Nkiaka E., et al., 2021. Effect of climate variability on yields of selected staple food crops in northern Ghana. J. Agric. Food Res. 6, 100205, doi: 10.1016/j.jafr.2021.100205.

[12]
Baffour-Ata F., Antwi-Agyei P., Nkiaka E., et al., 2022. Climate information services available to farming households in Northern Region, Ghana. Weather Clim. Soc. 14(2), 467-480.

[13]
Baffour-Ata F., Awugyi M., Ofori N.S., et al., 2023a. Determinants of yam farmers’ adaptation practices to climate variability in the Ejura Sekyedumase municipality, Ghana. Heliyon. 9(3), e14090, doi: 10.1016/j.heliyon.2023.e14090.

[14]
Baffour-Ata F., Tabi J.S., Sangber-Dery A., et al., 2023b. Effect of rainfall and temperature variability on maize yield in the Asante Akim North District, Ghana. Curr. Res. Environmental Sustainability. 5, 100222, doi: 10.1016/j.crsust.2023.100222.

[15]
Boillat S., Jew E.K., Steward P.R., et al., 2019. Can smallholder farmers buffer rainfall variability through conservation agriculture? On-farm practices and maize yields in Kenya and Malawi. Environ. Res. Lett. 14(11), 115007, doi: 10.1088/1748-9326/ab45ad.

[16]
Bolang P.D., Osumanu I.K., 2019. Formal sector workers’ participation in urban agriculture in Ghana: Perspectives from the Wa Municipality. Heliyon. 5(8), e02230, doi: 10.1016/j.heliyon.2019.e02230.

[17]
Danso-Abbeam G., Ehiakpor D.S., Aidoo R., 2018. Agricultural extension and its effects on farm productivity and income: Insight from Northern Ghana. Agriculture & Food Security. 7(1), 1-10.

[18]
Derbile E.K., Chirawurah D., Naab F.X., 2022. Vulnerability of smallholder agriculture to environmental change in North-Western Ghana and implications for development planning. Clim. Dev. 14(1), 39-51.

[19]
Eggenberger P., Bürgisser M., Rossi R.M., et al., 2021. Body temperature is associated with cognitive performance in older adults with and without mild cognitive impairment: A cross-sectional analysis. Front. Aging Neurosci. 13, 585904, doi: 10.3389/fnagi.2021.585904.

[20]
Fan S., Rue C., 2020. The role of smallholder farms in a changing world. In: PalomaS.G., RiesgoL., LouhichiK., (eds.). The Role of Smallholder Farms in Food and Nutrition Security. Cham: Springer, 13-28.

[21]
FAO (Food and Agriculture Organization of the United Nations), 2016. Hankbook on Agricultural Cost of Production Statistics: Guidelines for Data Collection, Compilation and Dissemination. [2023-03-09]. https://pdf4pro.com/view/handbook-on-agricultural-cost-of-production-statistics-6039a6.html.

[22]
FAO, 2020. Supporting Climate Adaptation in Smallholder Agriculture. Rome: FAO, 1-8.

[23]
FAO, 2023. Ghana at a Glance. [2023-03-11]. https://www.fao.org/ghana/fao-in-ghana/ghana-at-a-glance/en/.

[24]
Forthofer R.N., Lehnen R.G., 1981. Rank correlation methods. In: Forthofer, R.N., Lehnen, R.G., (eds.). Public Program Analysis. Boston: Springer, 146-163.

[25]
Fosu-Mensah B.Y., Vlek P.L.G, MacCarthy D.S., 2012. Farmers’ perception and adaptation to climate change: A case study of Sekyedumase district in Ghana. Environ. Dev. Sustain. 14(4), 495-505.

[26]
Frost C., Jayaram K., Paris G., 2023. What Climate-Smart Agriculture Means for Smallholder Farmers? [2023-02-12]. https://www.mckinsey.com/industries/agriculture/our-insights/what-climate-smart-agriculture-means-for-smallholder-farmers.

[27]
GSS Ghana Statistical Service, 2024. Multidimensional Poverty Report. [2024-08-21]. https://statsghana.gov.gh/.

[28]
Guodaar L., Bardsley D.K., Suh J., 2021. Integrating local perceptions with scientific evidence to understand climate change variability in northern Ghana: A mixed-methods approach. Appl. Geogr. 130, 102440, doi: 10.1016/j.apgeog.2021.102440.

[29]
Habtemariam L.T., Gandorfer M., Kassa G.A., et al., 2016. Factors influencing smallholder farmers’ climate change perceptions: A study from farmers in Ethiopia. Environ. Manage. 58(2), 343-358.

[30]
Harvey C.A., Saborio-Rodríguez M., Martinez-Rodríguez M.R., et al., 2018. Climate change impacts and adaptation among smallholder farmers in Central America. Agriculture & Food Security. 7(1), 1-20.

[31]
Huda M.N., 2013. Understanding indigenous people’s perception on climate change and climatic hazards: A case study of Chakma indigenous communities in Rangamati Sadar Upazila of Rangamati District, Bangladesh. Nat. Hazards. 65(3), 2147-2159.

[32]
IPCC Intergovernmental Panel on Climate Change, 2007. Climate Change 2007: Impacts, Adaptation and Vulnerability. Cambridge: Cambridge University Press, 1-987.

[33]
Kaur G., Kaur S., 2017. Precipitation: Changing patterns, crop effects and mitigation: A brief review. International Journal of Research in Geography. 3(1), 26-32.

[34]
King N., Brooks J., 2018. Thematic analysis in organizational research. In: Cassell, C., Cunliffe, A.L., Grandy, G., (eds.). The SAGE Handbook of Qualitative Business and Management Research Methods: Methods and Challenges. New York: Sage, 219-236.

[35]
Langyintuo A., 2020. Smallholder farmers’ access to inputs and finance in Africa. In: Paloma, G.S., Riesgo, L., Louhichi, K., (eds.). The Role of Smallholder Farms in Food and Nutrition Security. Cham: Springer, 133-152.

[36]
Lobell D.B., Schlenker W., Costa-Roberts J., 2011. Climate trends and global crop production since 1980. Science. 333(6042), 616-620.

DOI PMID

[37]
Lokesha M.N., Mahesha M., 2016. Impact of road infrastructure on agricultural development and rural road infrastructure development programmes in India. International Journal of Humanities and Social Science Invention. 5(11), 1-7.

[38]
Maake M.M.S., Antwi M.A., 2022. Farmer’s perceptions of effectiveness of public agricultural extension services in South Africa: An exploratory analysis of associated factors. Agriculture & Food Security. 11(1), 34, doi: 10.1186/s40066-022-00372-7.

[39]
MoFA Ministry of Food and Agriculture, 2024. Ahafo Ano North. [2023-02-12]. https://mofa.gov.gh/site/directorates/district-directorates/ashanti-region/144-ahafo-ano-north.

[40]
Morton J.F., 2007. The impact of climate change on smallholder and subsistence agriculture. Proc. Natl. Acad. Sci. U. S. A. 104(50), 19680-19685.

[41]
Mujeyi A., Mudhara M., Mutenje M., 2021. The impact of climate smart agriculture on household welfare in smallholder integrated crop-livestock farming systems: Evidence from Zimbabwe. Agriculture & Food Security. 10(1), 1-15.

[42]
Myers S., 2022. Analyzing Farm Inputs: The Cost to Farm Keeps Rising. [2023-01-09]. https://www.fb.org/market-intel/analyzing-farm-inputs-the-cost-to-farm-keeps-rising.

[43]
Nyantakyi-Frimpong H., Bezner-Kerr R., 2015. The relative importance of climate change in the context of multiple stressors in semi-arid Ghana. Glob. Environ. Change-Human Policy Dimens. 32, 40-56.

[44]
OECD/FAO Organization for Economic Co-operation and Development/Food and Agriculture Organization of the United Nations, 2016. Agriculture in Sub-Saharan Africa:Prospects and Challenges for the Next Decade. Paris: OECD Publishing, 1-138.

[45]
Oxford Business Group, 2022. Agriculture. [2023-01-11]. https://oxfordbusinessgroup.com/reports/ghana/2022-report/agriculture.

[46]
Oyekale A.S., 2021. Climate change adaptation and cocoa farm rehabilitation behaviour in Ahafo Ano North District of Ashanti region, Ghana. Open Agric. 6(1), 263-275.

[47]
Piya L., Maharjan K.L., Joshi N.P., et al., 2019. Climate change:Perceptions and the determinants. In: PiyaL., MaharjanK.L., JoshiN.P., (eds.). Socio-Economic Issues of Climate Change:A Livelihood Analysis from Nepal. Singapore: Springer, 107-132.

[48]
Rojas Corradi M., Lambert F., Ramirez-Villegas J., et al., 2019. Climate Change Affects Rainfall Patterns in Crop-Producing Regions: Findings from the Study “Emergence of Robust Precipitation Changes Across Crop Production Areas in the 21st Century”. Wageningen: CGIAR Research Program on Climate Change, Agriculture and Food Security (CCAFS).

[49]
Sakho-Jimbira S., Hathie I., 2020. The Future of Agriculture in Sub-Saharan Africa. [2023-01-11]. https://www.ifad.org/documents/38714170/42030191/future_agriculture_sahara_e.pdf/1cb6b896-b9c1-0bb8-87b8-83df3153d0af.

[50]
Savsani H.H., Padodara R.J., Bhadaniya A.R., et al., 2015. Impact of climate on feeding, production and reproduction of animals-A Review. Agricultural Reviews. 36(1), 26-36.

[51]
Sieber N., Allen H., 2016. Impacts of rural roads on poverty and equity. Transport and Communications Bulletin for Asia and the Pacific. 86, 23-40.

[52]
Steyn W., 2016. The Effects of Poor Rural Road Conditions on Produce: By Invitation. [2023-03-09]. https://hdl.handle.net/10520/EJC189508.

[53]
Stocking M., 2014. Soil erosion and land degradation. Envion. Sci. Environ. Manag. 287-321.

[54]
Szabo S., Apipoonyanon C., Pramanik M., et al., 2021. Agricultural productivity, aging farming workforce, sustainable agriculture, and well-being: Household survey data from Central Thailand. Front. Sustain. Food Syst. 5, 728120, doi: 10.3389/fsufs.2021.728120.

[55]
Tenaw S., Islam K.Z., Parviainen T., 2009. Effects of Land Tenure and Property Rights on Agricultural Productivity in Ethiopia, Namibia and Bangladesh. Helsinki: University of Helsinki, 1-33.

[56]
Thornton P.K., Ericksen P.J., Herrero M., et al., 2014. Climate variability and vulnerability to climate change: A review. Glob. Change Biol. 20(11), 3313-3328.

[57]
Wang F., Shao W., Yu H.J., et al., 2020. Re-evaluation of the power of the mann-kendall test for detecting monotonic trends in hydrometeorological time series. Front. Earth Sci. 8, 14, doi: 10.3389/feart.2020.00014.

[58]
Woetzel J., Pinner D., Samandari H., et al., 2020. How Will African Farmers Adjust to Changing Patterns of Precipitation? [2023-01-12]. https://www.mckinsey.com/-/media/McKinsey/Business%20Functions/Sustainability/Our%20Insights/How%20will%20African%20farmers%20adjust%20to%20changing%20patterns%20of%20precipitation/MGI-How-will-African-farmers-adjust-to-changing-patterns-of-precipitation.pdf.

[59]
World Business Council for Sustainable Development, 2023. Impact of COVID-19 on Smallholder Farmers-Insights from India. [2023-01-12]. https://www.wbcsd.org/news/impact-covid-19-smallholder-farmers-insights-india/.

[60]
World Economic Forum, 2022. Why Smallholder Farmers Are Central to New Food Security Interventions. [2023-03-19]. https://www.weforum.org/agenda/2022/09/smallholder-farmers-key-achieving-food-security/.

[61]
Yamane T., 1973. Statistics:An Introductory Analysis. London: John Weather Hill Incorporated, 1-8.

Outlines

/