
Assessing the impact of climate change on agricultural production in central Afghanistan
Received date: 2023-11-08
Revised date: 2024-05-01
Accepted date: 2024-08-19
Online published: 2025-08-14
Afghanistan has faced extreme climatic crises such as drought, rising temperature, and scarce precipitation, and these crises will likely worsen in the future. Reduction in crop yield can affect food security in Afghanistan, where the majority of population and economy are completely dependent on agriculture. This study assessed the interaction between climate change and crop yield in Kabul of Afghanistan during the reference (1990-2020) and future (2025-2100) periods. Climate data (1990-2020) were collected from four meteorological stations and three local organizations, and wheat yield data (1990-2020) were acquired from the United States Agriculture Department. Data during the reference period (1990-2020) were used for the validation and calibration of the statistical downscaling models such as the Statistical Downscaling Model (SDSM) and Long Ashton Research Station Weather Generator (LARS-WG). Furthermore, the auto-regression model was used for trend analysis. The results showed that an increase in the average annual temperature of 2.15°C, 2.89°C, and 4.13°C will lead to a reduction in the wheat yield of 9.14%, 10.20%, and 12.00% under Representative Concentration Pathway (RCP)2.6, RCP4.5, and RCP8.5 during the future period (2025-2100), respectively. Moreover, an increase in the annual maximum temperature of 1.79°C, 2.48°C, and 3.74°C also causes a significant reduction in the wheat yield of 2.60%, 3.60%, and 10.50% under RCP2.6, RCP4.5, and RCP8.5, respectively. Furthermore, an increase in the annual minimum temperature of 2.98°C, 2.23°C, and 4.30°C can result in an increase in the wheat yield of 6.50%, 4.80%, and 9.30% under RCP2.6, RCP4.5, and RCP8.5, respectively. According to the SDSM, the decrease of the average monthly precipitation of 4.34%, 4.10%, and 5.13% results in a decrease in the wheat yield of 2.60%, 2.36%, and 3.18% under RCP2.6, RCP4.5, and RCP8.5, respectively. This study suggests that adaptation strategies can be applied to minimize the consequences of climate change on agricultural production.
Key words: Climate change; Wheat yield; Food security; Representative; Concentration; Pathway (RCP); Afghanistan
Homayoon RAOUFI , Hamidreza JAFARI , Wakil Ahmad SARHADI , Esmail SALEHI . Assessing the impact of climate change on agricultural production in central Afghanistan[J]. Regional Sustainability, 2024 , 5(3) : 100156 . DOI: 10.1016/j.regsus.2024.100156
Table 1 Geographical and climatic characteristics of four Meteorological stations in the study area. |
| Station name | Latitude | Longitude | Average elevation (m a.s.l.) | Average precipitation (mm/a) | Average temperature (°C/a) |
|---|---|---|---|---|---|
| Karizmir | 34°38′20′′N | 69°03′70′′E′′ | 1905 | 392.00 | 12.90 |
| Kabul-airport | 34°33′39′′N | 69°12′38′′E | 1791 | 197.00 | 14.10 |
| Qargha | 34°33′10′′N | 69°01′55′′E | 1970 | 360.38 | 12.60 |
| Shakardara | 34°40′51′′N | 69°01′00′′E | 2168 | 411.38 | 10.16 |
Table 2 Monthly minimum and maximum temperatures, and monthly precipitation during the reference (1990-2020) and future (2025-2100) periods. |
| Month | Reference period (1990-2020) | Future period (2025-2100) | ||||||||||
|---|---|---|---|---|---|---|---|---|---|---|---|---|
| RCP2.6 | RCP4.5 | RCP8.5 | ||||||||||
| Tmin (°C) | Tmax (°C) | P (mm) | Tmin (°C) | Tmax (°C) | P (mm) | Tmin (°C) | Tmax (°C) | P (mm) | Tmin (°C) | Tmax (°C) | P (mm) | |
| January | -0.20 | 10.20 | 28.20 | 2.40 | 12.30 | 28.70 | 3.40 | 13.30 | 35.10 | 4.90 | 14.30 | 42.70 |
| February | 1.20 | 12.10 | 52.20 | 4.80 | 14.90 | 35.20 | 6.10 | 16.10 | 35.80 | 7.50 | 17.00 | 39.80 |
| March | 5.60 | 17.30 | 57.70 | 9.50 | 20.00 | 37.60 | 10.40 | 20.70 | 45.80 | 11.90 | 22.10 | 51.90 |
| April | 8.20 | 20.90 | 46.60 | 12.20 | 24.60 | 41.80 | 12.80 | 25.50 | 30.60 | 14.30 | 27.00 | 46.90 |
| May | 11.50 | 25.10 | 23.70 | 14.60 | 28.10 | 20.80 | 15.00 | 28.90 | 24.30 | 16.30 | 30.20 | 30.30 |
| June | 14.60 | 29.40 | 3.20 | 16.90 | 32.10 | 3.90 | 17.40 | 32.90 | 3.50 | 18.60 | 34.00 | 6.90 |
| July | 16.70 | 32.10 | 3.40 | 18.50 | 33.30 | 1.90 | 19.30 | 33.90 | 2.00 | 20.40 | 35.10 | 3.20 |
| August | 16.10 | 31.50 | 6.00 | 17.40 | 32.80 | 3.50 | 18.40 | 33.20 | 5.50 | 19.70 | 34.50 | 3.70 |
| September | 13.20 | 27.80 | 3.90 | 14.30 | 28.40 | 28.00 | 15.20 | 28.90 | 23.00 | 16.70 | 30.60 | 21.00 |
| October | 9.20 | 22.30 | 7.40 | 10.90 | 22.90 | 25.20 | 11.80 | 23.50 | 23.20 | 13.30 | 25.10 | 28.30 |
| November | 4.90 | 16.00 | 21.20 | 6.60 | 16.80 | 19.90 | 7.40 | 17.50 | 19.80 | 9.00 | 18.80 | 20.00 |
| December | 2.00 | 12.10 | 15.30 | 3.70 | 13.30 | 36.30 | 4.40 | 14.20 | 33.60 | 5.90 | 15.20 | 38.20 |
| Average | 8.60 | 21.40 | 269.00 | 11.00 | 23.30 | 282.70 | 11.80 | 24.00 | 282.10 | 13.20 | 25.30 | 332.90 |
Note: Tmin, minimum temperature; Tmax, maximum temperature; P, precipitation; RCP, Representative Concentration Pathway. |
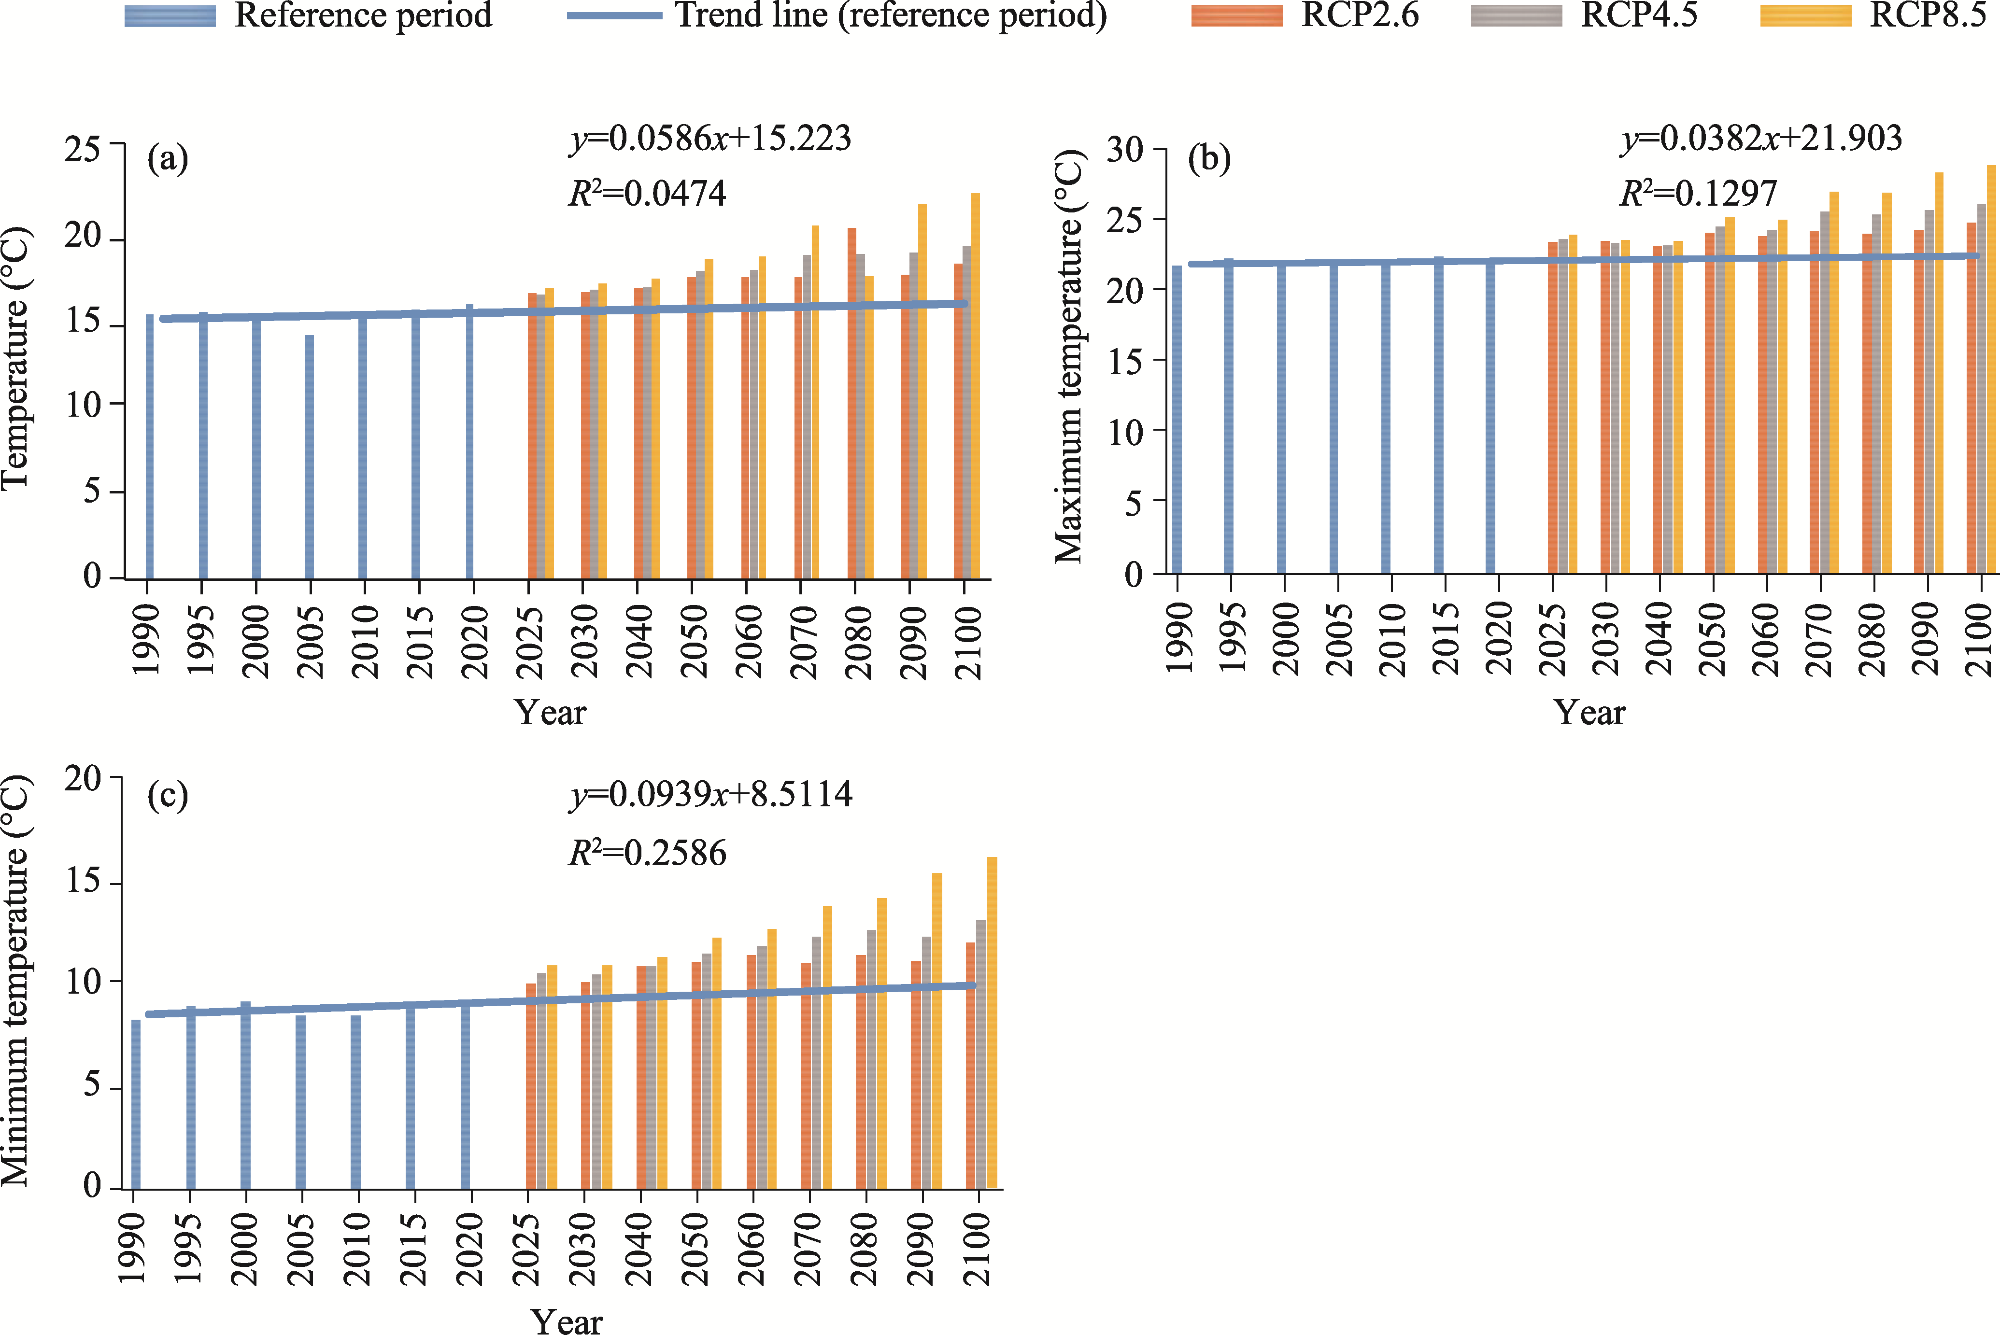
Fig. 1. Average annual temperature (a), annual maximum temperature (b), and annual minimum temperature (c) during the reference (1990-2020) and future (2025-2100) periods under RCP2.6, RCP4.5, and RCP8.5. RCP, Representative Concentration Pathway. |
Table 3 Impact of the average annual temperature change on wheat yield under three scenarios. |
| Year | RCP2.6 | RCP4.5 | RCP8.5 | |||
|---|---|---|---|---|---|---|
| Average annual temperature change (°C) | Wheat yield change (%) | Average annual temperature change (°C) | Wheat yield change (%) | Average annual temperature change (°C) | Wheat yield change (%) | |
| 2025 | 1.23 | -7.80 | 1.59 | -8.30 | 1.95 | -8.80 |
| 2030 | 1.18 | -7.73 | 1.32 | -7.90 | 1.68 | -8.50 |
| 2040 | 1.44 | -8.11 | 1.49 | -8.20 | 1.85 | -8.70 |
| 2050 | 2.41 | -9.51 | 2.78 | -10.00 | 3.53 | -11.10 |
| 2060 | 2.40 | -9.50 | 2.82 | -10.10 | 3.59 | -11.20 |
| 2070 | 1.88 | -8.74 | 3.19 | -10.60 | 4.66 | -12.80 |
| 2080 | 2.54 | -9.70 | 3.82 | -11.60 | 5.37 | -13.80 |
| 2090 | 3.10 | -10.51 | 4.45 | -12.50 | 7.24 | -16.50 |
| 2100 | 3.18 | -10.63 | 4.54 | -12.60 | 7.31 | -16.60 |
| Average | 2.15 | -9.14 | 2.89 | -10.20 | 4.13 | -12.00 |
Table 4 Impact of the annual maximum temperature change on wheat yield under three scenarios. |
| Year | RCP2.6 | RCP4.5 | RCP8.5 | |||
|---|---|---|---|---|---|---|
| Annual maximum temperature change (°C ) | Wheat yield change (%) | Annual maximum temperature change (°C ) | Wheat yield change (%) | Annual maximum temperature change (°C) | Wheat yield change (%) | |
| 2025 | 0.93 | -1.35 | 1.09 | -1.58 | 2.19 | -3.18 |
| 2030 | 1.22 | -1.77 | 1.08 | -1.57 | 1.34 | -1.94 |
| 2040 | 1.19 | -1.73 | 1.26 | -1.83 | 1.54 | -2.23 |
| 2050 | 2.18 | -3.16 | 2.55 | -3.70 | 3.25 | -4.72 |
| 2060 | 1.81 | -2.63 | 2.23 | -3.24 | 2.94 | -4.27 |
| 2070 | 2.23 | -3.24 | 3.59 | -5.21 | 4.99 | -7.24 |
| 2080 | 1.60 | -2.32 | 2.95 | -4.28 | 4.46 | -6.47 |
| 2090 | 2.11 | -3.06 | 3.42 | -4.96 | 6.17 | -8.95 |
| 2100 | 2.90 | -4.21 | 4.22 | -6.12 | 6.93 | -10.05 |
| Average | 1.79 | -2.60 | 2.48 | -3.60 | 3.74 | -5.45 |
Table 5 Impact of the annual minimum temperature change on wheat yield under three scenarios. |
| Year | RCP2.6 | RCP4.5 | RCP8.5 | |||
|---|---|---|---|---|---|---|
| Annual minimum temperature change (°C) | Wheat yield change (%) | Annual minimum temperature change (°C) | Wheat yield change (%) | Annual minimum temperature change (°C) | Wheat yield change (%) | |
| 2025 | 1.14 | 2.50 | 0.90 | 2.00 | 1.72 | 3.70 |
| 2030 | 1.56 | 3.40 | 1.14 | 2.50 | 2.01 | 4.40 |
| 2040 | 1.72 | 3.70 | 1.69 | 3.70 | 2.16 | 4.70 |
| 2050 | 3.01 | 6.50 | 2.64 | 5.70 | 3.81 | 8.30 |
| 2060 | 3.41 | 7.40 | 2.99 | 6.50 | 4.23 | 9.20 |
| 2070 | 3.20 | 6.90 | 1.94 | 4.20 | 4.76 | 10.30 |
| 2080 | 4.06 | 8.80 | 2.84 | 6.20 | 5.65 | 12.30 |
| 2090 | 4.12 | 8.90 | 2.74 | 5.90 | 6.96 | 15.10 |
| 2100 | 4.62 | 10.00 | 3.22 | 7.00 | 7.45 | 16.20 |
| Average | 2.98 | 6.50 | 2.23 | 4.80 | 4.30 | 9.30 |
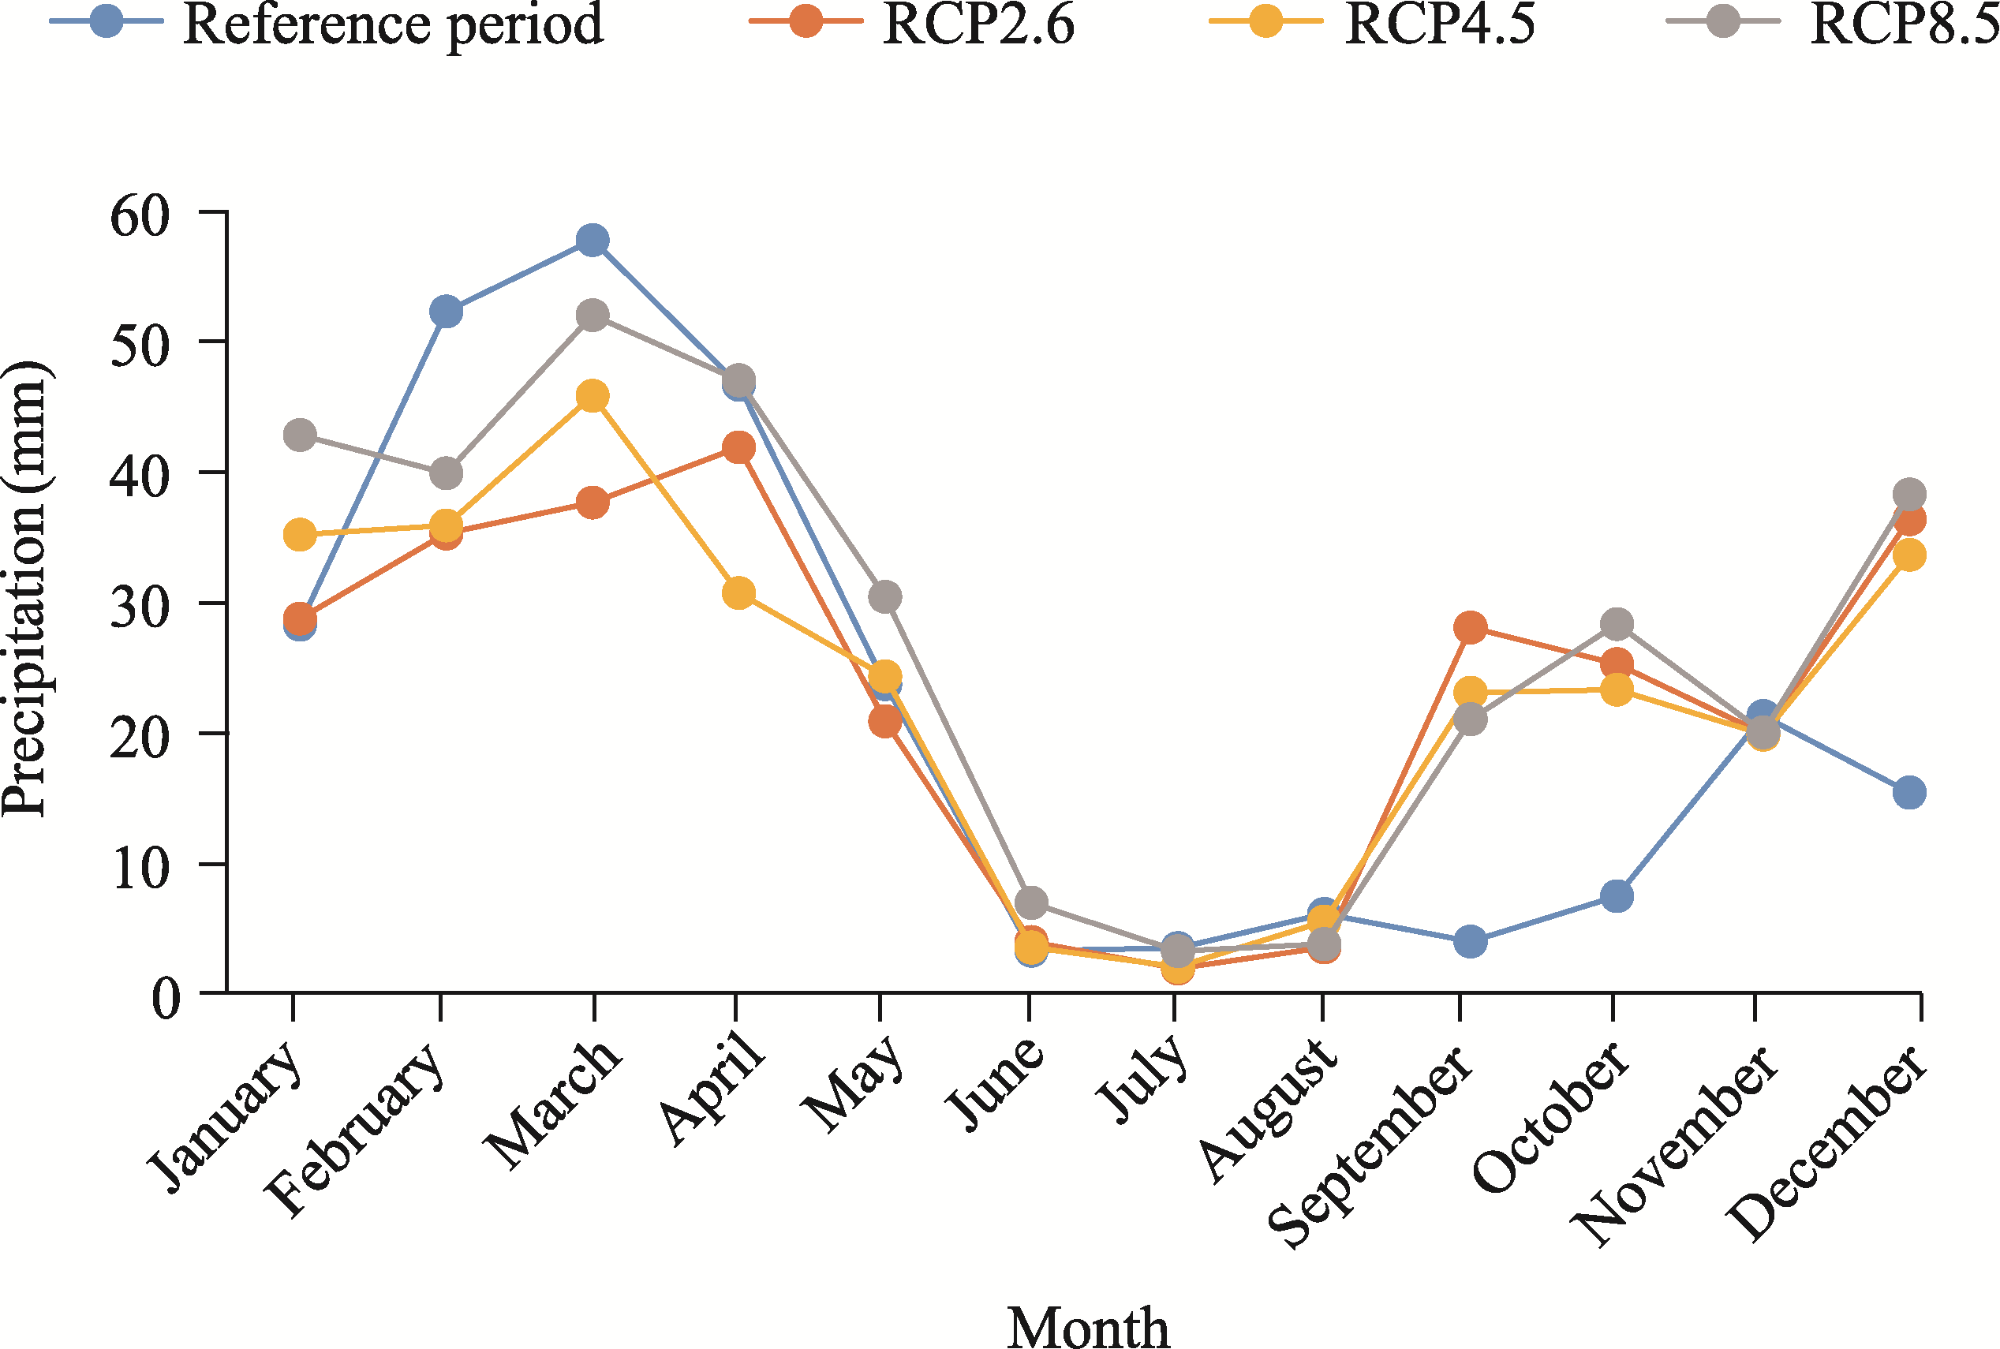
Fig. 2. Average monthly precipitation during the reference (1990-2020) and future (2025-2100) periods under RCP2.6, RCP4.5, and RCP8.5. |
Table 6 Impact of the average monthly precipitation change on wheat yield under three scenarios. |
| Variable change | LARS-WG model | SDSM | ||||
|---|---|---|---|---|---|---|
| RCP2.6 | RCP4.5 | RCP8.5 | RCP2.6 | RCP4.5 | RCP8.5 | |
| Average monthly precipitation change (%) | -5.14 | -6.13 | -4.88 | -4.34 | -4.10 | -5.13 |
| Wheat yield change (%) | -3.12 | -3.78 | -2.92 | -2.60 | -2.36 | -3.18 |
Note: LARS-WG model, Long Ashton Research Station Weather Generator model; SDSM, Statistical Downscaling Model. |
| [1] |
|
| [2] |
|
| [3] |
|
| [4] |
|
| [5] |
Afghanistan Meteorological Department, 2022. Daily Climatic Data. [2023-05-02]. http://www.amd.gov.af/.
|
| [6] |
|
| [7] |
|
| [8] |
|
| [9] |
|
| [10] |
|
| [11] |
|
| [12] |
|
| [13] |
FAO Food and Agriculture Organization of the United Nations, 2016. Climate Change in Afghanistan. What Does It Mean for Rural Livelihoods and Food Security? [2024-04-29]. https://www.unep.org/resources/report/climate-change-afghanistan-what-does-it-mean-rural-livelihoods-and-food-security.
|
| [14] |
FAO, 2019. Afghanistan Droughts and Risk Management Strategies. [2023-04-29]. https://www.fao.org/policy-support/tools-and-publications/resources-details/en/c/1366257/.
|
| [15] |
|
| [16] |
|
| [17] |
|
| [18] |
|
| [19] |
|
| [20] |
|
| [21] |
|
| [22] |
|
| [23] |
|
| [24] |
ICMPD International Centre for Migration Policy Development, 2023. Migration Outlook Mediterranean. [2023-05-02]. https://www.icmpd.org/file/download/59113/file/ICMPD%2520Migration%2520Outlook%2520Mediterranean%25202023.pdf.
|
| [25] |
IPCC Intergovernmental Panel on Climate Change, 2014. Climate Change 2014:Synthesis Report. [2023-05-02]. https://www.ipcc.ch/report/ar5/syr/.
|
| [26] |
|
| [27] |
|
| [28] |
|
| [29] |
|
| [30] |
|
| [31] |
|
| [32] |
|
| [33] |
Ministry of Agriculture, Irrigation and Livestock, 2022. Daily Climatic Data. [2023-07-02]. https://mail.gov.af.
|
| [34] |
Ministry of Energy and Water, 2022. Daily Climatic Data. [2023-07-02]. https://mew.gov.af.
|
| [35] |
|
| [36] |
|
| [37] |
|
| [38] |
|
| [39] |
NEPA National Environmental Protection Agency, 2018. Second National Communication under UNFCCC, Kabul, Afghanistan. [2023-05-10]. https://www.nepa.gov.af/service3.
|
| [40] |
|
| [41] |
|
| [42] |
|
| [43] |
|
| [44] |
|
| [45] |
|
| [46] |
|
| [47] |
|
| [48] |
|
| [49] |
|
| [50] |
|
| [51] |
|
| [52] |
|
| [53] |
|
| [54] |
UNDP United Nations Development Programm, 2019. Climate Change Scenarios for Agriculture of Afghanistan. [2023-05-02]. https://www.undp.org/afghanistan/publications/climate-change-scenarios-agriculture-afghanistan.
|
| [55] |
United States Department of Agriculture, 2023. Foreign Agricultural Service: Country Summary, Afghanistan. [2023-05-02]. https://ipad.fas.usda.gov/countrysummary/default.aspx?id=AF.
|
| [56] |
|
| [57] |
|
| [58] |
|
| [59] |
|
| [60] |
|
| [61] |
|
| [62] |
|
| [63] |
|
/
| 〈 |
|
〉 |