Full Length Article

Quantifying the impacts of land use/land cover changes on ecosystem service values in the upper Gilgel Abbay watershed, Ethiopia

  • Wassie Abuhay ASCHENEFE , a, * ,
  • Temesgen Gashaw TAREKEGN b, c ,
  • Betelhem Fetene ADMAS a ,
  • Solomon Mulu TAFERE d
Expand
  • aDepartment of Natural Resource Management, College of Agriculture and Environmental Science, University of Gondar, Gondar, 196, Ethiopia
  • bCollege of Agriculture, Food and Natural Resources, Prairie View A&M University, Prairie View, TX 77446, the United States
  • cDepartment of Natural Resource Management, College of Agriculture and Environmental Science, Bahir Dar University, Bahir Dar, 555, Ethiopia
  • dDepartment of Forestry, College of Agriculture and Environmental Science, Wollo University, Dessie, 1145, Ethiopia
* E-mail address: (Wassie Abuhay ASCHENEFE).

Received date: 2024-04-24

  Accepted date: 2025-02-21

  Online published: 2025-08-13

Copyright

This is an open access article under the CC BY-NC-ND license (http://creativecommons.org/licenses/by-nc-nd/4.0/).

Abstract

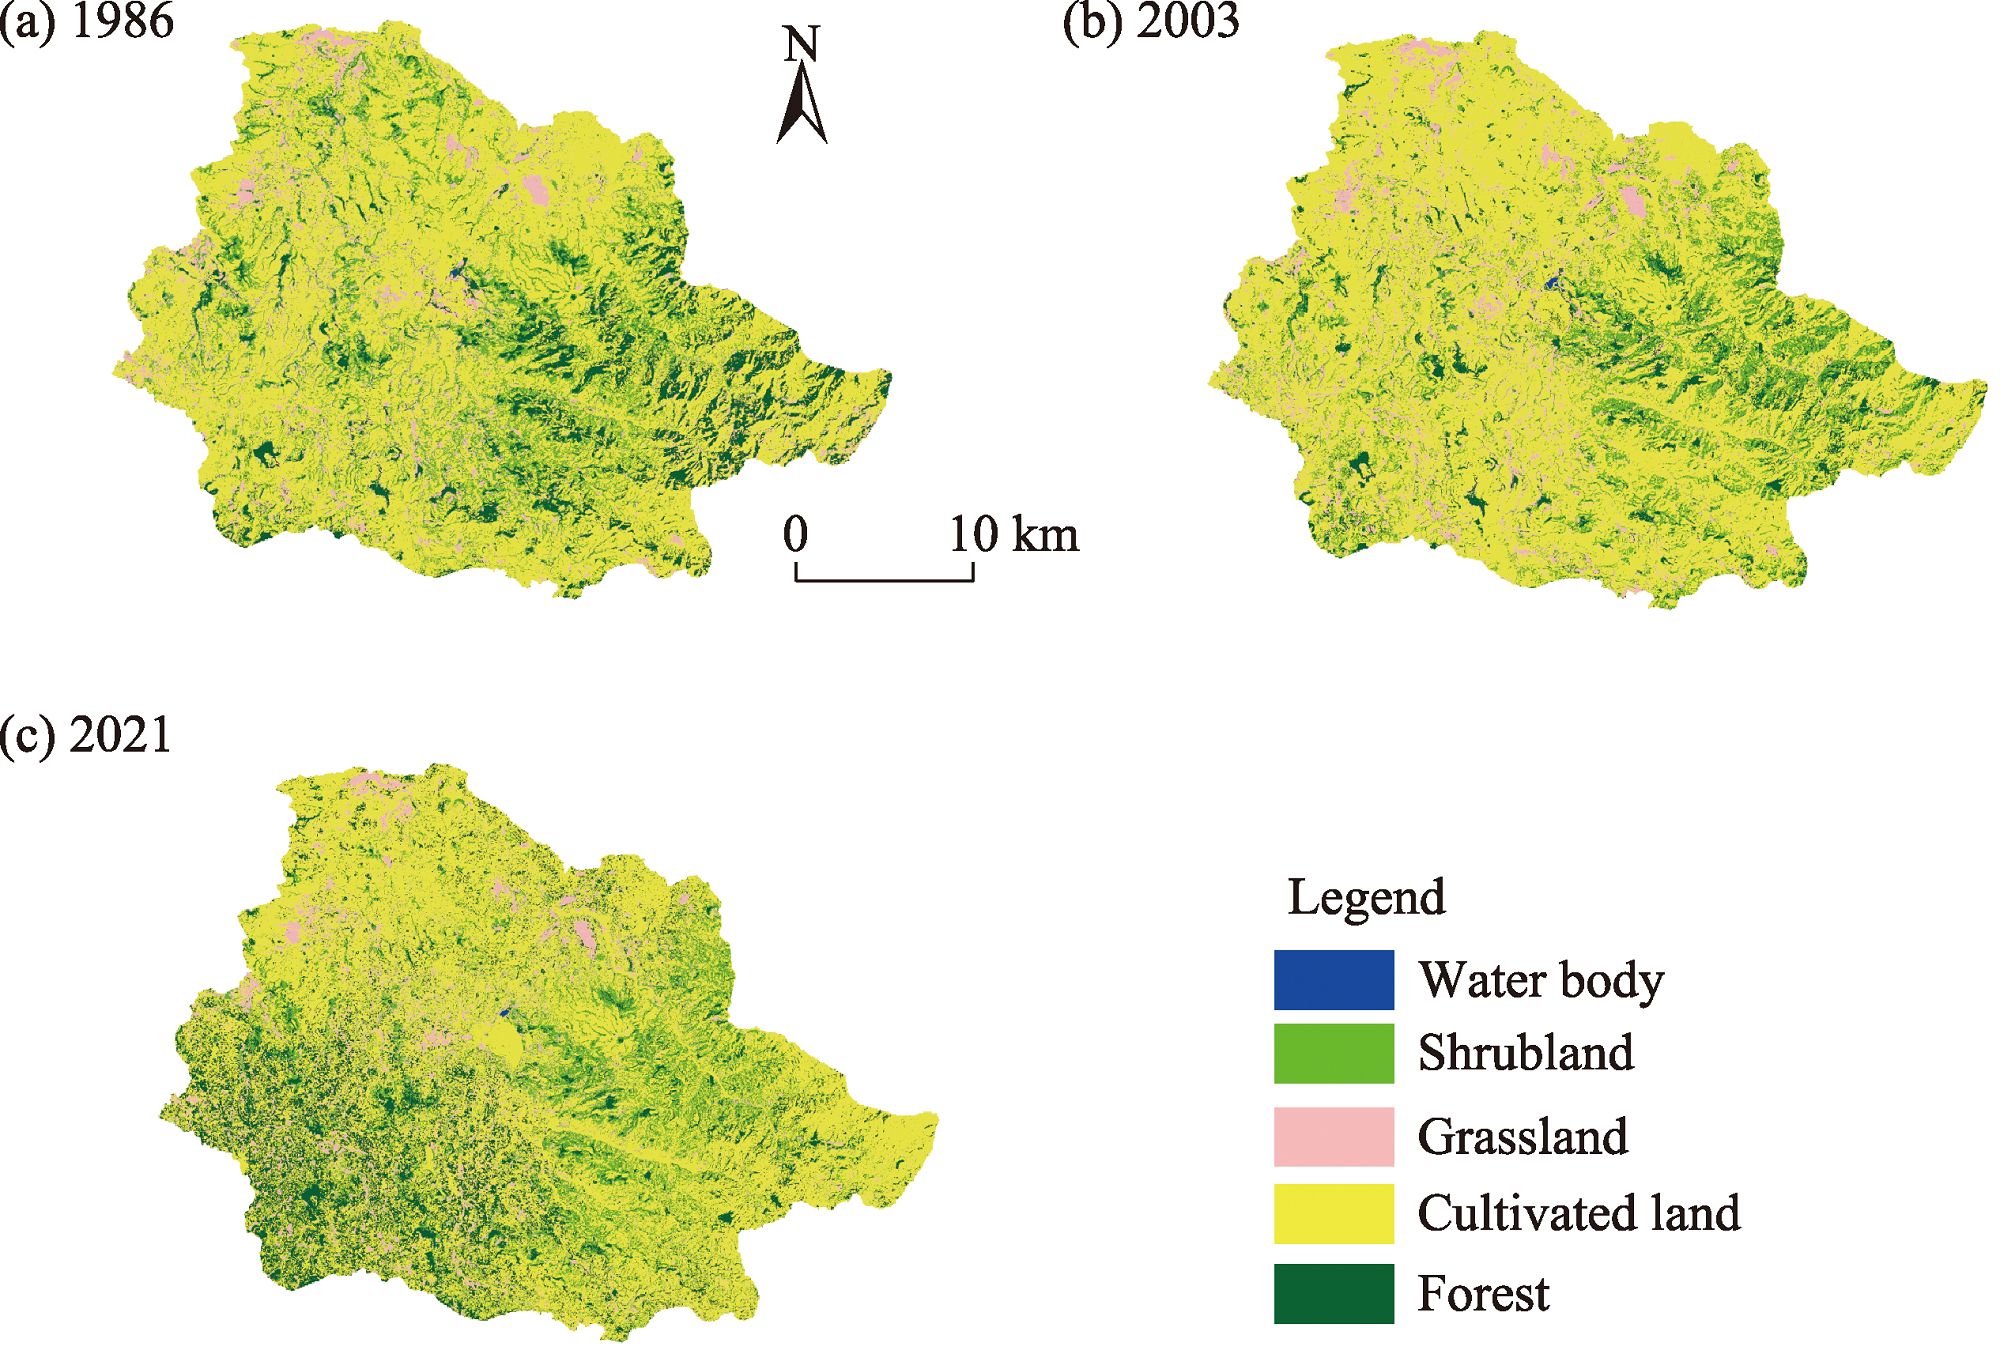
Human well-being and livelihoods depend on natural ecosystem services (ESs). Following the increment of population, ESs have been deteriorated over time. Ultimately, land use/land cover (LULC) changes have a profound impact on the change of ecosystem. The primary goal of this study is to determine the impacts of LULC changes on ecosystem service values (ESVs) in the upper Gilgel Abbay watershed, Ethiopia. Changes in LULC types were studied using three Landsat images representing 1986, 2003, and 2021. The Landsat images were classified using a supervised image classification technique in Earth Resources Data Analysis System (ERDAS) Imagine 2014. We classified ESs in this study into four categories (including provisioning, regulating, supporting, and cultural services) based on global ES classification scheme. The adjusted ESV coefficient benefit approach was employed to measure the impacts of LULC changes on ESVs. Five LULC types were identified in this study, including cultivated land, forest, shrubland, grassland, and water body. The result revealed that the area of cultivated land accounted for 64.50%, 71.50%, and 61.50% of the total area in 1986, 2003, and 2021, respectively. The percentage of the total area covered by forest was 9.50%, 5.90%, and 14.80% in 1986, 2003, and 2021, respectively. Result revealed that the total ESV decreased from 7.42×10⁷ to 6.44×10⁷ USD between 1986 and 2003. This is due to the expansion of cultivated land at the expense of forest and shrubland. However, the total ESV increased from 6.44×10⁷ to 7.76×10⁷ USD during 2003-2021, because of the increment of forest and shrubland. The expansion of cultivated land and the reductions of forest and shrubland reduced most individual ESs during 1986-2003. Nevertheless, the increase in forest and shrubland at the expense of cultivated land enhanced many ESs during 2003-2021. Therefore, the findings suggest that appropriate land use practices should be scaled-up to sustainably maintain ESs.

Cite this article

Wassie Abuhay ASCHENEFE , Temesgen Gashaw TAREKEGN , Betelhem Fetene ADMAS , Solomon Mulu TAFERE . Quantifying the impacts of land use/land cover changes on ecosystem service values in the upper Gilgel Abbay watershed, Ethiopia[J]. Regional Sustainability, 2025 , 6(1) : 100197 . DOI: 10.1016/j.regsus.2025.100197

1. Introduction

The benefits that people receive from natural processes that improve human well-being are known as ecosystem services (ESs) (Li et al., 2020; Gu et al., 2021). ESs can be broadly classified as provisioning, regulating, supporting, and cultural services (MEA, 2005). The amount of ES supply is affected by the type of land use, as changes in land use directly impact the expected ecosystem outputs (De Groot et al., 2002; Styers et al., 2010; Duguma and Hager, 2011). The benefits depend on the type of land use management and its status. In the Ethiopian context, deforestation and degradation of forests have led to a reduction in the availability of ESs (Duguma and Hager, 2011). To enhance decision-making regarding the distribution of limited resources among conflicting goals, it is essential to quantify and evaluate changes in ecosystem service values (ESVs) (Cademus et al., 2014; Kindu et al., 2016). The types of land use/land cover (LULC) currently used are closely tied to the supply of ESs. The kind and quantity of ESs supplied in any location are significantly impacted by LULC changes (De Groot et al., 2002). The monetary value of ESs intuitively illustrates the benefits derived by people. This information can be utilized to emphasize the significance of ecosystems, assist in the development of relevant policies, and encourage the successful conservation and management of ecosystems (Fu et al., 2015; Jiang et al., 2020). Numerous benefits to individual utilities and economic development are provided by ESs. These benefits may reveal the current state of interactions between humans and nature (Rincón-Ruiz et al., 2019; Deeksha and Shukla, 2022). Industries, economies, and local populations continue to undervalue the benefits of ESs (Vo et al., 2012).
After the concept of ESs was proposed, scientists and scholars used the concept to understand and solve the problem of harmful effects on natural resources (Mengist et al., 2022). ES is a framework that integrates interactions between ecosystems and people, and the term is widely applied in modern scientific research and policy agendas (Fagerholm et al., 2016; Mengist et al., 2022). However, throughout the past few centuries, a variety of driving factors primarily related to anthropogenic activities worldwide have altered global ESs (D’Annunzio et al., 2015; Waters et al., 2016; Kusi et al., 2020; Randin et al., 2020).
Globally, LULC changes have been brought about by urbanization, economic growth, and population increase; as a result, ecosystems around the world have been affected (Mengist et al., 2022). One of the pressing risks to ESs is thought to be LULC changes, which are mostly the result of human activities (Teixeira et al., 2014; Maxwell et al., 2016; Mengist et al., 2022). For example, one assessment conducted on a worldwide scale estimated that over 1.30×10⁷ hm2 of forest is converted to agricultural land per year, and approximately 40.00% of the land area on the Earth is utilized for crop production (Arowolo et al., 2018). Park et al. (2018) argued that converting natural ecosystems to croplands, plantations, and urban areas increases the production of food, fiber, timber, and housing, but reduces other ESs. Human-induced land change affects the structure and function of ecosystems, which in turn impacts the services these ecosystems provide (De Groot et al., 2002; MEA, 2005). Over the last 50 a, the growth of human population has contributed to a 60.00% decline in global ESs (MEA, 2005; Costanza et al., 2014, Wangai et al., 2018). On the Loess Plateau of China, the total ESV decreased by 6.79×10⁶ USD between 1990 and 2000 but increased by 4.60×10⁶ USD from 2000 to 2015 (Jiang et al., 2020).
In Ethiopia, different studies revealed that the decline of ESVs is associated with LULC changes. For instance, Kindu et al. (2016) found that in the Munessa Shashemene environment of the Ethiopian highlands, the total ESV decreased from 1.31×10⁸ USD in 1973 to 1.11×10⁸ USD in 2012. Furthermore, a study conducted by Mengist et al. (2022) found that between 1986 and 2019, the total ESV decreased from 5.82×10⁹ to 5.54×10⁹ USD in the Kaffa Biosphere Reserve. The total ESV of the upper Blue Nile basin in Ethiopia decreased from 2.68×10⁷ USD in 1985 to 2.10×10⁷ USD in 2015 (Gashaw et al., 2018). Additionally, according to Shiferaw et al. (2021), the Gojeb watershed sub-basin has lost almost 0.55×10⁹ USD of ESVs over the past 30 a. The various studies mentioned above highlight how LULC changes, mainly due to population pressures, affect the availability of numerous ESs. Thus, a rising concern is the growing imbalance in the provision of ESs in the context of rapidly expanding urbanization and development (Zhang et al., 2015).
Previous researches conducted in Ethiopia (Kindu et al., 2016; Tolessa et al., 2017; Shiferaw et al., 2021; Mengist et al., 2022) revealed that the detrimental effects of LULC changes have caused ecosystem degradation and the effect has led to an immense impact on rural livelihoods. According to previous researches (Gashaw et al., 2018; Tolessa et al., 2021; Mengist et al., 2022), we found that land degradation has led to the loss of about 17.70% of ESVs in Ethiopia. Factors such as farm expansion for crops and timber, overgrazing, and climate change have contributed to land and ecosystem degradation (Sutton et al., 2016; Shiferaw et al., 2021).
One of the primary headwaters of the Lake Tana sub-basin is the upper Gilgel Abbay watershed. Within the upper Abbay River Basin, the watershed is a highly populated and agriculturally productive region. Major issues faced by the study watershed include deforestation, excessive grazing, severe soil erosion, and agricultural land development (Rientjes et al., 2011; Gashaw et al., 2020; Abuhay et al., 2023). Rapid population growth and human activities, especially overgrazing and land reclamation, have led to vegetation degradation and accelerated soil erosion, reducing the ESVs of the study watershed. The community, legislators, and decision-makers are not best suited to understand the monetary valuation of ESs in the study area. Hence, monetary valuation can support payment schemes for the ESs and inform the costs of restoration strategies in the watershed. The current evidence available from several regions of Ethiopia suggests that the ESs linked to LULC changes are dynamic and differ both temporally and spatially. In addition, ESs are context-dependent. Further research on the estimation of ESs is necessary to contribute to a better understanding. Therefore, conducting this study is essential for improving watershed restoration. Thus, this study focuses on quantifying the spatiotemporal impacts of LULC changes on ESVs in the upper Gilgel Abbay watershed. Hence, the objectives of this study are: to evaluate the impacts of LULC changes on the total ESV during 1986-2021, and to estimate the individual ESV in response to LULC changes from 1986 to 2021.

2. Materials and methods

2.1. Study area

The study area is located in the upper Gilgel Abbay watershed (11°04′-11°20′N, 36°45′-37°30′E), covering 1632 km2. According to Alemu and Melesse (2019), the Gilgel Abbay watershed is the main river that supplies the majority of the inflow into the Tana Lake from the south escarpment of the Tana Lake sub-basin. The elevation of the watershed ranges from 1889 to 3510 m. The two seasons in the area are the dry season (October-May of the next year) and the rainy season (June-September) (Haile and Rientjes, 2015; Abuhay et al., 2023). The watershed is situated in the sub-humid and humid zones (Mhiret et al., 2019).
Based on the data provided by the National Meteorological Agency (NMSA, 2021), the long-term average annual rainfall (1993-2007) in the study area is 1489 mm, with around 78.00% of the rainfall occurring between June and September. On average, Ethiopia’s highland areas, including the Upper Gilgel Abbay watershed, receive 5-8 h of sunlight per day during the dry season. The average annual maximum and minimum temperatures in the study area are 25°C and 9°C, respectively (Abuhay et al., 2023). The main economic activity in this watershed is rain-fed agriculture. Subsistence crops and livestock production systems are the predominant form of agriculture in this watershed. Due to the pressure of a growing population, the land in this watershed is cultivated in a way that varies from moderate to intensive.

2.2. Land use/land cover (LULC) classifications

This study used time series Landsat imageries, including Landsat 5 Thematic Mapper (TM) of 1986, Landsat 7 Enhanced Thematic Mapper Plus (ETM+) of 2003, and Landsat 8 Operational Land Imager Thermal Infrared Sensor (OLI-TIRS) of 2021. These satellite images were taken from the United State of Geographic Surveys (USGS) website (https://earthexplorer.usgs.gov/). The LULC maps of the study area were created using the satellite images. A 30-m spatial resolution was used for these satellite images. The effects of seasonal changes were eliminated by using cloud-free and dry season images. For this reason, we acquired all images in January. Prior to processing, the obtained images underwent geometric and radiometric adjustments to improve image quality. Furthermore, in order to ensure the uniformity of images throughout the analysis process, we projected these images onto the World Geodetic System 84 (WGS84) datum and the Universal Transverse Mercator (UTM) zone 37N.
These images were classified using the supervised classification method following the Maximum Likelihood Classification (MLC) algorithm in ERDAS software (version 2014; Intergraph Corporation, Alabama, the USA). There are five LULC types in the study area, including cultivated land, forest, shrubland, grassland, and water body. Table 1 presents the operational definitions of LULC types identified in the study area. The 2021 image classification was performed by collecting 500 ground truth points (GTPs) collected from the field (100 GTPs for each LULC type) while reference points for the 1986 and 2003 Landsat images were obtained from Google Earth image.
Table 1 Description of land use/land cover (LULC) types.
LULC type Description
Cultivated land Areas used for annual crops and irrigated areas as well as the scatter rural settlements
Grassland Areas covered by grasses, usually, used for grazing and those remaining for some months in a year
Shrubland Land covered with herbaceous plants, shrubs, and scattered trees, usually, less-denser than forest
Forest Areas covered with both plantation and natural forests
Water body Land covered with any significant accumulation of water, including wetlands

Note: Adapted from Bogale et al. (2024).

The classification accuracy of LULC maps was assessed using 247, 281, and 200 reference points for 1986, 2003, and 2021, respectively. To determine the degree of the classification accuracy, we calculated the overall accuracy and Kappa coefficient. A discrete multivariate method, the Kappa coefficient, is often used to evaluate classification performance from an error matrix. It measures how the classified results compare to values generated by chance. The Kappa coefficient equal to 0 indicates no agreement between the reference image and the classified image, whereas the Kappa coefficient equal to 1 indicates perfect classification (Congalton and Green, 2008). On the other hand, the overall accuracy is computed by dividing the correctly categorized pixels by the total reference pixels in a classified image (Congalton and Green, 2008; Hundu et al., 2021). The overall accuracy and Kappa coefficient were computed using the following equations:
OA= X Y
K h a t = N i = 1 r X a b i = 1 r ( X a × X b ) N 2 i = 1 r ( X a × X b )
where OA is the overall accuracy; X is the number of correct values on the diagonals of the matrix; Y is the total number of values taken as a reference point; Khat is the Kappa coefficient; N is the total number of observations; r is the number of rows in the confusion matrix; i is the starting value; Xab is the total number of observations in row a and column b; Xa is the total number of observations in row a; and Xb is the total number of observations in column b.

2.3. Quantifying the impacts of LULC changes on ecosystem service values (ESVs)

ESVs of the study area were determined using LULC data in 1986, 2003, and 2021. It is essential to evaluate the ecosystem functions gained or lost in the study area due to LULC changes across different temporal and spatial scales. The LULC data of the study area and global ESV databases were used to calculate ESVs. After preparing the LULC data for the three reference years, ArcGIS software (version 10.3.1; Environmental Systems Research Institute, California, the USA) was used to determine the corresponding area. Based on Ethiopian conditions described by Kindu et al. (2016) (Tables 2 and 3), we assigned the ESV coefficients to each LULC type. As each LULC type did not perfectly match the biome type, we assigned the equivalent biome as follows: (1) cropland for cultivated land, (2) tropical forest for forest and shrubland, (3) rangeland for grassland, and (4) river and lake for water body (Table 2).
Table 2 Corresponding biomes for LULC types and ecosystem service value (ESV) coefficients based on the adjusted estimations.
LULC type Area (hm2) Equivalent biome ESV coefficient (USD/(hm2•a))
1986 2003 2021
Cultivated land 104,600 116,800 99,900 Cropland 225.56
Forest 15,400 9400 24,100 Tropical forest 986.69
Shrubland 30,600 25,200 28,600 Tropical forest 986.69
Grassland 12,400 11,700 10,800 Rangeland 293.25
Water body 200 60 30 River and lake 8103.50
Table 3 Adjusted ESV coefficients for each biome.
ES function Adjusted ESV coefficient (USD/(hm2•a))
Cropland Tropical forest Rangeland River and lake
Water supply 8.00 117.45 2117.00
Food production 187.56 32.00 41.00
Raw materials 51.24
Genetic resources 41.00 3.00
Water regulation 6.00
Climate regulation 223.00 5445.00
Disturbance regulation 5.00 7.00 431.50
Gas regulation 13.68 23.00
Biological control 24.00 29.00
Erosion control 245.00 87.00
Waste treatment 136.00
Nutrient cycling 184.40 25.00
Pollination 24.00 7.27 1.00
Soil formation 10.00
Habitat/refuge 17.30 0.80
Recreation 4.80 69.00
Cultural 2.00
Total 235.56 986.69 293.25 8103.50

Note: Data are come from Kindu et al. (2016). ES, ecosystem service.

To determine the overall ESV for each specific LULC type, we also multiplied the appropriate coefficients by the area of each LULC type. In order to determine the overall ESV of the watershed, the values of LULC type for each year were added up. Equation 3 (Kindu et al., 2016; Gashaw et al., 2018; Anley et al., 2022) was utilized to compute the total ESV for 1986, 2003, and 2021. Furthermore, Equation 4 was utilized to calculate the values of the 17 distinct ES functions (Kindu et al., 2016; Gashaw et al., 2018). Equation 5 was used to estimate the change in ESVs during the two different periods (i.e., 1986-2003 and 2003-2021) (Kindu et al., 2016; Anley et al., 2022).
ESV k = ( A k × V C k )
ESV f = ( A k × V C f k )
Change of ESV = ESV 1 ESV 0 ESV 0 × 100 %
where ESVk is the ESV of LULC type k (USD/(hm2•a)); ESVf is the ESV of ES function f (USD/(hm2•a)); Ak is the area of LULC type k (hm2); VCk is the value coefficient for LULC type k; VCfk is the value coefficient of ES function f for LULC type k; ESV1 is the ESV in the final year (USD/(hm2•a)); and ESV0 is the ESV in the initial year (USD/(hm2•a)).

3. Results

3.1. LULC changes

Table 4 displays the results of overall accuracy, Kappa coefficient, user accuracy, and producer accuracy for the LULC types in 1986, 2003, and 2021. The classification achieved Kappa coefficients of 0.81, 0.84, and 0.88 for 1986, 2003, and 2021, respectively. The overall accuracy was 85.00%, 88.00%, and 91.00% for 1986, 2003, and 2021, respectively. These results fall within an acceptable range, indicating effective image classification. An overall accuracy above 80.00% and a Kappa coefficient exceeding 0.75 were achieved for the study area, confirming the suitability of the classified images for further applications.
Table 4 Accuracy assessment results of the classified images.
LULC type 1986 2003 2021
User accuracy
(%)
Producer accuracy (%) User accuracy
(%)
Producer accuracy (%) User accuracy
(%)
Producer accuracy (%)
Water body 87.00 96.00 90.00 100.00 100.00 83.00
Shrubland 79.00 86.00 80.00 84.00 86.00 91.00
Grassland 90.00 87.00 97.00 90.00 96.00 98.00
Cultivated land 89.00 89.00 89.00 79.00 95.00 83.00
Forest 81.00 81.00 82.00 96.00 83.00 96.00
Overall accuracy (%) 85.00 88.00 91.00
Kappa coefficient 0.81 0.84 0.88
Figure 1 displays the spatial distribution patterns of the five LULC types in the study area for 1986, 2003, and 2021, with a spatial resolution of 30 m. The result demonstrated that, during the study period, cultivated land was the main LULC type. The area of cultivated land accounted for 64.50%, 71.50%, and 61.50% of the total area in 1986, 2003, and 2021, respectively. The area of forest covered approximately 9.50%, 5.90%, and 14.80% of the total area in 1986, 2003, and 2021, respectively. The area of shrubland accounted for 18.70%, 15.40%, and 17.40% of the total area in 1986, 2003, and 2021, respectively. The area of grassland covered approximately 7.60%, 7.20%, and 6.60% of the total area in 1986, 2003, and 2021, respectively. The area of water body covered an insignificant portion of the total area, accounting for 0.12%, 0.04%, and 0.02% in 1986, 2003, and 2021, respectively. In general, between 2003 and 2021, the area of cultivated land decreased and the area of shrubland expanded. The area of grassland and water body decreased during 1986-2021.
Fig. 1. Land use/land cover (LULC) maps for the study area in 1986 (a), 2003 (b), and 2021 (c).

3.2. Impacts of LULC changes on the total ESV

We calculated the total ESV of the study area in 1986, 2003, and 2021 based on the ESV of each LULC type (Table 5). The results showed that the changes of ESVs were non-uniform in direction during the study period (Table 5). The total ESV decreased from 7.42×10⁷ USD in 1986 to 6.44×10⁷ USD in 2003, then rose significantly to 7.76×10⁷ USD in 2021. During 1986-2003, the total ESV decreased by approximately 0.98×10⁷ USD, and from 2003 to 2021, the total ESV increased by nearly 1.32×10⁷ USD. The observed net gain and loss in ESVs were attributed to LULC changes over the study period.
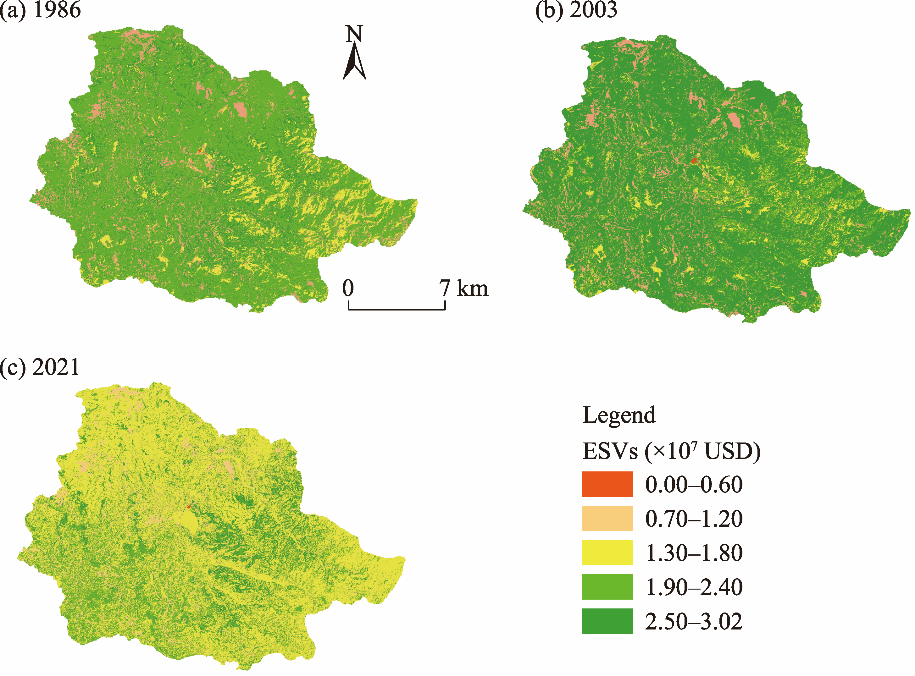
Table 5 Total estimated ESV for each LULC type in 1986, 2003, and 2021.
LULC type 1986 2003 2021 Percentage change
in ESVs (%)
ESVs
(×107 USD)
Percentage of ESVs (%) ESVs
(×107 USD)
Percentage of ESVs (%) ESVs
(×107 USD)
Percentage of ESVs (%) 1986-2003 2003-2021
Cultivated land 2.36 31.80 2.63 40.90 2.25 29.00 2.75 -3.81
Forest 1.52 20.50 0.93 14.40 2.38 30.60 -5.92 14.50
Shrubland 3.02 40.70 2.49 38.60 2.79 36.00 -5.33 3.06
Grassland 0.36 4.80 0.34 5.30 0.32 4.10 -0.21 -0.26
Water body 0.16 2.20 0.05 0.80 0.02 0.30 -1.13 -0.24
Total 7.42 100.00 6.44 100.00 7.76 100.00 -9.84 13.24
The unprecedented expansion of cultivated land between 1986 and 2003 was the main driver of the significant decline in the area of forest and shrubland, reducing the total ESV by 4.50%. Between 2003 and 2021, the increase in the area of forest and shrubland was significantly higher than that of cultivated land, contributing to a rise in the total ESV. A minor increase in the area of grassland also contributed to the rise in the total ESV. Additionally, Figure 2 illustrates the spatial distribution of the total ESV during the study period. From 1986 to 2021, cultivated land, forest, and shrubland contributed more to the overall ESV, while grassland and water body contributed less.
Fig. 2. Spatial distribution of ecosystem service values (ESVs) in the upper Gilgel Abbay watershed in 1986 (a), 2003 (b), and 2021 (c).

3.3. Impacts of LULC changes on the individual and clustered ESVs

We categorized the function contribution rates of individual ESV to the total ESV in 1986, 2003, and 2021 based on the estimated ecosystem service value function (ESVf) (Table 6). Food production, erosion control, climate regulation, nutrient cycling, and waste treatment were identified as the more valuable ESs influencing the total ESV. Their combined contributions were 6.03×10⁷, 5.31×10⁷, and 6.43×10⁷ USD in 1986, 2003, and 2021, respectively. Based on the main categories of ESVs, regulating service had the largest contribution to ecosystem function, followed by provisioning service and supporting service (Table 6). Cultural service, however, contributed the least overall. The total ESV in the study area showed a declining trend from 1986 to 2003. Over time, the ESVs of forest, shrubland, grassland, and water body decreased in various extents due to the associated LULC changes. The LULC changes were attributed to the reductions of these ESVs, particularly driven by the expansion of cultivated land in 2003. Thus, change was derived from the alteration of one LULC type to another LULC type through the entire period. On the other hand, the ESVs were improved between 2003 and 2021, primarily due to the increase of the area of forest and shrubland during this period.
Table 6 Results of the estimated ecosystem service value function (ESVf).
ES ES function ESVf in 1986
(×106 USD)
ESVf in 2003
(×106 USD)
ESVf in 2021
(×106 USD)
Changes of ESVf between 1986 and 2003 (×106 USD) Changes of ESVf between 2003 and 2021 (×106 USD)
Provisioning service Water supply 0.79 0.40 0.48 -0.39 0.08
Food production 22.56 24.39 21.68 1.84 -2.71
Raw materials 2.36 1.77 2.68 -0.58 0.91
Genetic resources 1.89 1.42 2.15 -0.47 0.73
Total 27.59 27.99 27.00 0.40 -0.99
Regulating service Water regulation 1.40 0.57 0.51 -0.83 -0.06
Climate regulation 10.34 7.72 11.69 -2.63 3.97
Disturbance regulation 0.23 0.17 0.26 -0.06 0.09
Gas regulation 0.72 0.56 0.79 -0.16 0.24
Biological control 2.80 3.07 2.65 0.28 -0.43
Erosion control 11.63 8.82 13.15 -2.81 4.33
Waste treatment 7.33 5.75 8.08 -1.59 2.33
Total 34.45 26.65 37.13 -7.80 10.47
Supporting service Nutrient cycling 8.48 6.38 9.66 -2.10 3.28
Pollination 2.11 2.18 2.05 0.07 -0.13
Soil formation 0.47 0.36 0.53 -0.11 0.18
Habitat/refuge 0.80 0.60 0.91 -0.20 0.31
Total 11.86 9.52 13.15 -2.34 3.64
Cultural service Recreation 0.24 0.18 0.26 -0.06 0.08
Cultural heritage 0.09 0.07 0.10 -0.02 0.04
Total 0.34 0.25 0.37 -0.09 0.12

4. Discussion

4.1. Trends of LULC changes

The significant LULC changes in the study area are linked to the increase in the area of cultivated land at the expense of forest, shrubland, and grassland during 1986-2003. During the study period, the study area experienced dynamic changes in LULC, with the area of cultivated land showing a notable increase and the area of forest and shrubland experiencing a decrease between 1986 and 2003. Factors contributing to the area loss of forest include pressure neighboring residents due to the need for agriculture, overgrazing, charcoal manufacturing, building development, and forest clearing for habitation. These factors are also corresponding to the findings of Mengist et al. (2022) in Eastern Afromontane Biodiversity Hotspots, which show that a significant amount of forest was converted to cultivated land between 1986 and 2019. Furthermore, studies regarding LULC changes carried out in East Africa revealed an increase in the area of cultivated land at the expense of natural forest, leading to a decrease in the area of woody vegetation from 1998 to 2017 (Rotich et al., 2022). Similarly, the study of Belay and Mengistu (2019) reported a significant upward trend in the area of cultivated land, and a downward trend in the area of grassland, forest, and shrubland in the Muga watershed of Ethiopia from 1985 to 2017. However, the local community-initiated afforestation activities by planting Eucalyptus for better economic benefits and Acacia decurrens (J.C. Wendl.) Willd. for charcoal production, resulting in the expansion of forest and shrubland at the expense of cultivated land between 2003 and 2021. These operations made it possible to improve the coverage of forest and shrubland. The decrease in cultivated land and the increase in forest in the study area between 2003 and 2021 are contrary to earlier research conducted in Ethiopia and abroad (Abuhay et al., 2023). The LULC changes in the study area showed a non-uniform direction throughout the study period.

4.2. LULC changes and their effects on ecosystem services (ESs)

LULC changes ultimately had a significant effect on ESs provided by the study area. The conversion of forest, shrubland, and grassland to cultivated land during 1986-2003 resulted in a decrease in the overall ES in the study area. Similar investigations have been conducted abroad (Arowolo et al., 2018; Sannigrahi et al., 2019; Gu et al., 2021) and in Ethiopia (Kindu et al., 2016; Gashaw et al., 2018; Tolessa et al., 2018; Muleta et al., 2020; Tolessa et al., 2021; Mengist et al., 2022). Overall, the findings of these studies support that LULC changes directly impact the total ESV.
A considerable loss of ESs could be significantly impacted by land degradation, mostly as a result of deforestation and increased agricultural production (Shiferaw et al., 2021). The overall loss of ESVs has been mostly attributed to the disappearance of natural vegetation (Woldeyohannes et al., 2020; Berihun et al., 2021). Immediate action is necessary to address the loss in both overall ES and individual ESs in order to repair and manage the landscape for sustainable socio-ecological uses and services. Different studies have indicated that over the past three decades, cultivated land has increased at the expense of forest, shrubland, grassland, and water body, leading to a steady decrease in the ESVs (Markos et al., 2018; Nigussie et al., 2020; Debie and Anteneh, 2022; Nayak et al., 2024). The current planting of Eucalyptus and A. decurrens on more arable land may have a beneficial effect on the ESVs, as evidenced by the increase in overall ESV from 2003 to 2021. Farmers in the study area have been motivated to plant trees due to declining crop yields resulting from land degradation.
Reduced crop productivity in the study area as a result of land degradation is the main factor pushing people to plant trees during 2003-2021. Furthermore, the primary motivations for planting Eucalyptus and A. decurrens include the production of charcoal, availability of firewood, enhanced soil fertility, reduced runoff, and high cash revenue from employment opportunities. Due to their strong desire to benefit from expanded revenue sources, people planted Eucalyptus and A. decurrens, increasing the area of forest and shrubland in the study area. This is consistent with previous researches conducted in Ethiopia (Nigussie et al., 2020; Amare et al., 2022; Mengist et al., 2022; Afework et al., 2023). Likewise, research conducted on the Loess Plateau and the upstream region of Xiong’an New Area, China, has demonstrated an increase in the total ESV (Jiang et al., 2020; Wang et al., 2020).

4.3. Implications of LULC changes for individual and clustered ESs

Food production was the dominant ES identified during 1986-2021, primarily due to the extensive percentage of cultivated land in the study area. Similarly, erosion control also contributed significantly to individual ESs from 2003 to 2021. There was considerable fluctuation in both individual and clustered ESs from 1986 to 2021. The major individual ESs were food production, erosion control, climate regulation, nutrient cycling, and waste treatment. The expansion of cultivated land increased the value of food production functions. Communities shifted from cultivating crops to planting trees for the sale of wood poles and charcoal production between 2003 and 2021 to increase revenue. ESs were positively impacted by the area growth of shrubland and forest at the expense of other LULC types. This implies that the increment of shrubland and forest during this period would enable to reduce the soil erosion. This is consistent with findings from other studies conducted in Spain (Anaya-Romero et al., 2016; García-Llamas et al., 2019), which highlight improvements in air quality regulations. It also enhanced the provisioning service, such as wood supply, wood fuel, wild edible, and biochemicals.
Similarly, other studies have shown that the area growth of shrubland and woodland increased the value of each ES function (Berihun et al., 2021). Forest and shrubland must be protected because they offer a high value of ESs and are essential for preserving ESVs (Sharma et al., 2019; Ketema et al., 2021). Furthermore, planting A. decurrens increases the potential for water resources (Castro-Díez et al., 2021). However, in earlier times, the ESVs of regulating climate, controlling erosion, and cycling nutrients were diminished due to the expansion of cultivated land at the expense of forest and shrubland (Gashaw et al., 2018; Woldeyohannes et al., 2020). The estimated ESVs in response to LULC changes can be applied for the sustainable development of the study area by reducing land degradation and can be utilized as a policy input to enhance ESs.

5. Conclusions

This study highlights the significant impacts of LULC changes on ESVs in the upper Gilgel Abbay watershed, Ethiopia, from 1986 to 2021. This study demonstrates the intricate relationship among agricultural expansion, deforestation, and subsequent afforestation efforts, with important implications for ESs. The result showed that between 1986 and 2003, the expansion of cultivated land resulted in a decrease in the total ESV primarily due to the loss of key ESs, such as climate regulation, erosion control, and nutrient cycling. In contrast, from 2003 to 2021, the total ESV increased, driven by afforestation activities, particularly the planting of Eucalyptus and A. decurrens, which enhanced the area of forest and shrubland. These changes in LULC improved regulating and supporting services, underscoring the ecological benefits of reforestation and sustainable land management practices. The study emphasizes the importance of balanced land-use strategies that prioritize both agricultural productivity and ecosystem sustainability. Decision-makers and stakeholders should promote practices that prevent deforestation, encourage afforestation, and protect critical ESs. This is essential for addressing environmental degradation, mitigating the impacts of climate change, and supporting the well-being of communities. The research highlights the significance of sustainable land-use policies in upkeeping ESs and achieving ecological and socio-economic benefits in the study area and similar regions in the world.

Author contribution

Wassie Abuhay ASCHENEFE: conceptualization, methodology, data creation, software, formal analysis, investigation, writing - original draft, and writing - review & editing; Temesgen Gashaw TAREKEGN: conceptualization, supervision, validation, and visualization; Betelhem Fetene ADMAS: supervision, methodology, investigation, validation, and visualization; and Solomon Mulu TAFERE: writing - review & editing. All authors approved the manuscript.

Declaration of conflict of interest

The authors affirm that they have no known financial or interpersonal conflicts that would have appeared to have an impact on the research presented in this study.
[1]
Abuhay W., Gashaw T., Tsegaye L., 2023. Assessing impacts of land use/land cover changes on the hydrology of Upper Gilgel Abbay watershed using the SWAT model. J. Agric. Food Res. 12, 100535, doi: 10.1016/j.jafr.2023.100535.

[2]
Afework A., Minale A.S., Teketay D., et al., 2023. Spatio-temporal dynamics of Acacia decurrens plantations in Awi Zone Highlands, Northwest Ethiopia. Papers in Applied Geography. 9(4), 442-463.

[3]
Alemu W.G., Melesse A.M., 2019. Impacts of long-term conservation measures on ecosystem services in Northwest Ethiopia. Int. Soil Water Conserv. Res. 8(1), 47-55.

[4]
Amare T., Amede T., Abewa A., et al., 2022. Remediation of acid soils and soil property amelioration via Acacia decurrens-based agroforestry system. Agrofor. Syst. 96(2), 329-342.

[5]
Anaya-Romero M., Muñoz-Rojas M., Ibáñez B., et al., 2016. Evaluation of forest ecosystem services in Mediterranean areas. A regional case study in South Spain. Ecosyst. Serv. 20, 82-90.

[6]
Anley M.A., Minale A.S., Haregeweyn N., et al., 2022. Assessing the impacts of land use/cover changes on ecosystem service values in Rib watershed, Upper Blue Nile Basin, Ethiopia. Trees For. People. 7, 100212, doi: 10.1016/j.tfp.2022.100212.

[7]
Arowolo A.O., Deng X.Z., Olatunji O.A., et al., 2018. Assessing changes in the value of ecosystem services in response to land-use/land-cover dynamics in Nigeria. Sci. Total Environ. 636, 597-609.

[8]
Belay T., Mengistu D.A., 2019. Land use and land cover dynamics and drivers in the Muga watershed, Upper Blue Nile basin, Ethiopia. Remote Sens. Appl.-Soc. Environ. 15, 100249, doi: 10.1016/j.rsase.2019.100249.

[9]
Berihun M.L., Tsunekawa A., Haregeweyn N., et al., 2021. Changes in ecosystem service values strongly influenced by human activities in contrasting agro-ecological environments. Ecol. Process. 10(1), 52, doi: 10.1186/s13717-021-00325-1.

[10]
Bogale T., Damene S., Seyoum A., et al., 2024. Land use land cover change intensity analysis for sustainable natural resources management: The case of northwestern highlands of Ethiopia. Remote Sens. Appl.-Soc. Environ. 34, 101170, doi: 10.1016/j.rsase.2024.101170.

[11]
Cademus R., Escobedo F.J., McLaughlin D., et al., 2014. Analyzing trade-offs, synergies, and drivers among timber production, carbon sequestration, and water yield in Pinus elliotii forests in southeastern USA. Forests. 5(6), 1409-1431.

[12]
Castro-Díez P., Alonso Á., Saldaña-López A., et al., 2021. Effects of widespread non-native trees on regulating ecosystem services. Sci. Total. Environ. 778, 146141, doi: 10.1016/j.scitotenv.2021.146141.

[13]
Congalton R.G., Green K., 2008. Assessing the Accuracy of Remotely Sensed Data (2nd ed.). Boca Raton: CRC Press.

[14]
Costanza R., De Groot R., Sutton P., et al., 2014. Changes in the global value of ecosystem services. Glob. Environ. Change-Human Policy Dimens. 26, 152-158.

[15]
D’Annunzio, R., Sandker, M., Finegold, Y., et al., 2015. Projecting global forest area towards 2030. For. Ecol. Manage. 352, 124-133.

[16]
De Groot R.S., Wilson M.A., Boumans R.M.J., 2002. A typology for the classification, description and valuation of ecosystem functions, goods and services. Ecol. Econ. 41(3), 393-408.

[17]
Debie E., Anteneh M., 2022. Changes in ecosystem service values in response to the planting of Eucalyptus and Acacia species in the Gilgel Abay Watershed, Northwest Ethiopia. Trop. Conserv. Sci. 15, doi: 10.1177/19400829221108928.

[18]
Deeksha N., Shukla A.K., 2022. Ecosystem services: A systematic literature review and future dimension in freshwater ecosystems. Appl. Sci.-Basel. 12(17), 8518, doi: 10.3390/app12178518.

[19]
Duguma L.A., Hager H., 2011. Farmers’ assessment of the social and ecological values of land uses in Central Highland Ethiopia. Environ. Manage. 47(5), 969-982.

[20]
Fagerholm N., Torralba M., Burgess P.J., et al., 2016. A systematic map of ecosystem services assessments around European agroforestry. Ecol. Indic. 62, 47-65.

[21]
Fu B.J., Zhang L.W., Xu Z.Z., et al., 2015. Ecosystem services in changing land use. J. Soils Sediments. 15(4), 833-843.

[22]
García-Llamas P., Geijzendorffer I.R., García-Nieto A.P., et al., 2019. Impact of land cover change on ecosystem service supply in mountain systems: A case study in the Cantabrian Mountains (NW of Spain). Reg. Envir. Chang. 19(2), 529-542.

[23]
Gashaw T., Tulu T., Argaw M., et al., 2018. Estimating the impacts of land use/land cover changes on ecosystem service values: The case of the Andassa watershed in the Upper Blue Nile basin of Ethiopia. Ecosyst. Serv. 31, 219-228.

[24]
Gashaw T., Worqlul A.W., Dile Y.T., et al., 2020. Evaluating potential impacts of land management practices on soil erosion in the Gilgel Abay watershed, upper Blue Nile basin. Heliyon. 6(8), e04777, doi: 10.1016/j.heliyon.2020.e04777.

[25]
Gu C.J., Zhang Y.L., Liu L.S., et al., 2021. Qualifying land use and land cover dynamics and their impacts on ecosystem service in Central Himalaya Transboundary landscape based on Google Earth Engine. Land. 10(5), 506, doi: 10.3390/land10020173.

[26]
Haile A.T., Rientjes T., 2015. Evaluation of regional climate model simulations of rainfall over the Upper Blue Nile basin. Atmos. Res. 161, 57-64.

[27]
Hundu W.T., Anule P.T., Kwanga G.M., et al., 2021. Assessment of land use and land cover change using GIS and remote sensing techniques in Katsina-Ala Local Government Area of Benue State, Nigeria. Journal of Research in Forestry, Wildlife and Environment. 13(4), 195-204.

[28]
Jiang W., Fu B.J., Y.H., 2020. Assessing impacts of land use/land cover conversion on changes in ecosystem services value on the Loess Plateau, China. Sustainability. 12(17), 7128, doi: 10.3390/su12177128.

[29]
Ketema H., Wei W., Legesse A., et al., 2021. Ecosystem service variation and its importance to the wellbeing of smallholder farmers in contrasting agro-ecological zones of East African Rift. Food Energy Secur. 10(4), e310, doi: 10.1002/fes3.310.

[30]
Kindu M., Schneider T., Teketay D., et al., 2016. Changes of ecosystem service values in response to land use/land cover dynamics in Munessa-Shashemene landscape of the Ethiopian highlands. Sci. Total Environ. 547, 137-147.

[31]
Kusi K.K., Khattabi A., Mhammdi N., et al., 2020. Prospective evaluation of the impact of land use change on ecosystem services in the Ourika watershed, Morocco. Land Use Pol. 97, 104796, doi: 10.1016/j.landusepol.2020.104796.

[32]
Li S.C., Zhang H., Zhou X.W., et al., 2020. Enhancing protected areas for biodiversity and ecosystem services in the Qinghai-Tibet Plateau. Ecosyst. Serv. 43, 101090, doi: 10.1016/j.ecoser.2020.101090.

[33]
Markos M.G., Mihret D.U., Teklu E.J., et al., 2018. Influence of land use and land cover changes on ecosystem services in the Bilate Alaba Sub-watershed, Southern Ethiopia. Journal of Ecology and the Natural Environment. 10(9), 228-238.

[34]
Maxwell S., Fuller R.A., Brooks T.M., et al., 2016. Biodiversity: The ravages of guns, nets and bulldozers. Nature. 536(7615), 143-145.

[35]
MEA Millennium Ecosystem Assessment, 2005. Ecosystems and Human Well-Being:Synthesis. Washington D.C.: Island Press.

[36]
Mengist W., Soromessa T., Feyisa G.L., 2022. Estimating the total ecosystem services value of Eastern Afromontane Biodiversity Hotspots in response to landscape dynamics. Environ. Sustain. Indic. 14, 100178, doi: 10.1016/j.indic.2022.100178.

[37]
Mhiret D.A., Dagnew D.C., Assefa T.T., et al., 2019. Erosion hotspot identification in the sub-humid Ethiopian highlands. Ecohydrol. Hydrobiol. 19(1), 146-154.

DOI

[38]
Muleta T.T., Kidane M., Bezie A., 2020. The effect of land use/land cover change on ecosystem services values of Jibat forest landscape, Ethiopia. GeoJournal. 86(5), 2209-2225.

[39]
Nayak D., Shukla A.K., Devi N.R., 2024. Decadal changes in land use and land cover: impacts and their influence on urban ecosystem services. AQUA. 73(1), 57-72.

[40]
Nigussie Z., Tsunekawa A., Haregeweyn N., et al., 2020. The impacts of Acacia decurrens plantations on livelihoods in rural Ethiopia. Land Use Pol. 100, 104928, doi: 10.1016/j.landusepol.2020.104928.

[41]
NMSA (Ethiopia’s National Meteorological Services Agency), 2021. Climate Data Ethiopia’s National Meteorological Services Agency, Addis Ababa, Ethiopia. [2024-04-01]. https://www.ethiomet.gov.et.

[42]
Park S.J., Park S.Y., Park Y.B., 2018. An architecture framework for orchestrating context-aware IT ecosystems: A case study for quantitative evaluation. Sensors. 18(2), 562, doi: 10.3390/s18020562.

[43]
Randin C.F., Ashcroft M.B., Bolliger J., et al., 2020. Monitoring biodiversity in the Anthropocene using remote sensing in species distribution models. Remote Sens. Environ. 239, 111626, doi: 10.1016/j.rse.2019.111626.

[44]
Rientjes T.H.M., Haile A.T., Kebede E., et al., 2011. Changes in land cover, rainfall and stream flow in Upper Gilgel Abbay catchment, Blue Nile basin - Ethiopia. Hydrol. Earth Syst. Sci. 15(6), 1979-1989.

[45]
Rincón-Ruiz A., Arias-Arévalo P., Hernández J.M.N., et al., 2019. Applying integrated valuation of ecosystem services in Latin America: Insights from 21 case studies. Ecosyst. Serv. 36, 100901, doi: 10.1016/j.ecoser.2019.100901.

[46]
Rotich B., Kindu M., Kipkulei H., et al., 2022. Impact of land use/land cover changes on ecosystem service values in the Cherangany Hills Water Tower, Kenya. SSRN. Environmental Challenges. 8, 100576, doi: 10.2139/ssrn.4079129.

[47]
Sannigrahi S., Chakraborti S., Joshi P.K., et al., 2019. Ecosystem service value assessment of a natural reserve region for strengthening protection and conservation. J. Environ. Manage. 244, 208-227.

[48]
Sharma R., Rimal B., Baral H., et al., 2019. Impact of land cover change on ecosystem services in a tropical forested landscape. Resources-Basel. 8(1), 18, doi: 10.3390/resources8010018.

[49]
Shiferaw H., Alamirew T., Kassawmar T., et al., 2021. Evaluating ecosystems services values due to land use transformation in the Gojeb watershed, Southwest Ethiopia. Environmental Systems Research. 10(1), 22, doi: 10.1186/s40068-021-00227-3.

[50]
Styers D.M., Chappelka A.H., Marzen L.J., et al., 2010. Developing a land-cover classification to select indicators of forest ecosystem health in a rapidly urbanizing landscape. Landsc. Urban Plan. 94(3-4), 158-165.

[51]
Sutton P.C., Anderson S.J., Costanza R., et al., 2016. The ecological economics of land degradation: Impacts on ecosystem service values. Ecol. Econ. 129, 182-192.

[52]
Teixeira Z., Teixeira H., Marques J.C., 2014. Systematic processes of land use/land cover change to identify relevant driving forces: Implications on water quality. Sci. Total. Environ. 470, 1320-1335.

[53]
Tolessa T., Senbeta F., Abebe T., 2017. Land use/land cover analysis and ecosystem services valuation in the central highlands of Ethiopia. Forests Trees and Livelihoods. 26(2), 111-123.

[54]
Tolessa T., Gessese H., Tolera M., et al., 2018. Changes in ecosystem service values in response to changes in landscape composition in the central highlands of Ethiopia. Environ. Process. 5(3), 483-501.

[55]
Tolessa T., Kidane M., Bezie A., 2021. Assessment of the linkages between ecosystem service provision and land use/land cover change in Fincha watershed, North-Western Ethiopia. Heliyon. 7(7), e0767, doi: 10.1016/j.heliyon.2021.e07673.

[56]
Vo Q.T., Kuenzer C., Vo Q.M., et al., 2012. Review of valuation methods for mangrove ecosystem services. Ecol. Indic. 23, 431-446.

[57]
Wang Z.Y., Cao J.S., Zhu C.Y., et al., 2020. The impact of land use change on ecosystem service value in the upstream of Xiong’an New area. Sustainability. 12(14), 5707, doi: 10.3390/su12145707.

[58]
Wangai P.W., Burkhard B., Müller F., 2018. Quantifying and mapping land use changes and regulating ecosystem service potentials in a data-scarce peri-urban region in Kenya. Ecosyst. People. 15(1), 11-32.

[59]
Waters C.N., Zalasiewicz J., Summerhayes C., et al., 2016. The Anthropocene is functionally and stratigraphically distinct from the Holocene. Science. 351(6269), doi: 10.1126/science.aad2622.

[60]
Woldeyohannes A., Cotter M., Biru W.D., et al., 2020. Assessing changes in ecosystem service values over 1985-2050 in response to land use and land cover dynamics in Abaya-Chamo Basin, Southern Ethiopia. Land. 9(2), 37, doi: 10.3390/land9020037.

[61]
Zhang Y.S., Zhao L., Liu J.Y., et al., 2015. The impact of land cover change on ecosystem service values in urban agglomerations along the coast of the Bohai Rim, China. Sustainability. 7(8), 10365-10387.

Outlines

/