
Cost and benefit analysis of Climate-Smart Agriculture interventions in the dryland farming systems of northern Ghana
Received date: 2023-09-07
Accepted date: 2024-12-31
Online published: 2025-08-13
Copyright
There is a need for more focus in understanding the economic benefits of Climate-Smart Agriculture (CSA) interventions, particularly in sub-Saharan Africa, where extreme climate events are significantly affecting agriculture and rural livelihoods. This study used the Net Present Value (NPV), Internal Rate of Return (IRR), Benefit-Cost Ratio (BCR), and payback period to evaluate the economic viability of the adopted CSA interventions in the three villages (Doggoh, Jeffiri, and Wulling) of the dryland farming systems of northern Ghana, where CSA interventions were mostly practiced. Data were collected from 161 farm households by the questionnaire survey. The results showed that CSA interventions including livestock-crop integration, mixed cropping, crop rotation, nutrient integration, and tie ridging enhanced crop yield and the household income of smallholder farmers. The five CSA interventions selected by smallholders were in the following order of priority: livestock-crop integration (BCR=2.87), mixed cropping (BCR=2.54), crop rotation (BCR=2.24), nutrient integration (BCR=1.98), and tie ridging (BCR=1.42). Results further showed that livestock-crop integration was the most profitable CSA intervention even under a pessimistic assumption with a long payback period of 5.00 a. Moreover, this study indicated that the implementation of CSA interventions, on average, was relatively profitable and had a nominal financial risk for smallholder farmers. Understanding the economic viability of CSA interventions will help in decision-making process toward selecting the right CSA interventions for resilience development.
Felix KPENEKUU , Philip ANTWI-AGYEI , Fred NIMOH , Andrew DOUGILL , Albert BANUNLE , Jonathan ATTA-AIDOO , Frank BAFFOUR-ATA , Thomas Peprah AGYEKUM , Godfred ADDAI , Lawrence GUODAAR . Cost and benefit analysis of Climate-Smart Agriculture interventions in the dryland farming systems of northern Ghana[J]. Regional Sustainability, 2025 , 6(1) : 100196 . DOI: 10.1016/j.regsus.2025.100196
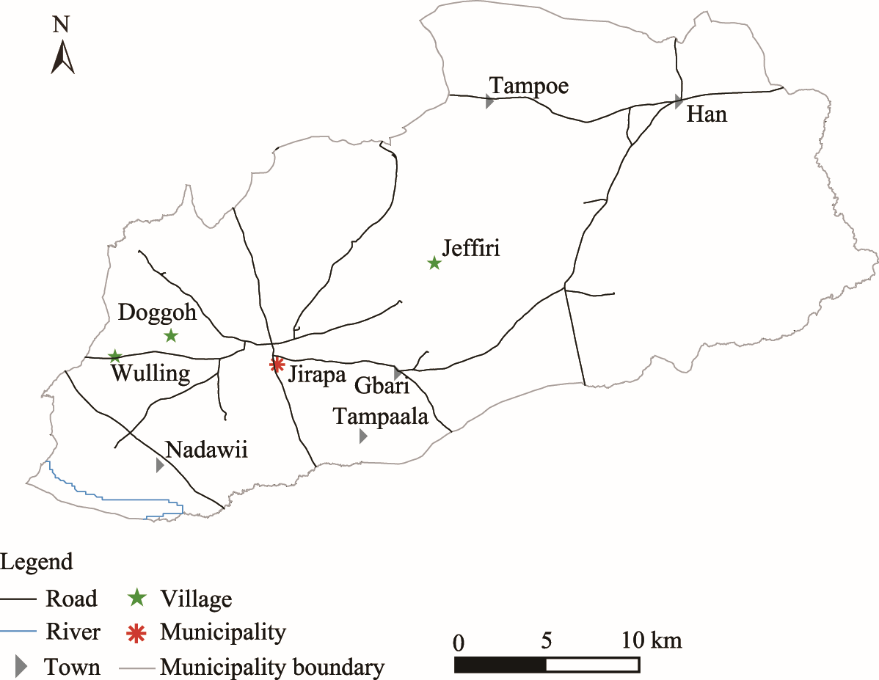
Fig. 1. Overview of the study area. |
Table 1 Climate-Smart Agriculture (CSA) interventions used in the three villages. |
| CSA intervention | Frequency | Description |
|---|---|---|
| Livestock-crop integration | 65 | Cultivation of crops and rearing of animals for meat, eggs, or milk. For instance, smallholder farmers grow cereal crops such as maize and groundnut, and also keep cattle, sheep, pigs, or poultry in livestock-crop farm to complement their food needs. Also, the dung from the cattle serves as soil nutrient for crop growing. |
| Nutrient integration | 24 | Integration of organic manure and inorganic fertilizers can improve nutrient availability of crops and retain soil moisture to increase the resilience of precipitation variability during a production season. |
| Mixed cropping | 28 | Cultivating more crops on the same land during a production season. This method promotes the efficient use of inputs such as soil, water, and fertilizer. |
| Crop rotation | 45 | Growing crops in seasonal order on the same land and alternating deep and shallow-rooted crops can reduce the reliance on one set of nutrients, pest and weed pressure, and the probability that pests and weeds will develop resistance. |
| Tie ridging | 4 | Ridge furrows are blocked with earth ties spaced at a fixed distance apart to form a series of basins in the field. |
Table 2 Affected crops and farm areas of CSA interventions in the three villages. |
| CSA intervention | Doggoh | Jeffiri | Wulling | |||
|---|---|---|---|---|---|---|
| Affected crop | Affected farm area (hm2) | Affected crop | Affected farm area (hm2) | Affected crop | Affected farm area (hm2) | |
| Livestock-crop integration | Groundnut | 2.4±0.5 | Groundnut | 1.4±0.2 | Groundnut | 2.2±0.1 |
| Maize | Maize | Maize | ||||
| Sorghum | Sorghum | Sorghum | ||||
| Millet | Millet | Millet | ||||
| Nutrient integration | Groundnut | 1.8±0.2 | Groundnut | 1.0±0.2 | Maize | 1.6±0.4 |
| Maize | Maize | Sorghum | ||||
| Sorghum | Sorghum | Millet | ||||
| Millet | Millet | Groundnut | ||||
| Mixed cropping | Groundnut | 2.6±0.4 | Groundnut | 1.2±0.4 | Groundnut | 0.9±0.6 |
| Maize | Maize | Maize | ||||
| Sorghum | Sorghum | Sorghum | ||||
| Millet | Millet | Millet | ||||
| Crop rotation | Groundnut | 1.6±0.3 | Groundnut | 0.6±0.3 | Groundnut | 1.2±0.4 |
| Maize | Maize | Maize | ||||
| Sorghum | Sorghum | Sorghum | ||||
| Millet | Millet | Millet | ||||
| Tie ridging | Maize | 1.1±0.2 | Maize | 0.7±0.3 | Maize | 0.8±0.3 |
| Sorghum | Sorghum | Sorghum | ||||
| Millet | Millet | Millet | ||||
Note: Mean±SD. |
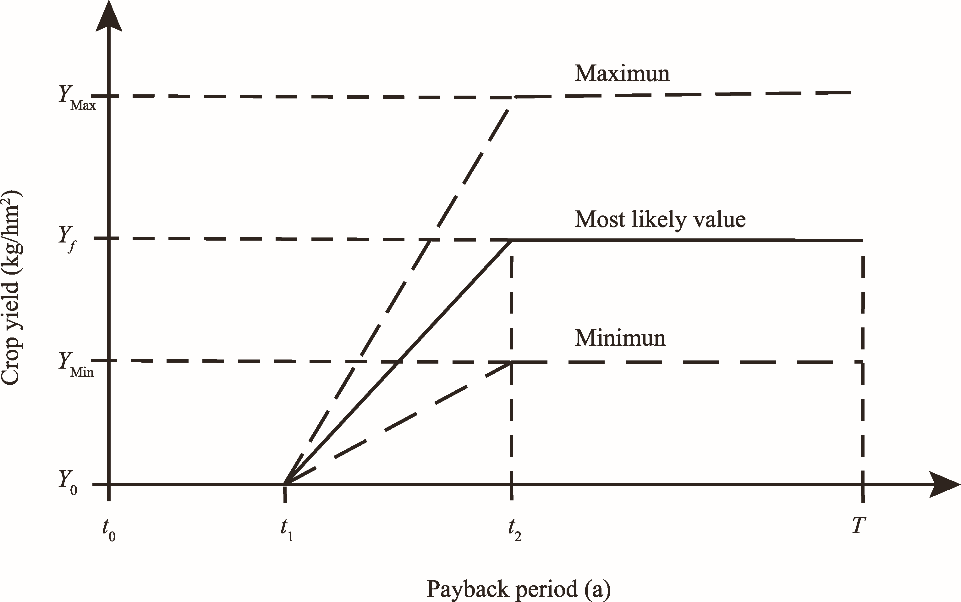
Fig. 2. Response pattern of crop yield and payback period of the implementation of Climate-Smart Agriculture (CSA) interventions. Y0 is the crop yield before the implementation of CSA interventions; Yf is the most likely crop yield after the implementation of CSA interventions; YMin is the minimum crop yield; YMax is the maximum crop yield; t0 is the time before the implementation of CSA interventions; t1 is initial time of the implementation of CSA interventions; t2 is the time achieving the maximum, most likely, and minimum crop yield of the implementation of the CSA interventions; and T is the total time of the implementation of CSA interventions. |
Table 3 Different crop yields after the implementation of CSA interventions in the three villages. |
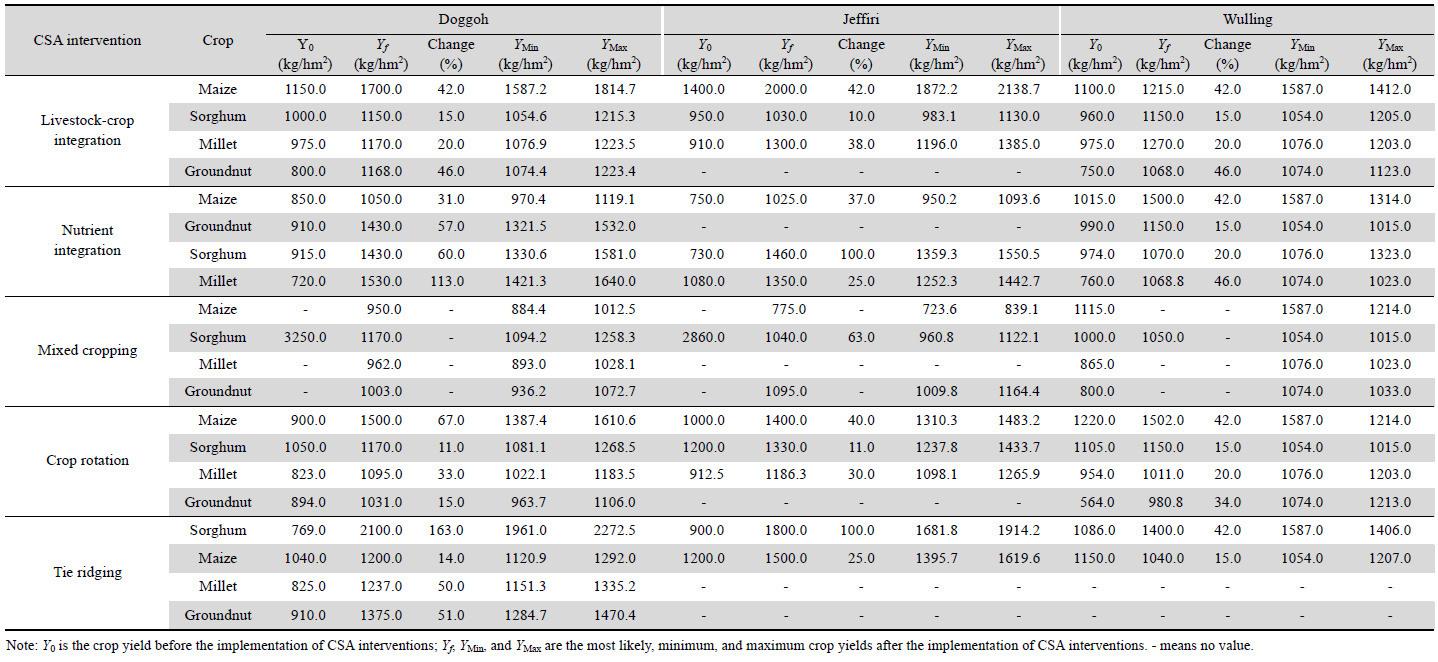 |
Table 4 Installation cost and maintenance cost of CSA interventions. |
| CSA intervention | Installation cost (USD/hm2) | Maintenance cost (USD/hm2) | ||||
|---|---|---|---|---|---|---|
| Doggoh | Jeffiri | Wulling | Doggoh | Jeffiri | Wulling | |
| Livestock-crop integration | Lognormal (494.00, 584.00) | Lognormal (305.00, 364.00) | Lognormal (133.00, 180.00) | Uniform (205.00, 287.00) | Uniform (267.00, 352.00) | Uniform (267.00, 352.00) |
| Nutrient integration | Lognormal (56.00, 122.00) | Lognormal (140.00, 206.00) | Lognormal (133.00, 180.00) | Uniform (147.00, 210.00) | Uniform (55.00, 136.00) | Uniform (267.00, 352.00) |
| Mixed cropping | Lognormal (133.00, 180.00) | Lognormal (106.00, 140.00) | Lognormal (133.00, 180.00) | Uniform (63.00, 189.00) | Uniform (78.00, 133.00) | Uniform (267.00, 352.00) |
| Crop rotation | Lognormal (2146.00, 2738.00) | Lognormal (4860.00, 6200.00) | Lognormal (133.00, 180.00) | Uniform (384.00, 819.00) | Uniform (141.00, 438.00) | Uniform (267.00, 352.00) |
| Tie ridging | Lognormal (513.00, 615.00) | Lognormal (639.00, 786.00) | Lognormal (133.00, 180.00) | Uniform (42.00, 109.00) | Uniform (308.00, 550.00) | Uniform (267.00, 352.00) |
Note: Lognormal and uniform express the data distribution types. The two values in parentheses indicate the minimum and maximum cost values, respectively. |
Table 5 Market prices of the four crops in the three villages. |
| Crop | Market price (USD/kg) | ||
|---|---|---|---|
| Doggoh | Jeffiri | Wulling | |
| Maize | Uniform (8.32, 3.64) | Uniform (2.05, 2.43) | Uniform (2.49, 1.78) |
| Sorghum | Uniform (8.49, 11.34) | Uniform (9.61, 9.42) | Uniform (7.49, 10.34) |
| Millet | Uniform (4.36, 1.75) | Uniform (3.51, 4.22) | Uniform (3.41, 5.27) |
| Groundnut | Uniform (3.32, 3.97) | Uniform (3.74, 3.49) | Uniform (1.58, 2.71) |
Note: Uniform expresses the data distribution type. The two values in parentheses indicate the minimum and maximum values of the market prices, respectively. |
Table 6 Average values of profitability indicators of the implementation of CSA interventions. |
| CSA intervention | NPV (USD) | BCR | IRR (%) | Payback period (a) |
|---|---|---|---|---|
| Livestock-crop integration | 1730 | 2.87 | 193.0 | 5.00 |
| Nutrient integration | 1490 | 1.98 | 123.0 | 1.00 |
| Mixed cropping | 1103 | 2.54 | 96.0 | 1.00 |
| Crop rotation | 1531 | 2.24 | 136.0 | 2.00 |
| Tie ridging | 233 | 1.42 | 29.0 | 3.00 |
Note: NPV, Net Present Value; BCR, Benefit-Cost Ratio; IRR, Internal Rate of Return. |
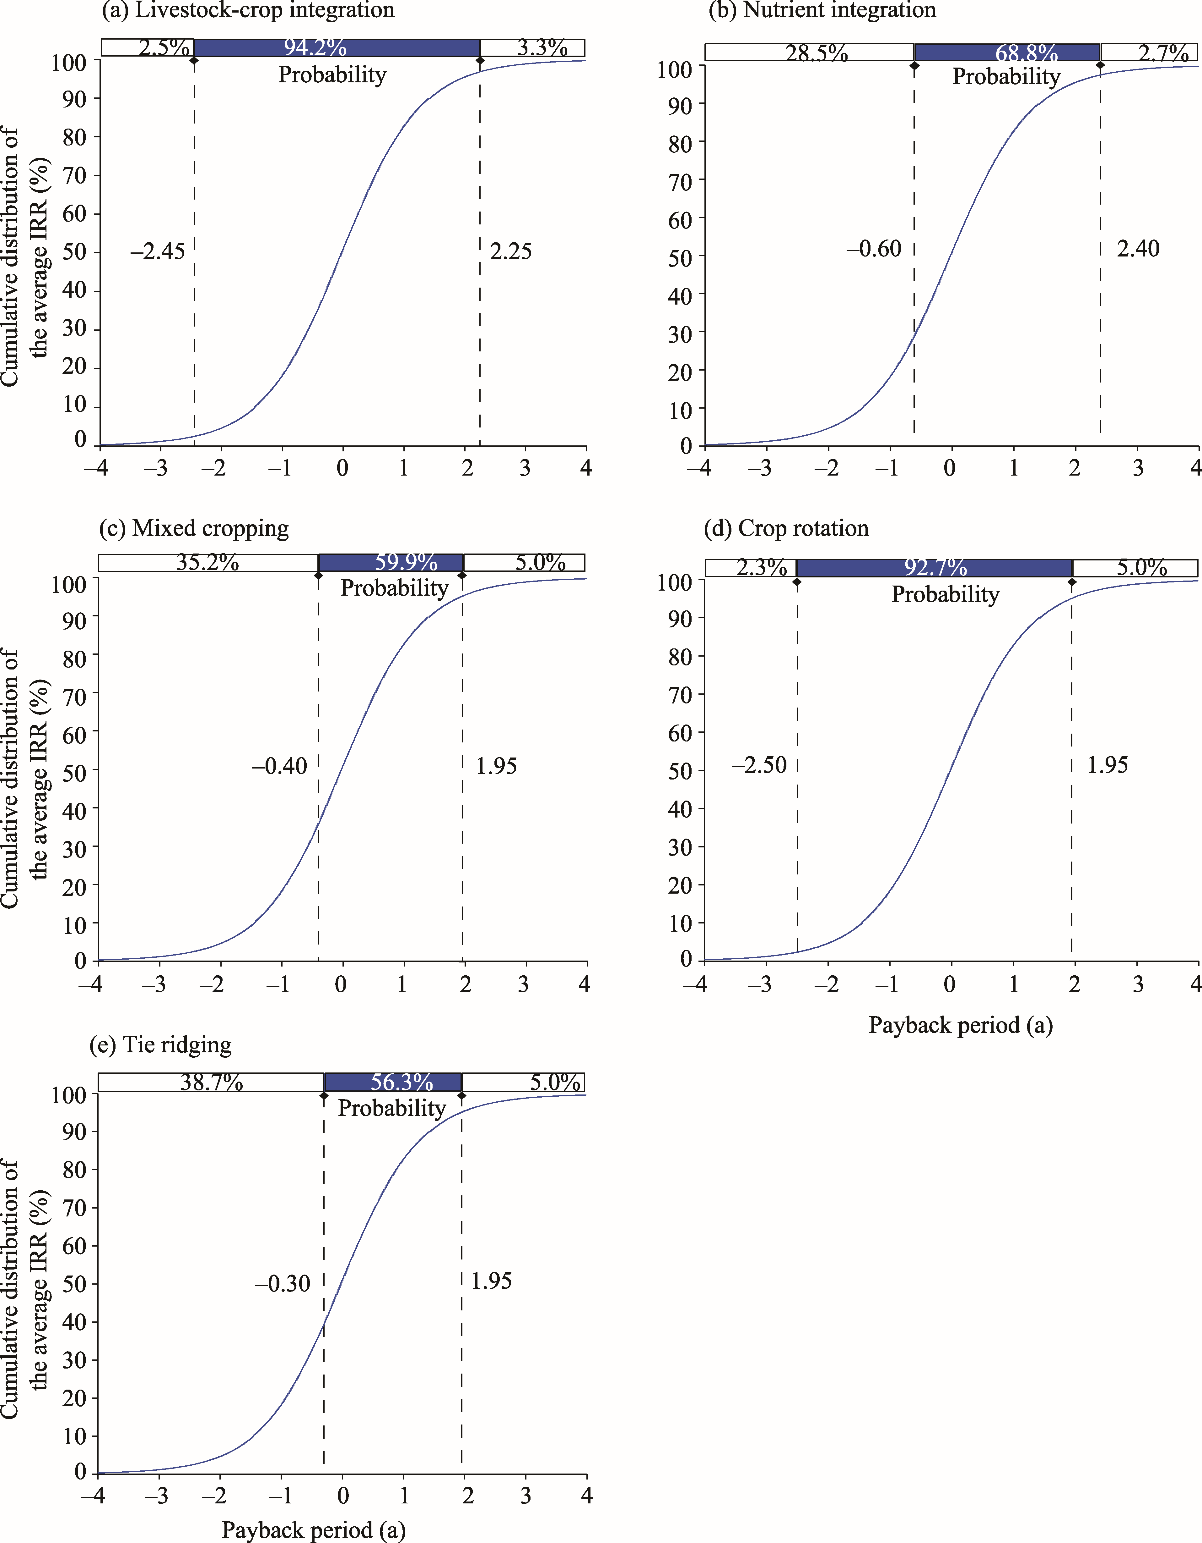
Fig. 3. Cumulative distribution of the average Internal Rate of Return (IRR) for the implementation of five CSA interventions. (a), livestock-crop integration; (b), nutrient integration; (c), mixed cropping; (d), crop rotation; (e), tie ridging. Negative values of payback period indicate that investment has been made but return has not yet been realized. |
| [1] |
|
| [2] |
|
| [3] |
|
| [4] |
|
| [5] |
|
| [6] |
|
| [7] |
|
| [8] |
|
| [9] |
|
| [10] |
|
| [11] |
|
| [12] |
BOG (Bank of Ghana), 2022. Monetary Policy Report. [2023-07-21]. https://www.bankofcanada.ca/publications/mpr/.
|
| [13] |
|
| [14] |
|
| [15] |
|
| [16] |
|
| [17] |
|
| [18] |
|
| [19] |
EPA (Environmental Protection Agency), 2021. Ghana’s Fourth National Communication to the United Nations Framework Convention on Climate Change. [2023-08-01]. http://ww.epa.gov.gh.
|
| [20] |
|
| [21] |
|
| [22] |
|
| [23] |
GSS (Ghana Statistical Service), 2018. Ghana-Ghana Living Standard Survey (GLSS 7) 2017. [2023-07-11]. https://www2.statsghana.gov.gh.
|
| [24] |
|
| [25] |
|
| [26] |
|
| [27] |
IPCC (Intergovernmental Panel on Climate Change), 2021. Climate Change 2021: The Physical Science Basis. Cambridge: Cambridge University Press.
|
| [28] |
IPCC, 2022. Climate Change 2022: Impacts, Adaptation and Vulnerability. Cambridge: Cambridge University Press.
|
| [29] |
|
| [30] |
|
| [31] |
|
| [32] |
|
| [33] |
|
| [34] |
|
| [35] |
|
| [36] |
|
| [37] |
|
| [38] |
|
| [39] |
|
| [40] |
|
| [41] |
|
| [42] |
|
| [43] |
|
| [44] |
|
| [45] |
|
| [46] |
|
| [47] |
|
| [48] |
USAID (United States Agency for International Development), 2017. Climate-smart Agricultural Practices in the Coastal Savannah Agro-ecological Zone of Ghana. [2023-08-01]. https://www.usa.gov/outreach.
|
| [49] |
|
| [50] |
|
| [51] |
|
| [52] |
|
| [53] |
|
/
| 〈 |
|
〉 |