
Unlocking climate change resilience: Socioeconomic factors shaping smallholder farmers’ perceptions and adaptation strategies in Mediterranean and Sub-Saharan Africa regions
Received date: 2024-10-01
Accepted date: 2025-01-23
Online published: 2025-08-13
Copyright
Climate change poses substantial challenges to agricultural productivity and sustainability, particularly in Mediterranean and Sub-Saharan Africa regions. Local smallholder farmers’ adaptation strategies to climate change are crucial for mitigating these impacts. Therefore, this study investigated the socioeconomic factors influencing smallholder farmers’ perceptions and adaptation strategies to climate change in four countries (Morocco, Egypt, Italy, and Senegal) of Mediterranean and Sub-Saharan Africa regions using a binary logistic regression (BLR) model. The results indicated that educational level, farming experience, agricultural income, farm size, participation in agricultural workshops, and training in Good Agricultural Practices (GAPs) significantly impacted smallholder farmers’ perceptions and adaptation strategies to climate change (such as smallholder farmers adopting drought-tolerant crops). Higher educational level was linked to the greater possibility of smallholder farmers adopting drought-tolerant crops in Italy and Egypt, while gaps in rural education limited the possibility of smallholder farmers adopting drought-tolerant crops in Morocco and Senegal. Farming experience and agricultural income also enhanced the possibility of smallholder farmers adopting drought-tolerant crops, with notable variations across countries due to systemic barriers such as limited infrastructure in Senegal. Larger farm size and participation in agricultural workshops further improved the possibility of smallholder farmers adopting drought-tolerant crops, particularly in Morocco and Egypt. The findings highlighted the importance of tailored interventions and policy measures to support smallholder farmers in effectively responding to the challenges of climate change under diverse agricultural contexts. By understanding the specific needs and circumstances of smallholder farmers in these countries, policymakers can develop more effective adaptation strategies to enhance agricultural resilience and sustainability under the context of climate change.
Osama AHMED , Mourad FAIZ , Laamari ABDELALI , Safwa KHOALI , Cataldo PULVENT , Sameh MOHAMED , Mame Samba MBAYE , Thomas GLAUBEN . Unlocking climate change resilience: Socioeconomic factors shaping smallholder farmers’ perceptions and adaptation strategies in Mediterranean and Sub-Saharan Africa regions[J]. Regional Sustainability, 2025 , 6(1) : 100195 . DOI: 10.1016/j.regsus.2025.100195
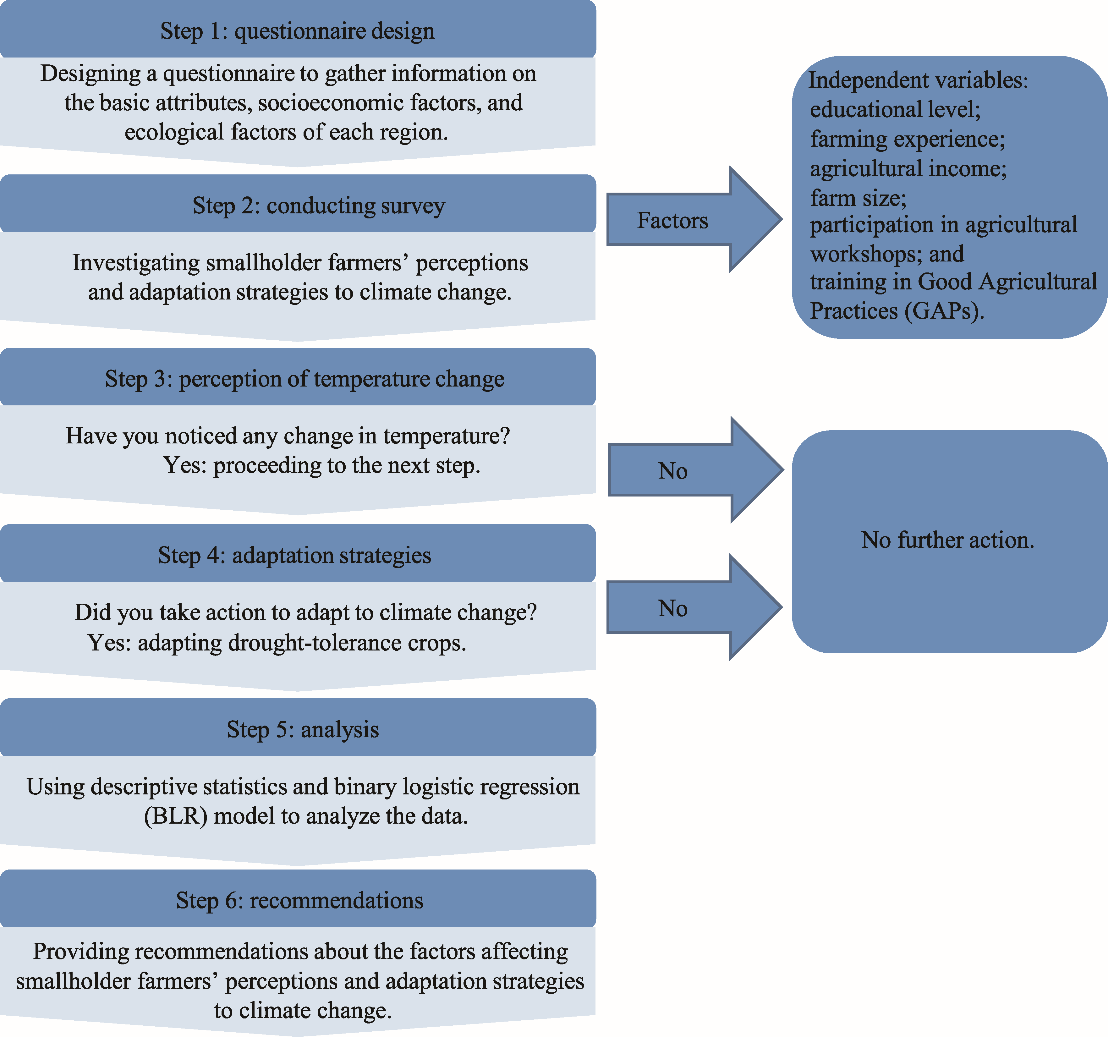
Fig. 1. Conceptual framework of this study. |
E(Yi)=Pr(Yi=1)×1+Pr(Yi=0)×1=Pr(Yi=1),
Y=f(X1, X2, X3, X4, X5, X6),
Table 1 Characteristics of respondents in four countries. |
| Category | Sub-category | Percentage of respondents (%) | |||
|---|---|---|---|---|---|
| Morocco | Egypt | Italy | Senegal | ||
| Educational level | Pimary education | 29.33 | 3.50 | 6.70 | 14.65 |
| Secondary education | 19.27 | 35.70 | 21.70 | 13.96 | |
| University education | 0.55 | 42.60 | 35.00 | 3.15 | |
| Socioeconomic satus | On-farm demonstration | 36.00 | 6.10 | 23.30 | 1.00 |
| Sufficient agricultural income | 16.00 | 37.40 | 75.00 | 27.80 | |
| Participation in agricultural workshops and training in GAPs | 63.30 | 17.40 | 53.30 | 2.80 | |
| Food insecurity | 64.40 | 75.20 | 0.00 | 45.40 | |
| Implementing climate-smart agricultural practices | 46.20 | 47.80 | 36.70 | 12.00 | |
| Crop insurance | 78.40 | 1.00 | 33.30 | 0.00 | |
| Perceptions of climate change | Facing climate change challenges | 100.00 | 81.00 | 71.00 | 90.00 |
| Change in temperature | 100.00 | 100.00 | 96.70 | 74.10 | |
| Increase in temperature | 100.00 | 40.90 | 96.70 | 31.50 | |
| Adopting drought-tolerant crops | 33.30 | 41.70 | 43.30 | 4.60 | |
Note: GAPs, Good Agricultural Practices. |
Table 2 History iterations of estimating the first step of the binary logistic regression (BLR) model in four countries. |
| Iteration | Morocco | Egypt | Italy | Senegal | |||||
|---|---|---|---|---|---|---|---|---|---|
| -2LL | Coefficient | -2LL | Coefficient | -2LL | Coefficient | -2LL | Coefficient | ||
| Step 0 | 1 | 81.020 | 0.680*** | 159.210 | 0.090 | 81.500 | 0.330 | 149.570 | 0.074 |
| 2 | 81.000 | 0.720*** | 159.210 | 0.090 | 81.500 | 0.340 | 149.570 | 0.074 | |
| 3 | 81.000 | 0.720*** | - | - | 81.500 | 0.340 | - | - | |
Note: -, no value; -2LL, -2 log-likelihood; ***, significance at the P<0.01 level. |
Table 3 Classification for predicting the probability of smallholder farmers adopting drought-tolerant crops in four countries. |
| Answer | Morocco | Egypt | Italy | Senegal | |||||
|---|---|---|---|---|---|---|---|---|---|
| Number of people | Correct value (%) | Number of people | Correct value (%) | Number of people | Correct value (%) | Number of people | Correct value (%) | ||
| Are you adopting drought-tolerant crops? | No | 0 | 0.00 | 50 | 0.00 | 25 | 0.00 | 52 | 0.00 |
| Yes | 43 | 100.00 | 60 | 100.00 | 35 | 100.00 | 56 | 100.00 | |
| Overall correct classification rate (%) | 61.42 | 54.54 | 58.33 | 81.85 | |||||
Table 4 Results of the BLR model for independent variables in four countries. |
| Independent variable | Morocco | Egypt | Italy | Senegal | |||||
|---|---|---|---|---|---|---|---|---|---|
| Score | Significance | Score | Significance | Score | Significance | Score | Significance | ||
| Educational level | 10.200*** | 0.001 | 47.050*** | 0.000 | 10.620*** | 0.001 | 1.850 | 0.173 | |
| Farming experience | 8.600*** | 0.003 | 40.370*** | 0.000 | 3.730* | 0.054 | 7.470*** | 0.006 | |
| Agricultural income | 10.810*** | 0.001 | 25.090*** | 0.000 | 9.970*** | 0.002 | 10.250*** | 0.001 | |
| Farm size | 11.020*** | 0.001 | 37.940*** | 0.000 | 8.190*** | 0.004 | 12.020*** | 0.001 | |
| Participation in agricultural workshops | 2.380 | 0.123 | 26.040*** | 0.000 | 10.290*** | 0.001 | 0.424 | 0.515 | |
| Training in GAPs | 13.670*** | 0.000 | 16.430*** | 0.000 | |||||
| Constant | Coefficient | 0.720*** | 0.090* | −0.340* | 0.070* | ||||
| Wald test | 7.250 | 0.220 | 0.650 | 0.150 | |||||
Note: -, no value; *, significance at the P<0.10 level; **, significance at the P<0.05 level; ***, significance at the P<0.01 level. In Italy and Senegal, participation in agricultural workshops and training in GAPs were combined as one independent variable due to data unavailability. However, in Morocco and Egypt, participation in agricultural workshops and training in GAPs were regarded as two independent variables due to data availability. |
Table 5 Relationship between dependent variable and independent variables by the BLR model in four countries. |
| Independent variable | Morocco | Egypt | Italy | Senegal | |||||
|---|---|---|---|---|---|---|---|---|---|
| Coefficient | Significance | Coefficient | Significance | Coefficient | Significance | Coefficient | Significance | ||
| Educational level | 4.769*** | 0.008 | 1.546** | 0.033 | 1.567** | 0.037 | 1.137** | 0.028 | |
| Farming experience | 3.030** | 0.026 | 2.152** | 0.031 | 1.971** | 0.029 | 1.035** | 0.027 | |
| Agricultural income | 2.462** | 0.047 | 1.360** | 0.040 | 1.901** | 0.028 | 1.520*** | 0.005 | |
| Farm size | 3.109** | 0.019 | 1.350** | 0.039 | 1.782** | 0.027 | 1.384*** | 0.003 | |
| Participation in agricultural workshops | 2.695** | 0.041 | 2.067** | 0.043 | 1.608 | 0.460 | - | - | |
| Training in GAPs | 2.467** | 0.046 | 1.859 | 0.500 | |||||
| Constant | -5.469*** | 0.001 | -4.266*** | 0.000 | -5.408*** | 0.000 | -1.859*** | 0.000 | |
| Nagelkerke’s R2 (%) | 81.20 | 71.10 | 56.40 | 32.70 | |||||
| Pseudo-R2 (%) | 69.00 | 55.00 | 40.00 | 20.00 | |||||
Note: -, no value; **, significance at the P<0.05 level; ***, significance at the P<0.01 level. In Italy and Senegal, participation in agricultural workshops and training in GAPs were combined as one independent variable due to data unavailability. However, in Morocco and Egypt, participation in agricultural workshops and training in GAPs were regarded as two independent variables due to data availability. |
Table S1 Results of estimating the second step of the binary logistic regression (BLR) model. |
| Step | Morocco | Egypt | Italy | Senegal | ||||||||
|---|---|---|---|---|---|---|---|---|---|---|---|---|
| -2LL | Cox and Snell’s R2 (%) | Nagelkerke’s R2 (%) | -2LL | Cox and Snell’s R2 (%) | Nagelkerke’s R2 (%) | -2LL | Cox and Snell’s R2 (%) | Nagelkerke’s R2 (%) | -2LL | Cox and Snell’s R 2 (%) | Nagelkerke’s R2 (%) | |
| 1 | 65.525a | 21.50 | 29.90 | 107.878a | 36.00 | 48.00 | 48.957a | 41.90 | 56.40 | 137.320a | 10.70 | 14.30 |
| 2 | 51.452b | 37.00 | 51.50 | 96.065a | 42.30 | 56.40 | - | - | - | 128.232b | 17.90 | 23.90 |
| 3 | 42.302b | 45.40 | 63.20 | 86.973a | 46.60 | 62.20 | - | - | - | 124.249b | 20.90 | 27.90 |
| 4 | 35.785c | 50.70 | 70.60 | 81.027b | 49.30 | 65.80 | - | - | - | 119.196c | 24.50 | 32.70 |
| 5 | 30.715c | 54.40 | 75.80 | 76.940b | 51.10 | 68.20 | - | - | - | - | - | - |
| 6 | 25.005c | 58.30 | 81.20 | 71.666c | 53.30 | 71.10 | - | - | - | - | - | - |
Note: -, no value; a, the estimation process concluded at iteration 5 as the adjustments to the parameter estimates fell below the threshold of 0.001; b, the estimation process concluded at iteration 6 as the adjustments to the parameter estimates fell below the threshold of 0.001; c, the estimation process concluded at iteration 7 as the adjustments to the parameter estimates fell below the threshold of 0.001. |
Table S2 Composite tests of the BLR model’s coefficients. |
| Step | Morocco | Egypt | Italy | Senegal | |||||||||
|---|---|---|---|---|---|---|---|---|---|---|---|---|---|
| χ2 | df | Significance | χ2 | df | Significance | χ2 | df | Significance | χ2 | df | Significance | ||
| 1 | Step | 15.479 | 1 | 0.000 | 51.328 | 1 | 0.000 | 32.547 | 5 | 0.000 | 12.251 | 1 | 0.000 |
| Block | 15.479 | 1 | 0.000 | 51.328 | 1 | 0.000 | 32.547 | 5 | 0.000 | 12.251 | 1 | 0.000 | |
| Model | 15.479 | 1 | 0.000 | 51.328 | 1 | 0.000 | 32.547 | 5 | 0.000 | 12.251 | 1 | 0.000 | |
| 2 | Step | 14.073 | 1 | 0.000 | 11.813 | 1 | 0.001 | - | - | - | 9.088 | 1 | 0.003 |
| Block | 29.552 | 2 | 0.000 | 63.141 | 2 | 0.000 | - | - | - | 21.340 | 2 | 0.000 | |
| Model | 29.552 | 2 | 0.000 | 63.141 | 2 | 0.000 | - | - | - | 21.340 | 2 | 0.000 | |
| 3 | Step | 9.150 | 1 | 0.002 | 9.092 | 1 | 0.003 | - | - | - | 3.983 | 1 | 0.046 |
| Block | 38.701 | 3 | 0.000 | 72.233 | 3 | 0.000 | - | - | - | 25.323 | 3 | 0.000 | |
| Model | 38.701 | 3 | 0.000 | 72.233 | 3 | 0.000 | - | - | - | 25.323 | 3 | 0.000 | |
| 4 | Step | 6.517 | 1 | 0.011 | 5.946 | 1 | 0.015 | - | - | - | 5.053 | 1 | 0.025 |
| Block | 45.219 | 4 | 0.000 | 78.180 | 4 | 0.000 | - | - | - | 30.376 | 4 | 0.000 | |
| Model | 45.219 | 4 | 0.000 | 78.180 | 4 | 0.000 | - | - | - | 30.376 | 4 | 0.000 | |
| 5 | Step | 5.070 | 1 | 0.024 | 4.086 | 1 | 0.043 | - | - | - | - | - | - |
| Block | 50.289 | 5 | 0.000 | 82.266 | 5 | 0.000 | - | - | - | - | - | - | |
| Model | 50.289 | 5 | 0.000 | 82.266 | 5 | 0.000 | - | - | - | - | - | - | |
| 6 | Step | 5.710 | 1 | 0.017 | 5.275 | 1 | 0.022 | - | - | - | - | - | - |
| Block | 55.999 | 6 | 0.000 | 87.541 | 6 | 0.000 | - | - | - | - | - | - | |
| Model | 55.999 | 6 | 0.000 | 87.541 | 6 | 0.000 | - | - | - | - | - | - | |
Note: -, no value; χ2, chi-square; df, degree of freedom. |
Table S3 Hosmer and Lemeshow test results. |
| Step | Morocco | Egypt | Italy | Senegal | ||||||||
|---|---|---|---|---|---|---|---|---|---|---|---|---|
| χ2 | df | Significance | χ2 | df | Significance | χ2 | df | Significance | χ2 | df | Significance | |
| 1 | 0.000 | 0 | 0.000 | 0.000 | 0 | 0.000 | 5.233 | 8 | 0.732 | 0.000 | 0 | 0.000 |
| 2 | 0.050 | 2 | 0.975 | 0.000 | 2 | 1.000 | - | - | - | 0.324 | 2 | 0.850 |
| 3 | 1.026 | 6 | 0.985 | 4.487 | 5 | 0.482 | - | - | - | 1.975 | 5 | 0.853 |
| 4 | 19.254 | 7 | 0.007 | 1.247 | 4 | 0.870 | - | - | - | 8.749 | 7 | 0.271 |
| 5 | 5.144 | 8 | 0.742 | 5.017 | 6 | 0.542 | - | - | - | - | - | - |
| 6 | 7.779 | 8 | 0.455 | 2.865 | 6 | 0.826 | - | - | - | - | - | - |
Note: -, no value. |
| [1] |
|
| [2] |
|
| [3] |
|
| [4] |
|
| [5] |
|
| [6] |
|
| [7] |
|
| [8] |
|
| [9] |
|
| [10] |
|
| [11] |
|
| [12] |
|
| [13] |
|
| [14] |
|
| [15] |
|
| [16] |
|
| [17] |
|
| [18] |
|
| [19] |
|
| [20] |
FAO (Food and Agriculture Organization of the United Nation), 2018. Climate-Smart Agriculture in Europe: Success Stories from Italy. [2024-08-16]. http://www.fao.org/.
|
| [21] |
|
| [22] |
|
| [23] |
|
| [24] |
|
| [25] |
|
| [26] |
|
| [27] |
|
| [28] |
|
| [29] |
HCP (High Commission for Planning), 2024. Monographie De La Province De Khouribga. [2024-08-17]. https://www.hcp.ma/region-drta/docs/Publications/Monographie%20de%20la%20province%20%20de%20Khouribga(1).pdf.
|
| [30] |
IPCC (Intergovernmental Panel on Climate Change), 2021. Climate change 2021:The Physical Science Basis. Contribution of Working Group I to the Sixth Assessment Report of the Intergovernmental Panel on Climate Change. Cambridge: Cambridge University Press.
|
| [31] |
IPCC, 2022. Climate Change 2022:Impacts, Adaptation, and Vulnerability. Contribution of Working Group II to the Sixth Assessment Report of the Intergovernmental Panel on Climate Change. Cambridge: Cambridge University Press.
|
| [32] |
|
| [33] |
|
| [34] |
|
| [35] |
|
| [36] |
|
| [37] |
|
| [38] |
|
| [39] |
|
| [40] |
|
| [41] |
|
| [42] |
|
| [43] |
|
| [44] |
|
| [45] |
|
| [46] |
|
| [47] |
|
| [48] |
|
| [49] |
|
| [50] |
|
| [51] |
|
| [52] |
|
| [53] |
|
/
| 〈 |
|
〉 |