
Factors influencing greenhouse gas emissions from road transport and energy consumption in the Extended Bangkok Metropolitan Region, Thailand
Received date: 2024-07-27
Accepted date: 2025-06-17
Online published: 2025-08-13
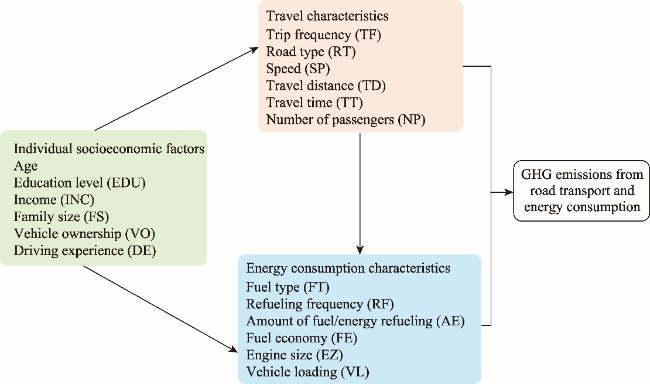
Road transport plays a crucial role in facilitating mobility and the movement of goods, particularly in the Extended Bangkok Metropolitan Region (EBMR), Thailand. This area is undergoing rapid industrialization and urbanization, resulting in significant energy consumption and greenhouse gas (GHG) emissions. This study examined the relationships among individual socioeconomic factors, travel characteristics, and energy consumption characteristics and their impacts on GHG emissions from road transport. The path analysis technique was applied to identify the key driving factors and their causal relationships. The data were collected through 1600 questionnaire surveys with road drivers in representative areas of the EBMR from December 2022 to May 2023. The results revealed that individual socioeconomic factors significantly influenced GHG emissions from road transport. Among the drivers, factors such as income, age, education, and driving experience indirectly influenced travel characteristics and energy consumption characteristics, impacting GHG emissions. Similarly, individual socioeconomic factors affected the travel characteristics of tourists and personal travelers. Driving experience was a crucial factor for public road transport and freight vehicle drivers, influencing travel characteristics and contributing to GHG emissions. These findings highlight the importance of key policy recommendations, such as promoting the adoption of electric vehicles, optimizing public transport, incentivizing low-emission tourism, and modernizing freight transport with clean technologies, to enhance efficiency, reduce emissions, and support regional sustainability. This study provides policy-makers with insights into the key factors influencing GHG emissions across different driving factors, revealing how individual socioeconomic factors impact travel characteristics and energy consumption characteristics. The findings will inform the development of targeted emission reduction strategies and sustainable transport policies.
Sutinee CHOOMANEE , Vilas NITIVATTANANON , Kampanart SILVA , Kunnawee KANITPONG , Jai Govind SINGH . Factors influencing greenhouse gas emissions from road transport and energy consumption in the Extended Bangkok Metropolitan Region, Thailand[J]. Regional Sustainability, 2025 , 6(3) : 100231 . DOI: 10.1016/j.regsus.2025.100231
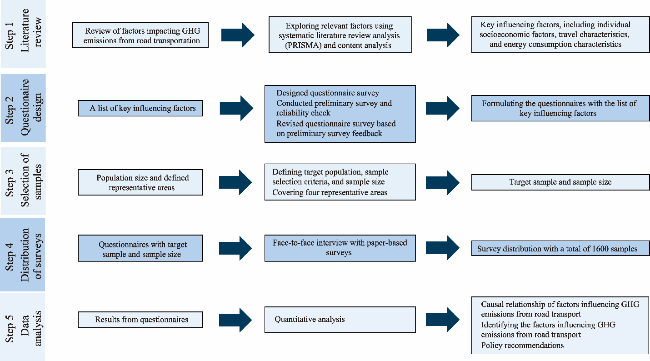
Fig. 2. Overall methodological process. PRISMA, preferred reporting items for systematic reviews and meta-analyses. |
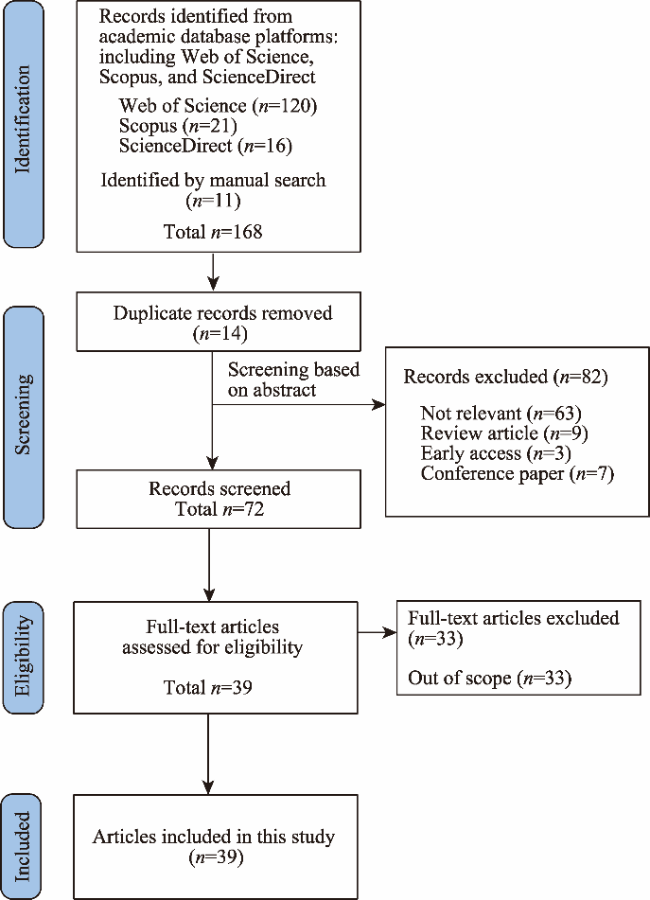
Fig. 3. Flow diagram of the systematic review process based on PRISMA approach. n is the number of articles. |
Table 1 Factors influencing greenhouse gas (GHG) emissions from road transport and energy consumption. |
| Group | Conceptual factor | Definition | Unit of conceptual factor | Measurement scale | Abbreviation | |||||
|---|---|---|---|---|---|---|---|---|---|---|
| Individual socioeconomic factors | Age | The age of individual respondents was categorized into the following groups: 18-25, 26-35, 36-45, 46-55, and >55 years. | years | 18-25 years=1; 26-35 years=2; 36-45 years=3; 46-55 years=4; and >55 years=5 | Age | |||||
| Education level | The highest level of formal education attained by individuals, categorized into levels of below high school, high school, associated degree, bachelor’s degree, and master’s degree or higher. | - | Below high school=1; high school=2; associated degree=3; bachelor’s degree=4; and master’s degree or higher=5 | EDU | ||||||
| Income | The average monthly income of individuals, categorized into ranges of below 460, 461-615, 616-765, 766-920, and >920 USD/month. | USD/month | Below 460 USD/month=1; 461-615 USD/month=2; 616-765 USD/month=3; 766-920 USD/month=4; and >920 USD/month=5 | INC | ||||||
| Family size | The number of individuals residing in the respondent’s household, categorized into ranges of 1-2, 3-4, 5-6, 7-8, and >8 persons/household. | persons/household | 1-2 persons/household=1; 3-4 persons/household=2; 5-6 persons/household=3; 7-8 persons/household=4; and >8 persons/household=5 | FS | ||||||
| Vehicle ownership | The number of vehicles owned by an individual, categorized into six groups: no vehicle, 1, 2-3, 4-5, 6-7, and >7 vehicles/person. | vehicles/person | No vehicle=0; 1 vehicle/person=1; 2-3 vehicles/person=2; 4-5 vehicles/person=3; 6-7 vehicles/person=4; and >7 vehicles/person=5 | VO | ||||||
| Driving experience | The number of years an individual has been driving, categorized into below 1, 1-3, 4-6, 7-9, and >9 a. | a | Below 1 a=1; 1-3 a=2; 4-6 a=3; 7-9 a=4; and >9 a=5 | DE | ||||||
| Travel characteristics | Trip frequency | The number of trips per week that an individual makes, categorized into 1-10, 11-20, 21-30, 31-40, and >40 trips/week. | trips/week | 1-10 trips/week=1; 11-20 trips/week=2; 21-30 trips/week=3; 31-40 trips/week=4; and >40 trips/week=5 | TF | |||||
| Travel distance | The average distance traveled per trip by an individual, categorized into below 50, 50-100, 101-150, 151-200, and >200 km/trip. | km/trip | Below 50 km/trip=1; 50-100 km/trip=2; 101-150 km/trip=3; 151-200 km/trip= 4; and >200 km/trip=5 | TD | ||||||
| Travel time | The average duration of a trip, categorized into below 1, 1-2, 3-4, 5-6, and >6 h/trip. | h/trip | Below 1 h/trip=1; 1-2 h/trip=2; 3-4 h/trip=3; 5-6 h/trip=4; and >6 h/trip=5 | TT | ||||||
| Road type | The category of road type preference that used by the individual as local highway, rural road, main highway, concession highway and motorway. | - | Local highway=1; rural road=2; main highway=3; concession highway=4; and motorway=5 | RT | ||||||
| Speed | The average speed at which a vehicle is driven, categorized into below 40, 40-60, 60-80, 80-100, and >100 km/h. | km/h | Below 40 km/h=1; 40-60 km/h=2; 60-80 km/h=3; 80-100 km/h=4; and >100 km/h=5 | SP | ||||||
| Number of passengers | The number of passengers in the vehicle per trip, categorized into 1-5, 6-10, 11-15, 16-20, and >20 persons/trip. | persons/trip | 1-5 persons/trip=1; 6-10 persons/trip=2; 11-15 persons/trip=3; 16-20 persons/trip=4; and >20 persons/trip=5 | NP | ||||||
| Energy consumption characteristics | Fuel type | The type of fuel or energy used by a vehicle, such as diesel, gasoline, liquefied petroleum gas (LPG), compressed natural gas (CNG), or electricity. | - | Diesel=1; gasohol=2; LPG=3; NGV=4; and electric=5 | FT | |||||
| Energy consumption characteristics | Refueling frequency | The number of times a vehicle is refueled per week, categorized as 1-2, 3-4, 5-6, 7-8, and >8 times/week. | times/week | 1-2 times/week=1; 3-4 times/week=2; 5-6 times/week=3; 7-8 times/week=4; and >8 times/week=5 | FR | |||||
| Amount of fuel/energy refueling | The average amount of fuel/energy refueled per refill, categorized by quantity, as less than 40, 40-60, 60-80, 80-100, and >100 L. | L, kg, or kW•h (depending on the fuel/energy type) | Less than 40 L=1; 40-60 L=2; 60-80 L=3; 80-100 L=4; and >100 L=5 | AE | ||||||
| Fuel economy | The average distance a vehicle can travel per liter of fuel or per kilowatt-hour of energy, categorized as below 8, 8-10, 11-13, 14-16, and >16 km/L. | km/L or kW•h | Below 8 km/L=1; 8-10 km/L=2; 11-13 km/L=3; 14-16 km/L=4; and >16 km/L=5 | FE | ||||||
| Engine size | The engine capacity of the vehicle, categorized as below 1000, 1000-1400, 1401-1800, 1801-2200, and >2200 cm3. | cm3 | Below 1000 cm3=1; 1000-1400 cm3=2; 1401-1800 cm3=3; 1801-2200 cm3=4; and >2200 cm3=5 | ES | ||||||
| Vehicle loading | The total weight of the vehicle when fully loaded, including cargo or passengers, categorized as below 1000, 1001−1300, 1301−1500, 1501−1800, and >1800 kg. | kg | Below 1000 kg=1; 1001-1300 kg=2; 1301-1500 kg=3; 1501-1800 kg=4; and >1800 kg=5 | VL | ||||||
Note: - represents dimensionless. Factors influencing GHG emissions from road transport and energy consumption were derived from a systematic literature review, adhering to the preferred reporting items for systematic reviews and meta-analyses (PRISMA) guidelines (Moher et al., 2009; Page et al., 2021), and developed into a questionnaire survey that collected individual-level data for the path analysis. |
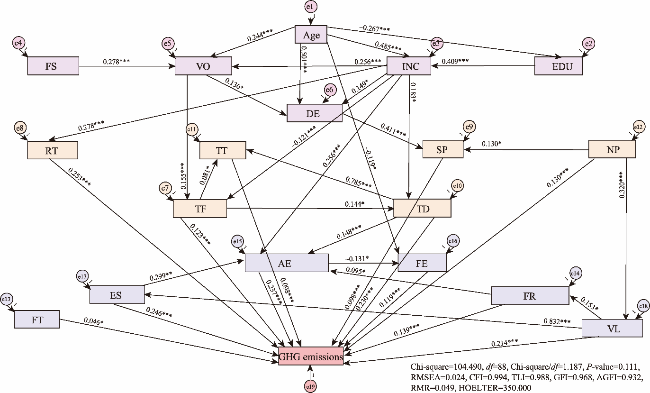
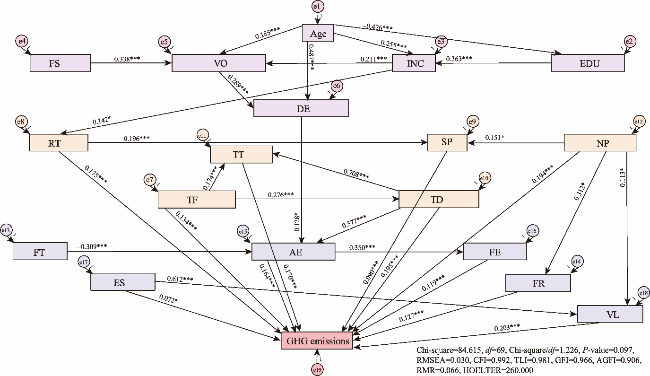
Fig. 4. Path diagram of the adjusted model for GHG emissions from road transport and energy consumption for an overview of local residents. e1-e19 represent error terms of each variable, the number 1 on the arrows represents fixed factor loading, and the values on the lines represent standardized direct effects. ***, P<0.001; *, P<0.05; df, degrees of freedom; RMSEA, root mean square error of approximation; CFI, comparative fit index; TLI, Tucker-Lewis index; GFI, goodness-of-fit index; AGFI, adjusted goodness-of-fit index; RMR, mean square residual; HOELTER, Hoelter’s Critical N. |
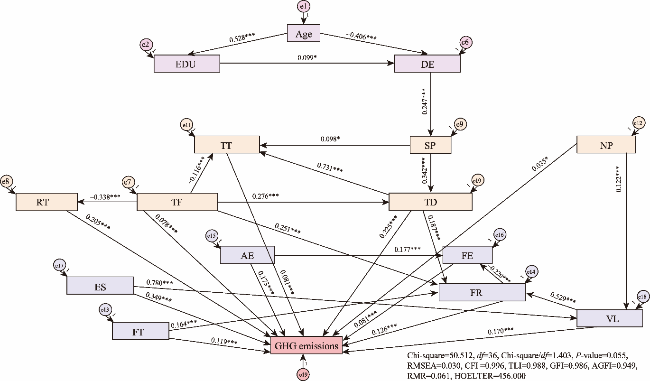
Fig. 5. Path diagram of the adjusted model for GHG emissions from road transport and energy consumption for an overview of travelers and tourists. ***, P<0.001; *, P<0.05. |
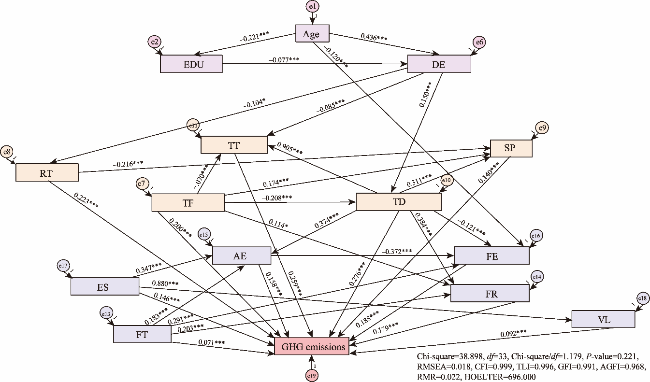
Fig. 6. Path diagram of the adjusted model for GHG emissions from road transport and energy consumption for an overview of public transport. ***, P<0.001; *, P<0.05. |
Fig. 7. Path diagram of the adjusted model for GHG emissions from road transport and energy consumption for an overview of freight transport. ***, P<0.001; *, P<0.05. |
| [1] |
|
| [2] |
|
| [3] |
|
| [4] |
|
| [5] |
|
| [6] |
|
| [7] |
Department of Alternative Energy Development and Efficiency, 2020. Thailand Alternative Energy Situation 2020. [2024-06-05]. https://anyflip.com/rbuvc/nscv/basic (in Thai).
|
| [8] |
Department of Land Transport, 2022. Annual Report 2022:Department of Land Transport. [2024-06-05].https://rapi.mot.go.th/uploads/2565_7ec4a792f7.pdf (in Thai).
|
| [9] |
|
| [10] |
|
| [11] |
|
| [12] |
|
| [13] |
|
| [14] |
|
| [15] |
|
| [16] |
|
| [17] |
|
| [18] |
|
| [19] |
IEA (International Energy Agency), 2023a. CO2 Emissions in 2022. [2024-06-07]. https://www.iea.org/reports/co2-emissions-in-2022.
|
| [20] |
IEA, 2023b. World Energy Outlook 2023. [2024-06-07]. https://www.iea.org/reports/world-energy-outlook-2023.
|
| [21] |
IPCC (International Panel on Climate Change), 2006. 2006 IPCC Guidelines for National Greenhouse Gas Inventories. [2024-06-07]. https://www.ipcc-nggip.iges.or.jp/public/2006gl/pdf/0_Overview/V0_1_Overview.pdf.
|
| [22] |
IPCC, 2022. Emissions trends and drivers. [2024-06-07]. https://www.ipcc.ch/report/ar6/wg3/chapter/chapter-2/.
|
| [23] |
|
| [24] |
|
| [25] |
|
| [26] |
|
| [27] |
|
| [28] |
|
| [29] |
|
| [30] |
|
| [31] |
|
| [32] |
|
| [33] |
|
| [34] |
|
| [35] |
|
| [36] |
OECD (Organization for Economic Co-operation and Development), 2020. Non-exhaust Particulate Emissions from Road Transport: An Ignored Environmental Policy Challenge. [2024-06-15]. https://www.oecd.org/en/publications/non-exhaust-particulate-emissions-from-road-transport_4a4dc6ca-en.html.
|
| [37] |
|
| [38] |
|
| [39] |
|
| [40] |
|
| [41] |
|
| [42] |
|
| [43] |
|
| [44] |
|
| [45] |
|
| [46] |
|
| [47] |
|
| [48] |
|
| [49] |
|
| [50] |
|
| [51] |
|
| [52] |
|
| [53] |
Thailand Greenhouse Gas Management Organization, 2022. Sectoral Greenhouse Gas Emission Data: Transportation Sector. [2024-06-20]. http://conference.tgo.or.th/download/tgo_or_th/Article/2016/Article_GHG_Emissions_TransportSector_Final.pdf (in Thai).
|
| [54] |
|
| [55] |
|
| [56] |
|
| [57] |
Wisevoter, 2024. Greenhouse Gas Emissions by Country 2023. [2024-06-05]. https://wisevoter.com/country-rankings/greenhouse-gas-emissions-by-country/.
|
| [58] |
|
| [59] |
|
| [60] |
|
| [61] |
|
| [62] |
|
| [63] |
|
| [64] |
|
| [65] |
|
| [66] |
|
| [67] |
|
/
| 〈 |
|
〉 |