
Challenges and opportunities in the energy transition of agribusiness: A deep dive into the rebound effect in Latin America
Received date: 2024-11-14
Accepted date: 2025-06-01
Online published: 2025-08-13
Growing climate change concerns have intensified the focus on agribusiness sustainability, driving an urgent energy transition to improve production efficiency and mitigate environmental harm. The complex interplay between energy efficiency and energy consumption highlights the essential role of strategic energy policies in ensuring sustainable development. This study used the Double-Log regression model with bootstrap resampling to examine the rebound effect in the energy transition of agribusiness focusing on five Latin American countries including Brazil, Argentina, Uruguay, Colombia, and Mexico based on the agricultural sector data during 2010-2022. The findings revealed that the rebound effect significantly influences energy transition, with varying degrees of impact across agricultural sectors. This study identified partial rebound effect across all five countries, with elasticity coefficient varying from 9.63% (Colombia’s coffee sector) to 89.12% (Brazil’s livestock sector). In Brazil’s sugarcane sector, non-renewable energy, agricultural employment, and irrigation efficiency were identified as key factors influencing energy consumption, while in livestock sector, energy consumption was affected by CH4 emissions, income and well-being of farmers, water consumption, and water conservation practices. In Mexico’s livestock sector, CH4 emissions, non-renewable energy, and water conservation practices were the key factors affecting energy consumption. In Argentina’s sugarcane sector, pesticides, NO2 emissions, renewable energy, and agricultural employment were the key factors affecting energy consumption, while renewable energy, income and well-being of farmers, and water consumption were the key factors affecting energy consumption in livestock sector. In Uruguay’s livestock sector, non-renewable energy, income and well-being of farmers, and irrigation efficiency were the key factors affecting energy consumption. In Colombia’ coffee sector, NO2 emissions and irrigation efficiency were identified as key factors influencing energy consumption. Finally, this study reinforces the importance of aligning energy transition with Sustainable Development Goals (SDGs), ensuring that energy efficiency gains do not inadvertently increase energy consumption or environmental degradation.
Fábio DE OLIVEIRA NEVES , Eduardo Gomes SALGADO , Mateus CURY , Jean Marcel Sousa LIRA , Breno Régis SANTOS . Challenges and opportunities in the energy transition of agribusiness: A deep dive into the rebound effect in Latin America[J]. Regional Sustainability, 2025 , 6(3) : 100225 . DOI: 10.1016/j.regsus.2025.100225
Table 1 Data source of the selected variables. |
| Independent variable | Unit | Description | Period | Database |
|---|---|---|---|---|
| CO2 emissions (CO2) | 103 kg/a | Analysis of CO2 emissions from agribusiness | 2010-2022 | World Bank (2024a) |
| CH4 emissions (CH4) | 103 kg/a | Assessing the impact of livestock waste management | 2010-2022 | World Bank (2024b) |
| NO2 emissions (NO2) | 103 kg/a | Understanding the impact of agricultural practices on greenhouse gas emissions | 2010-2022 | World Bank (2024c) |
| Non-renewable energy (EnR) | kJ/(106 kW•h) | Understanding the impact of traditional energy on the sector | 2010-2022 | World Bank (2024d) |
| Renewable energy (ER) | kJ/(106 kW•h) | Understanding the progress of the transition to cleaner and more sustainable energy | 2010-2022 | World Bank (2024e) |
| Pesticides (PS) | kg/hm2 | Understanding how improving energy efficiency reduces the application of these chemical products and its impact on the environment | 2010-2022 | World Bank (2024f) |
| Water consumption (WV) | m³ | Identification of crops with high water consumption | 2010-2022 | World Bank (2024g) |
| Water conservation practices (WC) | % | Understanding how energy transition promotes more efficient water management measures | 2010-2022 | World Bank (2024h) |
| Income and well-being of farmers (IWF) | USD or % | Evaluating the impact of energy transition of agribusiness on the income and well-being of farmers | 2010-2022 | World Bank (2024i) |
| Agricultural employment (EA) | Number of workers or % | Evaluating the impact of energy transition of agribusiness on rural employment | 2010-2022 | World Bank (2024j) |
| Irrigation efficiency (IF) | L/hm2 or % | Evaluating the effect of water resource utilization in the irrigation system | 2010-2022 | World Bank (2024k) |
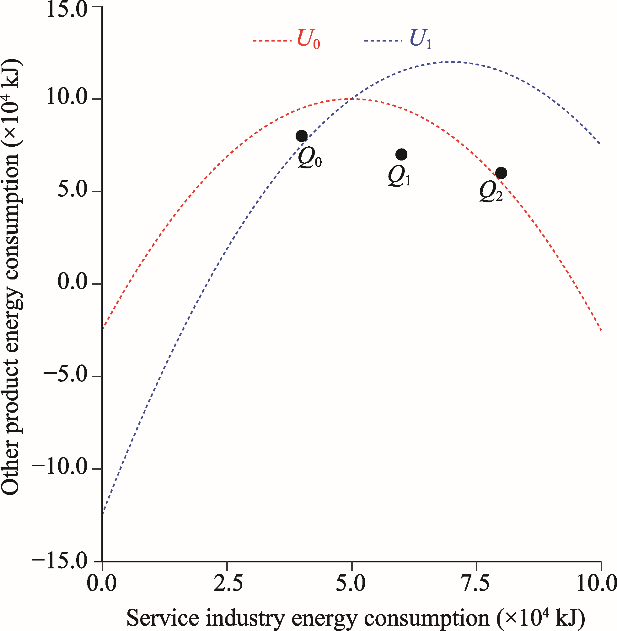
Fig. 1. Relationship between service industry energy consumption and other product energy consumption. U0, initial energy consumption curve; U1, final energy consumption curve; Q0, initial energy consumption in the service industry before the improvement of energy efficiency; Q1, expected energy consumption after the improvement of energy efficiency; Q2, actual observed energy consumption after the improvement of energy efficiency. The negative values on the Y-axis (other product energy consumption) represent theoretical outcomes of the utility curves used in the model. These values do not reflect actual negative energy consumption, which would be physically implausible. |
Table 2 Types of the rebound effect. |
| Type | Rebound effect value | Implication |
|---|---|---|
| Backfire effect | >100.00% | Unintended consequences that occur when the initial action leads to an effect contrary to expectations |
| Total rebound effect | 100.00% | Full rebound effect after an intervention |
| Partial rebound effect | 0.00%-99.00% | Partial recovery effect |
| Zero rebound effect | 0.00% | Absence of recovery effect |
| Super conservation effect | <0.00% | Exaggerated reaction that amplifies the initial effect |
Table 3 Bootstrap resampling validation results for the five countries. |
| Country | Sector | t-statistic value | P-value |
|---|---|---|---|
| Brazil | Sugarcane | 32.25 | <0.0001 |
| Livestock | 45.62 | <0.0001 | |
| Mexico | Livestock | 23.78 | <0.0001 |
| Argentina | Soybean | 12.84 | <0.0001 |
| Livestock | 29.83 | <0.0001 | |
| Colombia | Coffee | 24.84 | <0.0001 |
| Uruguay | Livestock | 67.84 | <0.0001 |
Table 4 Reliability of the Double-Log regression model for five countries. |
| Country | Sector | F-value | χ2 | AIC | VIF | R2 |
|---|---|---|---|---|---|---|
| Brazil | Sugarcane | 3.23 | 89.43 | 231.23 | 5.78 | 0.97 |
| Livestock | 4.92 | 96.24 | 134.65 | 1.83 | 0.95 | |
| Mexico | Livestock | 3.92 | 82.92 | 112.72 | 10.23 | 0.61 |
| Argentina | Soybean | 5.23 | 70.23 | 149.82 | 3.92 | 0.90 |
| Livestock | 9.46 | 81.98 | 201.52 | 6.57 | 0.86 | |
| Colombia | Coffee | 7.39 | 87.94 | 169.49 | 7.34 | 0.77 |
| Uruguay | Livestock | 7.48 | 76.94 | 201.03 | 5.67 | 0.89 |
Note: AIC, Akaike Information Criterion; VIF, Variance Inflation Factor; R2, coefficient of determination. |
Table 5 Residual diagnosis results for five countries. |
| Country | Sector | Levene test | Durbin-Watson test | Shapiro-Wilk test | Anderson-Darling test | Dixon test |
|---|---|---|---|---|---|---|
| Brazil | Sugarcane | 20.12 | 30.19 | 22.14 | 43.02 | 12.83 |
| Livestock | 9.32 | 25.81 | 72.91 | 56.13 | 34.20 | |
| Mexico | Livestock | 54.23 | 53.90 | 16.42 | 9.23 | 42.10 |
| Argentina | Soybean | 62.45 | 24.83 | 33.68 | 12.90 | 43.87 |
| Livestock | 12.32 | 12.93 | 9.54 | 32.01 | 28.35 | |
| Colombia | Coffee | 37.21 | 32.84 | 11.72 | 23.45 | 6.12 |
| Uruguay | Livestock | 8.29 | 77.01 | 13.63 | 76.56 | 31.63 |
Table 6 Elasticity coefficients of different sectors in the five countries. |
| Country | Sector | Elasticity coefficient (%) |
|---|---|---|
| Brazil | Sugarcane | 79.50 |
| Livestock | 89.12 | |
| Mexico | Livestock | 67.32 |
| Argentina | Soybean | 34.92 |
| Livestock | 72.16 | |
| Colombia | Coffee | 9.63 |
| Uruguay | Livestock | 42.59 |
Table 7 Double-Log regression model results in the sugarcane and livestock sectors of Brazil. |
| Sector | Dependent variable | Independent variable | LLC test | ADF-Fisher test | PP-Fisher test |
|---|---|---|---|---|---|
| Sugarcane | Energy consumption | ln(EnR)*** | -21.94 | 103.12 | 142.35 |
| ln(EA)*** | -24.32 | 101.56 | 276.03 | ||
| ln(IF)*** | -17.83 | 136.73 | 156.23 | ||
| Livestock | Energy consumption | ln(CH4)*** | -12.45 | 104.23 | 345.21 |
| ln(IWF)*** | -21.94 | 89.54 | 89.03 | ||
| ln(WV)*** | -13.92 | 104.83 | 194.83 | ||
| ln(WC)*** | -9.73 | 110.76 | 201.84 |
Note: LLC, Levin, Lin & Chu; ADF-Fisher test, Augmented Dickey-Fuller Fisher; PP-Fisher, Phillips-Perron Fisher. ***, P<0.01 level, indicating that these variables are statistically significant in the previous regression analysis. |
Table 8 Double-Log regression model results in the livestock sector of Mexico. |
| Sector | Dependent variable | Independent variable | LLC test | ADF-Fisher test | PP-Fisher test |
|---|---|---|---|---|---|
| Livestock | Energy consumption | ln(CH4)*** | -21.84 | 102.92 | 239.12 |
| ln(EnR)*** | -9.32 | 106.82 | 238.64 | ||
| ln(WC)*** | -11.93 | 89.03 | 110.93 |
Note: ***, P<0.01 level, indicating that these variables are statistically significant in the previous regression analysis. |
Table 9 Double-Log regression model results in the soybean and livestock of Argentina. |
| Sector | Dependent variable | Independent variable | LLC test | ADF-Fisher test | PP-Fisher test |
|---|---|---|---|---|---|
| Soybean | Energy consumption | ln(PS)*** | -34.12 | 62.29 | 329.54 |
| ln(NO2)*** | -5.32 | 80.54 | 283.53 | ||
| ln(ER)*** | -10.85 | 105.23 | 157.28 | ||
| ln(EA)*** | -8.92 | 81.94 | 245.83 | ||
| Livestock | Energy consumption | ln(ER)*** | -10.23 | 67.82 | 100.81 |
| ln(IWF)*** | -17.42 | 90.10 | 102.83 | ||
| ln(WV)*** | -9.85 | 78.02 | 219.28 |
Note: ***, P<0.01 level, indicating that these variables are statistically significant in the previous regression analysis. |
Table 10 Double-Log regression model results in the livestock sector of Uruguay. |
| Sector | Dependent variable | Independent variable | LLC test | ADF-Fisher test | PP-Fisher test |
|---|---|---|---|---|---|
| Livestock | Energy consumption | ln(EnR)*** | -11.92 | 102.83 | 117.02 |
| ln(IWF)*** | -12.05 | 98.19 | 312.83 | ||
| ln(IF)*** | -10.92 | 104.29 | 110.93 |
Note: ***, P<0.01 level, indicating that these variables are statistically significant in the previous regression analysis. |
Table 11 Double-Log regression model results in the coffee sector of Colombia. |
| Sector | Dependent variable | Independent variable | LLC test | ADF-Fisher test | PP-Fisher test |
|---|---|---|---|---|---|
| Coffee | Energy consumption | ln(NO2)*** | -5.07 | 71.29 | 173.92 |
| ln(IF)*** | -19.18 | 90.31 | 194.03 |
Note: ***, P<0.01 level, indicating that these variables are statistically significant in the previous regression analysis. |
Table 12 Analysis of variance (ANOVA) test results for the common independent variables in each country pair. |
| Country pair | Common independent variable | P-value | Country pair | Common independent variable | P-value |
|---|---|---|---|---|---|
| Brazil-Mexico | ln(IF) and ln(EnR) | 0.03 | Mexico-Uruguay | ln(IF) and ln(EnR) | 0.02 |
| Brazil-Argentina | ln(IF) and ln(EnR) | 0.02 | Mexico-Colombia | ln(IF) | 0.03 |
| Brazil-Uruguay | ln(IF) and ln(EnR) | 0.04 | Argentina-Uruguay | ln(IF) and ln(EnR) | 0.04 |
| Brazil-Colombia | ln(IF) | 0.01 | Argentina-Colombia | ln(IF) and ln(EnR) | 0.02 |
| Mexico-Argentina | ln(IF) and ln(EnR) | 0.05 | Uruguay-Colombia | ln(IF) | 0.01 |
Table 13 Bonferroni-adjusted Post Hoc test results for independent variables. |
| Independent variable | F-value | P-value | Independent variable | F-value | P-value |
|---|---|---|---|---|---|
| ln(PS) | 7.12 | <0.001 | ln(WV) | 5.34 | 0.002 |
| ln(NO2) | 8.34 | <0.001 | ln(EnR) | 8.56 | <0.001 |
| ln(ER) | 6.78 | 0.002 | ln(IF) | 7.23 | <0.001 |
| ln(EA) | 7.89 | <0.001 | ln(CH4) | 6.45 | <0.001 |
| ln(IWF) | 6.45 | 0.003 |
Table 14 Direct rebound effects of different sectors in the five countries. |
| Sector | Rebound effect (%) | |||||
|---|---|---|---|---|---|---|
| Brazil | Mexico | Argentina | Colombia | Uruguay | Total | |
| Coffee | - | - | - | 13.00 | - | 13.00 |
| Livestock | 9.00 | 16.00 | 13.00 | - | 10.00 | 48.00 |
| Soybean | - | - | 13.00 | 3.00 | - | 16.00 |
| Sugarcane | 11.00 | - | - | - | - | 11.00 |
Note: - means no rebound effect. |
| [1] |
Agri-Food and Fisheries Information Service, 2024. Historical Record of Sowing and Harvest Progress. [2024-09-30].https://www.gob.mx/siap/acciones-y-programas/produccion-agricola-33119.
|
| [2] |
|
| [3] |
|
| [4] |
|
| [5] |
|
| [6] |
|
| [7] |
|
| [8] |
|
| [9] |
Brazilian Institute of Geography and Statistics, 2024. Dataset. [2024-09-20].https://Dados.Gov.Br/Dados/Organizacoes/Visualizar/Instituto-Brasileiro-de-Geografia-e-Estatistica-Ibge.
|
| [10] |
|
| [11] |
|
| [12] |
|
| [13] |
|
| [14] |
|
| [15] |
|
| [16] |
|
| [17] |
|
| [18] |
|
| [19] |
|
| [20] |
Economic Commission for Latin America and the Caribbean, 2024. Data and Statistics. [2024-09-21]. https://www.cepal.org/en.
|
| [21] |
|
| [22] |
|
| [23] |
|
| [24] |
|
| [25] |
|
| [26] |
|
| [27] |
|
| [28] |
|
| [29] |
|
| [30] |
|
| [31] |
|
| [32] |
|
| [33] |
|
| [34] |
|
| [35] |
|
| [36] |
|
| [37] |
|
| [38] |
IPCC
|
| [39] |
|
| [40] |
|
| [41] |
|
| [42] |
|
| [43] |
|
| [44] |
|
| [45] |
|
| [46] |
|
| [47] |
|
| [48] |
|
| [49] |
|
| [50] |
|
| [51] |
Ministry of Agriculture, Livestock, and Fisheries, 2024. Open Data. [2024-09-20].https://datos.magyp.gob.ar/sataset.
|
| [52] |
|
| [53] |
|
| [54] |
National Federation of Coffee Growers, 2024. Indicators. [2024-09-25].https://federaciondecafeteros.org/wp/federation/about-us/?lang=en.
|
| [55] |
National Meat Institute of Uruguay, 2024. Data. [2024-09-22].https://www.inac.uy/.
|
| [56] |
National Supply Company, 2024. Publications. [2024-09-20].https://www.conab.gov.br/institucional/publicacoes.
|
| [57] |
|
| [58] |
|
| [59] |
|
| [60] |
|
| [61] |
|
| [62] |
|
| [63] |
|
| [64] |
|
| [65] |
|
| [66] |
|
| [67] |
|
| [68] |
|
| [69] |
|
| [70] |
|
| [71] |
|
| [72] |
|
| [73] |
|
| [74] |
|
| [75] |
|
| [76] |
|
| [77] |
|
| [78] |
|
| [79] |
|
| [80] |
|
| [81] |
|
| [82] |
|
| [83] |
|
| [84] |
|
| [85] |
|
| [86] |
|
| [87] |
|
| [88] |
|
| [89] |
|
/
| 〈 |
|
〉 |