Full Length Article

Relationship between drought and soil erosion based on the normalized differential water index (NDWI) and revised universal soil loss equation (RUSLE) model

  • Muhammad RENDANA a, b ,
  • Wan Mohd Razi IDRIS , c, * ,
  • Febrinasti ALIA d ,
  • Supli Effendi RAHIM e ,
  • Muhammad YAMIN f ,
  • Muhammad IZZUDIN g
Expand
  • aDepartment of Chemical Engineering, Faculty of Engineering, Universitas Sriwijaya, Indralaya, 30662, Indonesia
  • bMaster Program of Environmental Management, Graduate School, Universitas Sriwijaya, Palembang, 30139, Indonesia
  • cDepartment of Earth Sciences and Environment, Faculty of Science and Technology, Universiti Kebangsaan Malaysia, Bangi, 43600, Malaysia
  • dDepartment of Civil Engineering, Faculty of Engineering, Universitas Sriwijaya, Indralaya, 30662, Indonesia
  • eMaster Program of Agricultural Sciences, Graduate Study Program, Universitas Muhammadiyah Palembang, Palembang, 30263, Indonesia
  • fDepartment of Agribusiness, Faculty of Agriculture, Universitas Sriwijaya, Indralaya, 30662, Indonesia
  • gDepartment of Sociology, Faculty of Social and Political Sciences, Universitas Sriwijaya, Indralaya, 30662, Indonesia
*E-mail address: (Wan Mohd Razi IDRIS).

Received date: 2024-05-29

  Revised date: 2024-10-02

  Accepted date: 2024-11-22

  Online published: 2025-08-13

Abstract

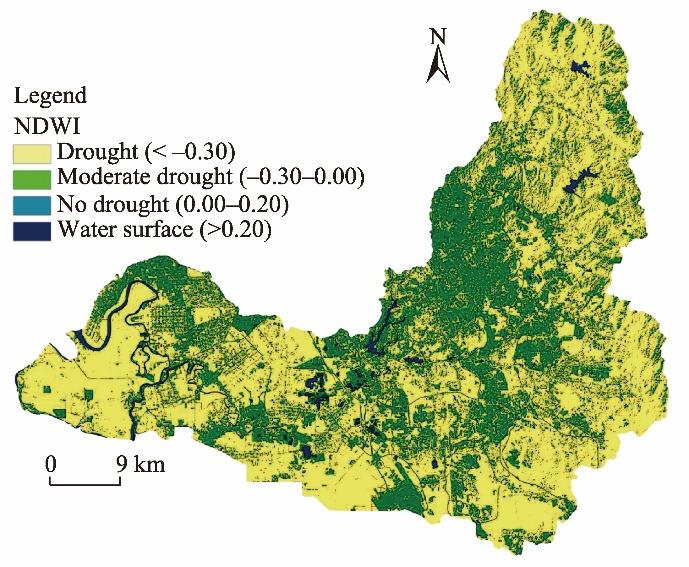
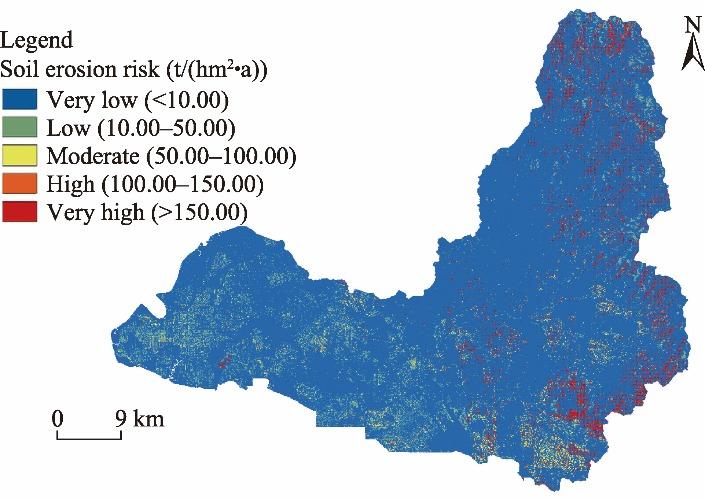
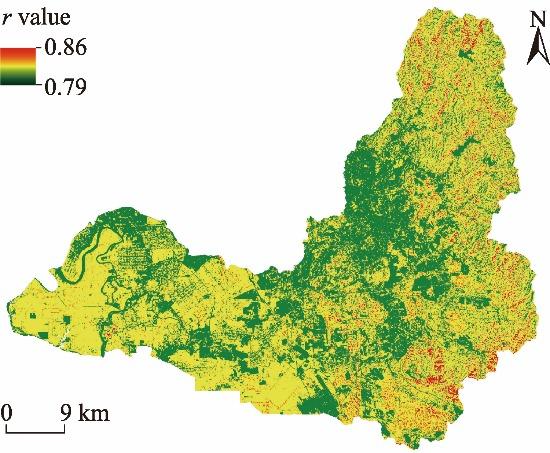
The Langat River Basin in Malaysia is vulnerable to soil erosion risks because of its exposure to intensive land use activities and its topography, which primarily consists of steep slopes and mountainous areas. Furthermore, climate change frequently exposes this basin to drought, which negatively affects soil and water conservation. However, recent studies have rarely shown how soil reacts to drought, such as soil erosion. Therefore, the purpose of this study is to evaluate the relationship between drought and soil erosion in the Langat River Basin. We analyzed drought indices using Landsat 8 satellite images in November 2021, and created the normalized differential water index (NDWI) via Landsat 8 data to produce a drought map. We used the revised universal soil loss equation (RUSLE) model to predict soil erosion. We verified an association between the NDWI and soil erosion data using a correlation analysis. The results revealed that the southern and northern regions of the study area experienced drought events. We predicted an average annual soil erosion of approximately 58.11 t/(hm2•a). Analysis of the association between the NDWI and soil erosion revealed a strong positive correlation, with a Pearson correlation coefficient of 0.86. We assumed that the slope length and steepness factor was the primary contributor to soil erosion in the study area. As a result, these findings can help authorities plan effective measures to reduce the impacts of drought and soil erosion in the future.

Cite this article

Muhammad RENDANA , Wan Mohd Razi IDRIS , Febrinasti ALIA , Supli Effendi RAHIM , Muhammad YAMIN , Muhammad IZZUDIN . Relationship between drought and soil erosion based on the normalized differential water index (NDWI) and revised universal soil loss equation (RUSLE) model[J]. Regional Sustainability, 2024 , 5(4) : 100183 . DOI: 10.1016/j.regsus.2024.100183

1. Introduction

The association between drought and soil erosion is prominent when estimating future soil erosion hazards in a certain area. Runoff events and wind aggravate soil erosion rates in drought-susceptible regions. Furthermore, dry soils tend to produce fractures that decrease the soil moisture content. The erodibility of soil increases with increasing drought duration and decreases after large amounts of rainfall and high percentage of vegetation cover are received (Masroor et al., 2022). The temperature patterns and the lack of rainfall during drought periods influence the soil’s organic matter capabilities, which reduces the cohesion properties among soil particles (Kane et al., 2021). Alterations in soil grain composition influence the water holding capacity of soils, increasing their susceptibility to drought (Herawati et al., 2021). Moreover, drought can affect plant growth and generate insufficient canopy cover (Abdelaal et al., 2021). An increase in soil temperature hinders the aggregation process, increasing soil erodibility during longstanding drought periods (Qiu et al., 2021). On the other hand, rainfall increases soil organic matter aggregation and mitigates soil erodibility. On a global scale, drought is a complicated and recurring event and an unmeasurable natural disaster (Atiem et al., 2022). Intense drought can hinder plant growth, which can lead to soil deterioration (Vicente-Serrano et al., 2020).
A previous study found that water contamination from drought threats is a major problem (Muñoz et al., 2020). Reports indicate that drought is the most prevalent problem resulting from climate change (Wu et al., 2023). We assume that an increase in temperature will lead to an increase in drought frequency due to increased transpiration and evaporation. In the agricultural sector, severe drought can create significant costs and reduce crop yields (Hendrawan et al., 2023). In Southeast Asia, this phenomenon has affected approximately 6.6×10⁷ people in the past three decades (Alisjahbana and Hoi, 2021). Alterations in rainfall trends and hydrological cycles are significant factors affecting drought, resulting in land degradation (Paredes-Trejo et al., 2023). Changes in the Malaysian monsoon pattern have a significant impact on drought occurrence. Both unsustainable farming practices and excessive groundwater use in Malaysia contribute to drought.
A combination of indices, such as meteorological factors, evapotranspiration, and soil moisture content, quantitatively explains drought intensities (Zhang et al., 2021). Numerous researchers have established different drought detection measures, and drought categories and their variations are frequently studied (Mullapudi et al., 2023). The drought index (Shah and Mishra, 2020), the standardized precipitation evapotranspiration index (Hussain et al., 2023), the multiscalar streamflow drought index (Karbasi et al., 2022), and the self-calibrating effective drought index (Park et al., 2022) are some of the important indices that are used. Numerous studies (Liu et al., 2021; Gorgij et al., 2022) used the standardized precipitation index (SPI) to identify drought situations. Cui et al. (2021) suggested the use of a standardized terrestrial water storage index to evaluate drought situations. Inadequate selection criteria and the actual measurements constrain the evaluation of drought variability (Masroor et al., 2022). Recently, researchers have used geospatial technology to analyze drought occurrence. The long-range time series of data and large area coverage allow the users to assess the duration and intensity of drought in a certain area. The normalized difference water index (NDWI) has been shown in earlier study to be useful for assessing and monitoring drought in real time (Bhaga et al., 2021).
Soil erosion leads to a decline in soil quality and deteriorates aquatic ecosystems via sedimentation and eutrophication. In many areas around the world, soil erosion and land deterioration are the main hazards. Soil erosion intensities have increased as a result of increased flooding, landslides, and drought events (Chinnasamy et al., 2020). Researchers have employed various methods to predict soil erosion, such as the pan-European soil erosion risk evaluation model (Berberoglu et al., 2020), the universal soil loss equation (Selmy et al., 2021), the fuzzy logic and analytical hierarchy process model (Sinshaw et al., 2021), and the revised universal soil loss equation (RUSLE) model (Behera et al., 2023). Advanced remote sensing techniques have made it possible to simulate soil erosion effectively, and have made it easier to calculate the spatial variation in soil erosion (Rendana et al., 2023). It has proven appropriate for various landscapes and geographical areas (Tsegaye and Bharti, 2021).
High rainfall sustains the steep slopes and mountains that encircle the Langat River Basin, Malaysia. Various land use types and urbanization activities have degraded the central part of the basin. Furthermore, the downstream areas are predominantly oil palm plantations. These factors have exposed the Langat River Basin to a significant risk of soil erosion. Recently, the Langat River Basin has followed the United Nations Educational, Scientific and Cultural Organization (UNESCO) program to successfully implement systematic basin management (Elfithri et al., 2018).
According to previous studies, less than 15.00% of the Langat River Basin has a high risk of soil erosion (Islam et al., 2020; Yusof et al., 2021). Although none of these studies evaluated how drought contributes to the soil erosion rate, the Langat River Basin in Malaysia does experience frequent drought. The agricultural land is the most common land use in the basin and can contribute to drought. Thus, in this region, it is important to analyze the association between drought and soil erosion. Previous studies have analyzed soil erosion in the Langat River Basin by applying a variety of techniques (Abidin et al., 2017; Islam et al., 2020; Yusof et al., 2021; Haque et al., 2022). However, the link between drought and soil erosion is still understudied. Since agriculture is the predominant land use, and planted crops are highly dependent on soil fertility, it is crucial to investigate the connection between drought and soil erosion within the basin. Previous studies mostly focused on the prediction of soil erosion or drought (Yu et al., 2021; Masroor et al., 2022). Moreover, the association between drought and soil erosion has still not been well investigated. Felde et al. (2021) reported that soil microaggregates can separate easily under air-dry conditions. We hypothesize that drought events could contribute to soil erosion since they affect soil erodibility due to dry soil particle conditions. The dry soil particles tend to sustain dispersion because the soil particle bonding is weak. Hence, this study has a positive impact on water quality and soil conservation management, especially in the Langat River Basin.

2. Materials and methods

2.1. Study area

The Langat River Basin (02°45′-03°15′N, 101°15′-102°00′E) surrounds Selangor State, Malaysia. The basin covers a total area of approximately 2287 km2 and has a population of over 6.0×10⁶ people. With an average annual precipitation of 3097 mm and an annual average temperature of 32°C, this basin has a tropical rainforest climate. June is the warmest month, with a maximum temperature of 34°C, whereas November is the chilliest month, with a minimum temperature of 28°C. Most of the precipitation occurs during the northeast monsoon. Acrisols and cambisols are the dominant soil types. Drought conditions persist in some areas of the basin, particularly during the dry season. Poor soil permeability in the basin affects groundwater replenishment. Agriculture constitutes the main land use within the basin (Rendana et al., 2022). Rainfall and adjacent rivers provide irrigation for crop planting. The basin has several primary tributaries, such as the Lui River, Beranang River, and Semenyih River (Yusof et al., 2021). Because of the high amount of runoff and steep topography, rills and gullies are common types of erosion in the basin.

2.2. Data collection and methodology

We used various types of data to estimate soil erosion and drought (Table 1). We evaluated a drought event via Landsat 8 images and remote sensing indices. The Landsat 8 OLI images were obtained from the United States Geological Survey (USGS) Earth Explorer portal (https://www.usgs.gov/). We selected November 2021, the driest month of the dry season, to investigate drought in the study area. Therefore, we collected rainfall, elevation, soil type, slope, and land cover data for soil erosion estimation in this study during the dry season, as shown in Table 1. The NDWI was employed to produce a drought map, and a RUSLE model was used to produce a soil erosion map.
Table 1 Data used for estimating soil erosion and drought in this study.
Data type Raw data Time Source of data Preprocessing step
Rainfall Climate parameter November 2021 Department of Meteorology, Malaysia Using Excel to tab delimited format
conversion
Elevation SRTM DEM November 2021 USGS Earth Explorer Reprojected coordinate system and clipping
the AOI
Soil type Soil classification November 2021 Department of Irrigation and Drainage, Malaysia Attribute table entry for soil characteristic
Slope SRTM DEM November 2021 USGS Earth Explorer Reprojected coordinate system and clipping
the AOI
NDWI Landsat 8 OLI November 2021 USGS Earth Explorer Atmospheric correction and clipping the AOI
Land cover Landsat 8 OLI November 2021 USGS Earth Explorer Atmospheric correction and clipping the AOI

Note: SRTM DEM, Shuttle Radar Topography Mission Digital Elevation Model; NDWI, normalized difference water index; USGS, Unites States Geological Survey; AOI, area of interest.

2.2.1. Normalized difference water index (NDWI)

Satellite imagery uses the NDWI to identify open-water features. This approach more clearly highlights the water features on the Earth’s surface. McFeeters (1996) first created the NDWI. This approach is used in a previous study to detect changes in water surface (Ali et al., 2019). We calculated this index via the near infrared (NIR) and green bands from satellite images. The green band enhances the specific reflectance of the water surface. The NIR band maximizes the reflectance of the soil and vegetation surfaces while reducing the reflectance of water surfaces. A relatively high NDWI value near 1.00 indicates a high amount of water, whereas a relatively low value (-1.00) is a sign of drought conditions. Rokni et al. (2014) investigated a number of different indices and reported that the NDWI is better in identifying water features than the normalized difference moisture index (NDMI), modified normalized difference water index (MNDWI), automated water extraction index (AWEI), and water ratio index (Wilson and Sader, 2002; Shen and Li, 2010). A recent study revealed that the NDWI shows favorable sensitivity to drought conditions, providing better insights into water availability and plant health, which are prominent concerns in the forestry and agriculture sectors (Patil et al., 2024). Therefore, we chose the NDWI as a parameter for identifying drought conditions in this study. We calculated the NDWI via the Landsat 8 band, as detailed below:
$\text{NDWI=(NIR}-\text{Green)/(NIR+Green)}$,
where NIR is the near infrared band (μm); and Green is the green band (μm). We classified the NDWI values into four categories, including drought (NDWI< -0.30), moderate drought (-0.30≤NDWI<0.00), no drought (0.00≤NDWI≤0.20), and water surface (NDWI>0.20). The drought-susceptible map in this study was confirmed via the drought hazard map of Peninsular Malaysia produced by the Department of Agriculture of Malaysia.

2.2.2. Soil erosion prediction

We used the RUSLE model to examine soil erosion in the Langat River Basin. The model has five basic components, including rainfall erosivity, vegetation cover, slope steepness and length, soil erodibility, and support practices. Conventionally, we conducted soil erosion analyses via field measurements, which can be challenging because of resource availability and rough terrain. The first model used to estimate soil erosion is the universal soil loss equation (USLE) model (Girmay et al., 2020). However, it typically targets small regions. The RUSLE model remains the same component of the USLE model. The ultimate purpose of the RUSLE is to estimate the magnitude of annual soil erosion in both the agricultural and nonagricultural areas (Romdania and Herison, 2024). The advantage of the RUSLE model is that it provides a high spatial variation of soil erosion compared with other models (Yusof et al., 2021). Therefore, we chose the RUSLE model to estimate and map soil erosion in the study area. The integration of the RUSLE model with remote sensing and geographical information system (GIS), a recent breakthrough, offers the potential to predict soil erosion on a cell-by-cell basis (Rendana et al., 2016; Abdelsamie et al., 2023). The calculation of this model is as follows (Renard et al., 1997):
$\text{Soil erosion=}R\times K\times LS\times C\times P$,
where R is the rainfall erosivity factor (MJ•mm/(hm2•h•a)); K is the soil erodibility factor (t•hm2•h/(hm2•MJ•mm)); LS is the slope length and steepness factor; P is the conservation support practice factor; and C is the land cover management factor. In this study, soil erosion risk was classified into five levels, including very low (<10.00 t/(hm2•a)), low (10.00-50.00 t/(hm2•a)), moderate (50.00-100.00 t/(hm2•a)), high (100.00-150.00 t/(hm2•a)), and very high (>150.00 t/(hm2•a)). Rainfall erosivity indicates the effect of rainfall on the soil surface (Serio et al., 2019). Rainfall impacts the soil surface and converts kinetic energy into potential energy, causing erosion. As a result, rainfall erosivity increases as the rainfall intensity increases (Baiamonte et al., 2019). In this study, we calculated rainfall erosivity according to Roose (1977) and Morgan (2005). Runoff intensity closely correlates with soil erodibility; this may be due to the interaction among soils’ cohesive properties, texture, organic matter, and drainage. The resistance of soil to detachment and transport processes is referred to as erodibility. We used the data of K factor from the Department of Irrigation and Drainage of Malaysia in this study because of the absence of in situ soil data. We created a soil erodibility map by selecting appropriate value of K factor for various soil series. Table 2 lists the value of K factor for various soil series in the study area.
Table 2 Value of soil erodibility (K) factor for various soil series in the study area.
Soil series Soil classification Value of K factor (t•hm2•h/(hm2•MJ•mm)) Soil series Soil classification Value of K factor (t•hm2•h/(hm2•MJ•mm))
Serdang-Kedah Acrisols 0.036 Selangor-Kangkong Dystric cambisols 0.051
Serdang-Bungor-Munchong Acrisols 0.038 Telemong-Akob-Local alluvium Dystric cambisols 0.051
Munchong-Serembang Plinthic acrisols 0.039 Peat Histosols 0.040
Prang Ferrasols 0.040 Urban land 0.042
Rengam-Jerangau Acrisols 0.043 Steep land 0.042
Gajah Mati-Munchong-Malacca Ferric acrisols 0.051 Mined land 0.042
Kranji Thionic gleysols 0.051

Note: Soil series and the value of K factor are from DID (2011) and soil classification is from FAO (1979).

We calculated the value of LS factor via Shuttle Radar Topography Mission (SRTM) data to generate a digital elevation model (DEM). The SRTM data can be freely obtained from the USGS Earth Explorer portal (https://www.usgs.gov/). The slope length describes the space in which deposition occurs. Compared with the slope length, the steep slope is a more crucial factor for soil erosion. The only way to determine the slope length in a river or drain with a modest slope gradient is the distance between the source flow and runoff point (Masroor et al., 2022). As the slope length increases, soil erosion per unit area typically increases as well (Pham et al., 2018). The LS factor was determined via the following formula (Wischmeier, 1959):
$LS\text{=}{{\left( \frac{L}{22.13} \right)}^{m}}\times \left( 0.065+0.046S+0.0065{{S}^{2}} \right)$,
where L is the slope length (m); m is a coefficient (m is 0.6 when the slope is greater than 12%); and S is the slope (%). In a GIS environment, slope length was obtained by multiplying the flow accumulation by the pixel size. Flow accumulation and slope layers were calculated via raster calculator tools in ArcGIS software (version 10.3, Esri, California, the USA). By calculating the difference in soil erosion between vegetated regions and bare areas, researchers can determine the C factor (Obiahu and Elias, 2020). These findings suggest that appropriate crop management practices can be used to reduce soil erosion. Many researchers have examined the C factor based on land use or land cover categories (Kogo et al., 2020). The C factor, which is based on land cover types, assists in analyzing the alteration of natural soil erosion across years. Consequently, the Landsat 8 images were used to create the land use or land cover map via supervised classification analysis. The value of C factor was then set from 0.000 to 1.000 via ArcGIS software (Table 3).
Table 3 Value of land cover management (C) factor for diverse land cover types in the study area.
Land cover type Value of C factor Land cover type Value of C factor Land cover type Value of C factor
Water body 0.0000 Settlement 0.0020 Agricultural land 0.2800
Vegetation 0.0008 Bare land 0.1300

Note: The data are from Pandey et al. (2007).

Runoff and sediment yield events are controlled by distinct land support practices (Bekin et al., 2021). The P factor and C factor are critical factors in reducing soil erosion and runoff. The degree of soil erosion is affected by conservation support practices conducted on a certain area. Strip cropping, terrace cultivation, and contour farming activities are effective ways to mitigate soil erosion. Table 4 shows the value of P factor at different slopes. The soil erosion hazard map from the Department of Agriculture of Malaysia was used to draw the anticipated soil erosion map. The soil erosion values for both maps were extracted and analyzed via a correlation analysis. Similarly, the link between the NDWI and soil erosion was further confirmed via the same method. The classification of Pearson correlation coefficient (r) used in this study is shown in Table 5.
Table 4 Value of conservation support practice (P) factor at different slopes in the study area.
Slope (%) Value of P factor Slope (%) Value of P factor Slope (%) Value of P factor
<7.0 0.27 11.4-17.6 0.40 >26.8 0.50
7.0-11.3 0.30 17.7-26.8 0.45

Note: The data are from Shin (1999).

Table 5 Classification of Pearson correlation coefficient (r).
r Level of correlation r Level of correlation
0.00<r≤0.19 Very low correlation 0.60<r≤0.79 High correlation
0.20<r≤0.39 Low correlation 0.80<r≤1.00 Very high correlation
0.40<r≤0.59 Moderate correlation

Note: The data are from Selvanathan et al. (2020).

3. Results and discussion

3.1. Drought severity

We applied the NDWI to identify the presence of drought in the study area. Areas with a high NDWI value indicated high amount of water, whereas a low NDVI value, mostly less than zero, indicated drought (Fig. 1). Water bodies could be distinguished by a negative NDWI value. During the study period, the majority of the study area experienced drought. Table 6 shows that 63.7% of the study area experienced drought, whereas 35.2% experienced moderate drought. The spatial variation in drought showed that the basin has sustained severe drought. In this study, the NDWI values ranged from -0.50 to 0.30, with a mean of -0.30. The basin clearly presented low NDWI values. The open or slight canopy area and the topography of the basin might be responsible for this. The high soil moisture content and high precipitation near rivers resulted in high NDWI values.
Fig. 1. Spatial distribution of the normalized difference water index (NDWI) in the study area.
Table 6 Area and area percentage of each drought category in the study area.
Drought category Area (hm2) Area percentage (%) Drought category Area (hm2) Area percentage (%)
Drought 145,310.30 63.4 No drought 3452.31 1.5
Moderate drought 80,289.81 35.1 Water surface 6.57 0.0

3.2. Soil erosion

The tropical environment conveyed abundant rainfall to the study area, yet land cover and soil features led to drought vulnerability. The value of R factor varied from 17,441.00 to 19,300.00 MJ•mm/(hm2•h•a), with a mean value of 18,601.40 MJ•mm/(hm2•h•a) (Fig. 2). The value of K factor ranged from 0.036 to 0.051 t•hm2•h/(hm2•MJ•mm). The K factor generally relies on the chemical and physical properties of soils. Soil erosion is closely associated with soil erosion vulnerability (Alewell et al., 2019). The LS factor is a primary contributor to soil erosion. We calculated this factor via the flow accumulation and slope values. Strong slope gradients may distinguish the northern and eastern regions of the study area. The western regions of the study area had slope values near 1.0%, whereas the northern area had slope values greater than 45.0%, according to the analysis of LS factor. The slope values increased from northeast to west. Overall, the LS factor significantly influenced soil erosion in the study area. The change in land use and land cover had a significant effect on the C factor and total soil erosion. The value of C factor ranged from 0.0000 to 0.2800 (Fig. 2). The low value of C factor in the northern regions indicated a dense green area, while a high value of C factor was found in the southern and western regions, primarily because the majority of the areas were open lands. While open areas are vulnerable to rainfall, vegetation helps reduce their impact on the land surface. Therefore, runoff processes commonly cause high soil erosion in open areas. Furthermore, the value of P factor varied from 0.27 to 0.50 (Fig. 2). The P factor is associated with conservation practices; low values suggest the use of soil conservation techniques, whereas high values denote the absence of any management strategies to control soil erosion. Therefore, a high value of P factor indicated high soil erosion, and vice versa. This result was in line with the study conducted by Chen et al. (2018).
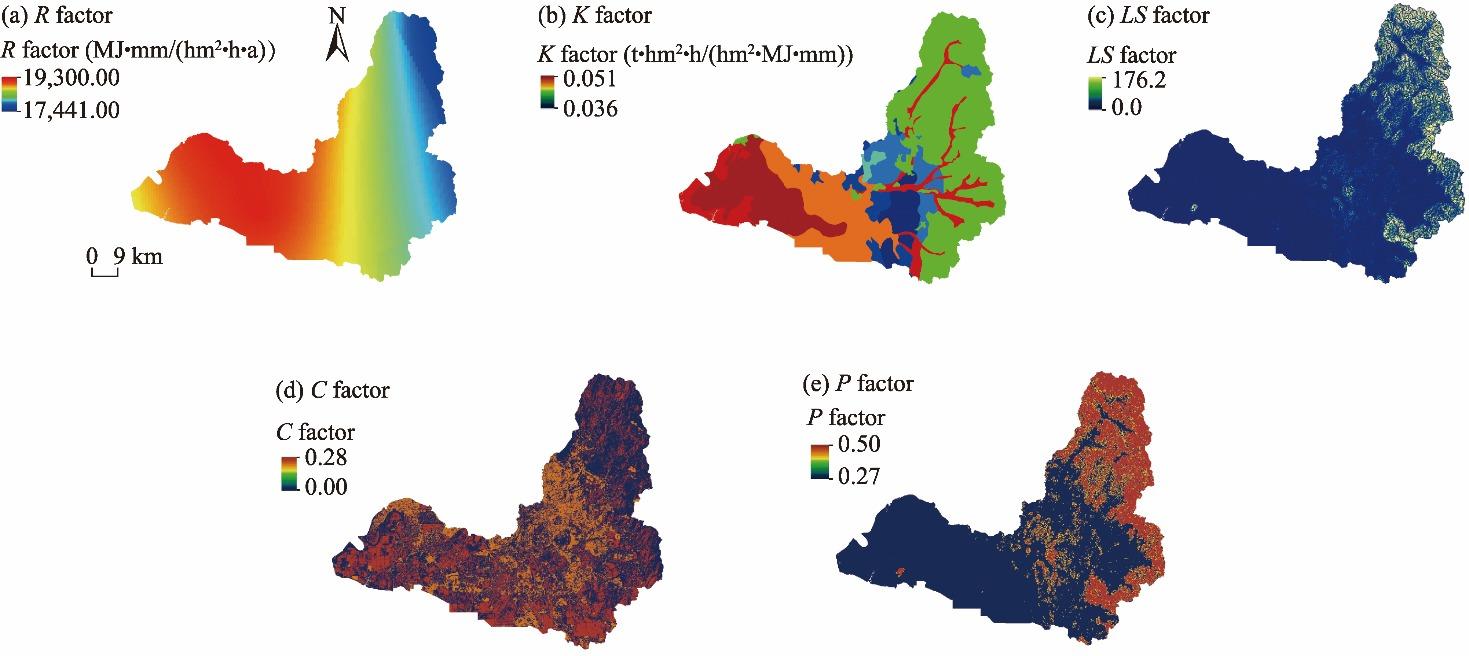
Fig. 2. Spatial distribution of soil erosion factors in the study area. (a), rainfall erosivity (R) factor; (b), soil erodibility (K) factor; (c), slope length and steepness (LS) factor; (d), land cover management (C) factor; (e), conservation support practice (P) factor.
We drew all the RUSLE factor maps to estimate annual soil erosion in the study area. We used five classes—very low, low, moderate, high, and very high soil erosion—to categorize annual soil erosion (Table 7). The average of soil erosion was 58.11 t/(hm2•a), indicating a moderate erosion class. The northern and southern regions (Fig. 3) had very high erosion classes, characterized by a medium value of K factor and a high value of LS factor. We conducted a correlation analysis between the predicted soil erosion map and a referenced soil erosion map from the Department of Agriculture of Malaysia to assess the accuracy of this study. We obtained a correlation coefficient value of 0.80, indicating excellent accuracy for this analysis.
Table 7 Area and area percentage of each soil erosion class in the study area.
Soil erosion class Area (hm2) Area percentage (%) Soil erosion class Area (hm2) Area percentage (%)
Very low 198,463.60 87.0 High 1331.01 0.6
Low 15,335.73 6.7 Very high 8823.15 3.9
Moderate 4243.68 1.9
Fig. 3. Spatial distribution of soil erosion risk in the study area.

3.3. Association between drought and soil erosion

We used a correlation analysis to establish a link between the NDWI and soil erosion. Areas with r value of 0.86 demonstrated a strong correlation between drought and soil erosion. However, the spatial variation in r values also revealed that several regions had a moderately positive correlation. High-elevation areas presented high soil erosion and severe drought, whereas flat areas presented low soil erosion and moderate or no drought. This event contributed to the reduction in r values. There was significant diversity in the study area, as evidenced by the spatial variation in r values, which ranged from 0.79 to 0.86 (Fig. 4). The western regions of the study area exhibited a moderate correlation, whereas the northern, eastern, and southern regions presented high correlations. Moderate to severe soil erosion and drought were present in those locations; the majority of the locations, especially the northern and southeastern regions, also presented low to moderate precipitation.
Fig. 4. Spatial correlation between drought and soil erosion. r is the Pearson correlation coefficient.
Climate, topography, vegetation cover, soil erodibility, conservation measures, slope length, and slope steepness influence soil erosion in the Langat River Basin. Owing to the steep slope and different soil types, the northern regions of the study area experienced the most soil erosion. This result was in line with Masroor et al. (2022). The acrisols and cambisols were more susceptible to heavy precipitation, which resulted in splash erosion. Precipitation, the most significant factor, was closely correlated with soil erosion events in the low-lying areas of the basin. Heavy rainfall contributed to runoff incidents, causing the soil structures to break down easily. Moreover, highland areas with undulating land became susceptible to soil erosion during drought. Climate change, which may increase the amount and intensity of rainfall, has caused sheet and rift erosion in the study area. The soil of the study area swept out from the banks of the Langat River became a transport drain.
Moreover, drought could prevent soil formation due to a lack of soil moisture. Based on the results of this study, soil erosion was more common in regions with large areas of bare land. The study area experienced moderate-to-severe drought. In general, high temperature during the dry season exacerbated the drought situation in the study area. In addition, agricultural practices, such as grazing and ploughing, have influenced soil erosion in the study area. We observed a low degree of soil erosion in the central and western regions. These areas are characterized by low slopes, thionic gleysol and histosol soil types, moderate precipitation, and high conservation practices. Histosol and gleysol soils have strong structural connectivity and high amount of clay, making them more resilient to soil erosion. This was consistent with a study conducted by Borrelli and Panagos (2020). A previous study showed that the mean value of soil erosion in the Langat River Basin was approximately 61.00 t/(hm2•a) (Yusof et al., 2021), which was slightly lower than the value obtained in this study (67.00 t/(hm2•a)). We also found a similar result, with the northern regions of the basin having the highest soil erosion risk. The study of Yusof et al. (2021) also assumed that the LS factor and R factor are important drivers of the high amount of soil erosion in this basin. However, in some areas, many factors, including rainfall, steep slopes, land use activities, and silty loamy soils, contribute to soil erosion. The result of this study is similar to that of a study conducted by Koirala et al. (2019), which revealed that high soil erosion usually occurs in mountain ranges. The NDWI analysis revealed that the northern and western regions were dry (the NDWI value was less than -0.30), and only a few areas in the central regions were moist. The existence of the Nuang Mountains governed the rainfall distribution in the Langat River Basin. This mountain created rain shadow areas, inadequate rainfall, and a shortage of water in the northern regions of the Langat River Basin.
At the basin level, the results of this study were similar to those of previous studies conducted in other adjacent regions of Malaysia. Rizeei et al. (2016) assessed soil erosion in the Semenyih Basin and reported that the highest average soil erosion was 151.00 t/(hm2•a). Another study was conducted by Obaid and Shahid (2017) to evaluate soil erosion in the Johor River Basin, which revealed a mean annual soil erosion of approximately 248.00 t/(hm2•a). Anees et al. (2018) revealed a mean annual soil erosion of approximately 67.00 t/(hm2•a) in the Kelantan Basin. According to those research, compared to other basins, the Langat River Basin is less vulnerable to soil erosion. There were several reasons why certain areas were more affected by soil erosion and drought; this occurred because more than 60.00% of the land in the Langat River Basin was utilized for agricultural activities, with oil palm being the predominant crop. In general, soil erosion was higher in agricultural land than in forest areas, while oil palm plantations were one of the contributors to drought because they use tons of water for crop growth. For example, oil palm has been planted in approximately 800.00 km2 of downstream areas, and the drought map from the NDWI analysis showed that these areas experienced severe drought. Fung et al. (2020) also argued that the Langat River Basin was susceptible to drought and needed better drought preparedness.
Overall, the results of this study revealed that the Langat River Basin is highly prone to soil erosion, especially in the northern and southeastern regions of the study area. In highland areas, soil erosion could cause significant land degradation if it persists for a few years. The area percentage under high soil erosion (4.50%) is alarming, and this area needs to be concerned with the soil erosion issue. If the issue remains unresolved, it has the potential to alter land use trends, and negatively impact the lives of those living in this area. Most areas in the Langat River Basin presented a strong positive correlation between drought and soil erosion (r=0.86). Severe drought events may have caused the highest degree of soil erosion in the highland areas. Therefore, a prolonged drought period aggravates soil erosion in the basin. The results of this study could assist authorities in taking precautionary measures to simultaneously mitigate drought and soil erosion.

4. Conclusions

In this study, we conducted an analysis of soil erosion and drought via the NDWI and RUSLE model combined with remote sensing images and GIS technology in the Langat River Basin, Malaysia. The results of this study indicate that steep slopes, when combined with severe drought, significantly increase the soil erosion risk, particularly in the northern and southeastern regions of the basin. The Langat River Basin has the highest proportion of agricultural land. This activity reduces soil moisture, resulting in land degradation and soil aggregate deterioration due to dry conditions. The drought level (NDWI<0.10) causes the most significant soil erosion due to insufficient soil moisture. The findings therefore indicate that it is crucial to reduce ongoing land clearing, especially in highland regions, and to strengthen conservation policies in areas at high risk of erosion. Because soil erosion will increase in the future, sustainable soil and water management with an effective policy must be implemented to mitigate soil erosion. This study also suggests the application of efficacious support practices for decreasing drought and soil erosion in the study area. Conservation practices, such as filter strips, contour farming, and riparian buffers, can help to reduce the soil erosion in the study area.

Authorship contribution statement

Muhammad RENDANA: conceptualization, methodology, writing - original draft, and writing - review & editing; Wan Mohd Razi IDRIS: conceptualization, methodology, and writing - original draft; Febrinasti ALIA: writing - review & editing; Supli Effendi RAHIM: writing - review & editing; Muhammad YAMIN: writing - review & editing; and Muhammad IZZUDIN: writing - review & editing. All authors approved the manuscript.

Declaration of conflict of interest

The authors declare that they have no known competing financial interests or personal relationships that could have appeared to influence the work reported in this paper.

Acknowledgements

We would like to express our gratitude to our colleagues at the Universitas Sriwijaya, whose insights and expertise have greatly assisted our research work.
[1]
Abdelaal, K., AlKahtani, M., Attia, K., et al., 2021. The role of plant growth-promoting bacteria in alleviating the adverse effects of drought on plants. Biology-Basel. 10(6), 520, doi: 10.3390/biology10060520.

[2]
Abdelsamie, E.A., Abdellatif, M.A., Hassan, F.O., et al., 2023. Integration of RUSLE model, remote sensing and GIS techniques for assessing soil erosion hazards in arid zones. Agriculture-Basel. 13(1), 35, doi: 10.3390/agriculture13010035.

[3]
Abidin, R.Z., Sulaiman, M.S., Yusoff, N., 2017. Erosion risk assessment: A case study of the Langat River bank in Malaysia. Int. Soil Water Conserv. Res. 5(1), 26-35.

[4]
Alewell, C., Borrelli, P., Meusburger, K., et al., 2019. Using the USLE: Chances, challenges and limitations of soil erosion modelling. Int. Soil Water Conserv. Res. 7(3), 203-225.

[5]
Ali, M.I., Dirawan, G.D., Hasim, A.H., et al., 2019. Detection of changes in surface water bodies urban area with NDWI and MNDWI methods. International Journal on Advanced Science, Engineering and Information Technology. 9(3), 946-951.

[6]
Alisjahbana, A.S., Hoi, D.L.J., 2021. Ready for the Dry Years: Building Resilience to Drought in South-East Asia (2nd ed.). [2024-04-15]. https://www.unescap.org/publications/ready-dry-years-building-resilience-drought-south-east-asia-2nd-edition.

[7]
Anees, M.T., Abdullah, K., Nawawi, M.N.M., et al., 2018. Soil erosion analysis by RUSLE and sediment yield models using remote sensing and GIS in Kelantan state, Peninsular Malaysia. Soil Res. 56(4), 356-372.

[8]
Atiem, I.A., Siddig, M.S.A., Hamukwaya, S.L., et al., 2022. Assessment of seasonal rainfall drought indices, Nyala City Sudan. Agriculture-Basel. 12(7), 1069, doi: 10.3390/agriculture12071069.

[9]
Baiamonte, G., Minacapilli, M., Novara, A., et al., 2019. Time scale effects and interactions of rainfall erosivity and cover management factors on vineyard soil loss erosion in the semi-arid area of southern Sicily. Water. 11(5), 978, doi: 10.3390/w11050978.

[10]
Behera, D.K., Jamal, S., Ahmad, W.S., et al., 2023. Estimation of soil erosion using RUSLE Model and GIS tools: A study of Chilika Lake, Odisha. J. Geol. Soc. India. 99(3), 406-414.

[11]
Bekin, N., Prois, Y., Laronne, J.B., et al., 2021. The fuzzy effect of soil conservation practices on runoff and sediment yield from agricultural lands at the catchment scale. CATENA. 207, 105710, doi: 10.1016/j.catena.2021.105710.

[12]
Berberoglu, S., Cilek, A., Kirkby, M., et al., 2020. Spatial and temporal evaluation of soil erosion in Turkey under climate change scenarios using the Pan-European Soil Erosion Risk Assessment (PESERA) model. Environ. Monit. Assess. 192(8), 491, doi: 10.1007/s10661-020-08429-5.

PMID

[13]
Bhaga, T.D., Dube, T., Shoko, C., 2021. Satellite monitoring of surface water variability in the drought prone Western Cape, South Africa. Phys. Chem. Earth. 124, 102914, doi: 10.1016/j.pce.2020.102914.

[14]
Borrelli, P., Panagos, P., 2020. An indicator to reflect the mitigating effect of Common Agricultural Policy on soil erosion. Land Use Policy. 92, 1-8.

[15]
Chen, H., Zhang, X.P., Abla, M., et al., 2018. Effects of vegetation and rainfall types on surface runoff and soil erosion on steep slopes on the Loess Plateau, China. CATENA. 170, 141-149.

[16]
Chinnasamy, P., Honap, V.U., Maske, A.B., 2020. Impact of 2018 Kerala floods on soil erosion: Need for post-disaster soil management. J. Indian Soc. Remote Sens. 48(10), 1373-1388.

[17]
Cui, A.H., Li, J.F., Zhou, Q.M., et al., 2021. Use of a multiscalar GRACE-based standardized terrestrial water storage index for assessing global hydrological droughts. J. Hydrol. 603, 126871, doi: 10.1016/j.jhydrol.2021.126871.

[18]
DID 2011. Review of the National Water Resources Study (2000-2050) and Formulation of National Water Resources Policy. [2024-04-15]. https://library.water.gov.my/cgi-bin/koha/opac-detail.pl?biblionumber=20557.

[19]
Elfithri, R., Mokhtar, M., Abdullah, M.P., et al., 2018. Watershed sustainability index for Langat UNESCO HELP River Basin, Malaysia. International Journal of Engineering & Technology. 7(3.14), 187-190.

[20]
FAO (Food and Agriculture Organization), 1979. A Provisional Methodology of Soil Degradation Assessment. Rome: FAO.

[21]
Felde, V.J.M.N.L., Schweizer, S.A., Biesgen, D., et al., 2021. Wet sieving versus dry crushing: Soil microaggregates reveal different physical structure, bacterial diversity and organic matter composition in a clay gradient. Eur. J. Soil Sci. 72(2), 810-828.

[22]
Fung, K.F., Huang, Y.F., Koo, C.H., et al., 2020. Improved SVR machine learning models for agricultural drought prediction at downstream of Langat River Basin, Malaysia. J. Water Clim. Chang. 11(4), 1383-1398.

[23]
Girmay, G., Moges, A., Muluneh, A., 2020. Estimation of soil loss rate using the USLE model for Agewmariayam Watershed, northern Ethiopia. Agriculture & Food Security. 9, 9, doi: 10.1186/s40066-020-00262-w.

[24]
Gorgij, A.D., Alizamir, M., Kisi, O., et al., 2022. Drought modelling by standard precipitation index (SPI) in a semi-arid climate using deep learning method: Long short-term memory. Neural Comput. Appl. 34(3), 2425-2442.

[25]
Haque, M.Z., Reza, M.I.H., Abd Rahim, S., et al., 2022. Assessing the effectiveness of hydromulching as a rapid soil erosion control measure: A study in Langat Sub Basin, Peninsular Malaysia. Int. J. Conserv. Sci. 13(2), 679-694.

[26]
Hendrawan, V.S.A., Komori, D., Kim, W., 2023. Possible factors determining global-scale patterns of crop yield sensitivity to drought. PLoS One. 18(2), e0281287, doi: 10.1371/journal.pone.0281287.

[27]
Herawati, A., Syamsiyah, J., Baldan, S.K., et al., 2021. Application of soil amendments as a strategy for water holding capacity in sandy soils. IOP Conference Series: Earth and Environmental Science. 724(1), 012014, doi: 10.1088/1755-1315/724/1/012014.

[28]
Hussain, A., Jadoon, K.Z., Rahman, K.U., et al., 2023. Analyzing the impact of drought on agriculture: Evidence from Pakistan using standardized precipitation evapotranspiration index. Nat. Hazards. 115(1), 389-408.

[29]
Islam, M.R., Jaafar, W.Z.W., Hin, L.S., et al., 2020. Development of an erosion model for Langat River Basin, Malaysia, adapting GIS and RS in RUSLE. Appl. Water Sci. 10(7), 165, doi: 10.1007/s13201-020-01185-4.

[30]
Kane, D.A., Bradford, M.A., Fuller, E., et al., 2021. Soil organic matter protects US maize yields and lowers crop insurance payouts under drought. Environ. Res. Lett. 16(4), 044018, doi: 10.1088/1748-9326/abe492.

[31]
Karbasi, M., Karbasi, M., Jamei, M., et al., 2022. Development of a new wavelet-based hybrid model to forecast multi-scalar SPEI drought index (case study: Zanjan city, Iran). Theor. Appl. Climatol. 147(1-2), 499-522.

[32]
Kogo, B.K., Kumar, L., Koech, R., 2020. Impact of land use/cover changes on soil erosion in western Kenya. Sustainability. 12(22), 9740, doi: 10.3390/su12229740.

[33]
Koirala, P., Thakuri, S., Joshi, S., et al., 2019. Estimation of soil erosion in Nepal using a RUSLE modeling and geospatial tool. Geosciences. 9(4), 147, doi: 10.3390/geosciences9040147.

[34]
Liu, C.H., Yang, C.P., Yang, Q., et al., 2021. Spatiotemporal drought analysis by the standardized precipitation index (SPI) and standardized precipitation evapotranspiration index (SPEI) in Sichuan Province, China. Sci. Rep. 11(1), 1280, doi: 10.1038/s41598-020-80527-3.

PMID

[35]
Masroor, M., Sajjad, H., Rehman, S., et al., 2022. Analysing the relationship between drought and soil erosion using vegetation health index and RUSLE models in Godavari middle sub-basin, India. Geosci. Front. 13(2), 101312, doi: 10.1016/j.gsf.2021.101312.

[36]
McFeeters, S.K., 1996. The use of the Normalized Difference Water Index (NDWI) in the delineation of open water features. Int. J. Remote Sens. 17(7), 1425-1432.

[37]
Morgan, R.P.C., 2005. Soil Erosion and Conservation (3rd ed.). Melbourne: Blackwell Publishing Company.

[38]
Mullapudi, A., Vibhute, A.D., Mali, S., et al., 2023. A review of agricultural drought assessment with remote sensing data: Methods, issues, challenges and opportunities. Appl. Geomat. 15(1), 1-13.

[39]
Muñoz, A.A., Klock-Barría, K., Alvarez-Garreton, C., et al., 2020. Water crisis in Petorca Basin, Chile: The combined effects of a mega-drought and water management. Water, 12(3), 1-17.

[40]
Obaid, H.A., Shahid, S., 2017. Soil erosion susceptibility of Johor River basin. Water Environ. J. 31(3), 367-374.

[41]
Obiahu, O.H., Elias, E., 2020. Effect of land use land cover changes on the rate of soil erosion in the Upper Eyiohia river catchment of Afikpo North Area, Nigeria. Environmental Challenges. 1, 100002, doi: 10.1016/j.envc.2020.100002.

[42]
Pandey, A., Chowdary, V.M., Mal, B.C., 2007. Identification of critical erosion prone areas in the small agricultural watershed using USLE, GIS and remote sensing. Water Resour. Manag. 21(4), 729-746.

[43]
Paredes-Trejo, F., Barbosa, H.A., Daldegan, G.A., et al., 2023. Impact of drought on land productivity and degradation in the Brazilian semiarid region. Land. 12(5), 954, doi: 10.3390/land12050954.

[44]
Park, C.K., Kam, J., Byun, H.R., et al., 2022. A self-calibrating effective drought index (scEDI): Evaluation against social drought impact records over the Korean Peninsula (1777-2020). J. Hydrol. 613, 128357, doi: 10.1016/j.jhydrol.2022.128357.

[45]
Patil, P., Jagtap, M., Dakhore, K., 2024. Drought severity estimation using NDWI index in Parbhani district of Maharashtra. J. Agrometeorol. 26(2), 225-227.

[46]
Pham, T.G., Degener, J., Kappas, M., 2018. Integrated universal soil loss equation (USLE) and Geographical Information System (GIS) for soil erosion estimation in A Sap basin: Central Vietnam. Int. Soil Water Conserv. Res. 6(2), 99-110.

[47]
Qiu, J.L., Shen, Z.Y., Leng, G.Y., et al., 2021. Synergistic effect of drought and rainfall events of different patterns on watershed systems. Sci. Rep. 11(1), 18957, doi: 10.1038/s41598-021-97574-z.

[48]
Renard, K.G., Foster, G.R., Weesies, D.K., et al., 1997. Predicting Soil Erosion by Water:A Guide to Conservation Planning with the Revised Universal Soil Loss Equation (RUSLE). Washington:U.S. Government Publishing Office.

[49]
Rendana, M., Rahim, S.A., Idris, W.M.R., et al., 2016. Mapping nutrient status in oil palm plantation using geographic information system. Asian J. Agric. Res. 10(3-4), 144-153.

[50]
Rendana, M., Idris, W.M.R., Rahim, S.A., 2022. Effect of COVID-19 movement control order policy on water quality changes in Sungai Langat, Selangor, Malaysia within distinct land use areas. Sains Malays. 51(5), 1587-1598.

[51]
Rendana, M., Idris, W.M.R., Rahim, S.A., et al., 2023. Flood risk and shelter suitability mapping using geospatial technique for sustainable urban flood management: a case study in Palembang city, South Sumatera, Indonesia. Geology, Ecology, and Landscapes. doi: 10.1080/24749508.2023.2205717.

[52]
Rizeei, H.M., Saharkhiz, M.A., Pradhan, B., et al., 2016. Soil erosion prediction based on land cover dynamics at the Semenyih watershed in Malaysia using LTM and USLE models. Geocarto Int. 31(10), 1158-1177.

[53]
Rokni, K., Ahmad, A., Selamat, A., et al., 2014. Water feature extraction and change detection using multitemporal Landsat imagery. Remote Sens. 6(5), 4173-4189.

[54]
Romdania, Y., Herison, A., 2024. The effect of steep slopes on the application of the USLE, RUSLE, and MUSLE methods. ASEAN Engineering Journal. 14(1), 229-236.

[55]
Roose, E.J., 1977. Application of the universal soil loss equation of Wischmeier and Smith in West Africa. In: Greenland, J., Lal, R., (eds.)Conservation and Management in the Humid Tropics. Chichester: Wiley.

[56]
Selmy, S.A.H., Abd Al-Aziz, S.H., Jiménez-Ballesta, R., et al., 2021. Modeling and assessing potential soil erosion hazards using USLE and wind erosion models in integration with GIS techniques: Dakhla Oasis, Egypt. Agriculture-Basel. 11(11), 1124, doi: 10.3390/agriculture11111124.

[57]
Selvanathan, M., Jayabalan, N., Saini, G.K., et al., 2020. Employee productivity in Malaysian Private Higher Educational Institutions. Palarch’s Journal of Archaralogy of Egypt/Egyptogy. 17(3), 66-79.

[58]
Serio, M.A., Carollo, F.G., Ferro, V., 2019. Raindrop size distribution and terminal velocity for rainfall erosivity studies. A review. J. Hydrol. 576, 210-228.

[59]
Shah, D., Mishra, V., 2020. Integrated Drought Index (IDI) for drought monitoring and assessment in India. Water Resour. Res. 56(2), e2019WR026284, doi: 10.1029/2019WR026284.

[60]
Shen, L., Li, C., 2010. Water body extraction from Landsat ETM plus imagery using adaboost algorithm. In: 2010 18th International Conference on Geoinformatics. Beijing, China.

[61]
Shin, G.J., 1999. The analysis of soil erosion analysis in watershed using GIS. PhD Dissertation. Chuncheon: Gang-won National University.

[62]
Sinshaw, B.G., Belete, A.M., Tefera, A.K., et al., 2021. Prioritization of potential soil erosion susceptibility region using fuzzy logic and analytical hierarchy process, upper Blue Nile Basin, Ethiopia. Water-Energy Nexus. 4, 10-24.

[63]
Tsegaye, L., Bharti, R., 2021. Soil erosion and sediment yield assessment using RUSLE and GIS-based approach in Anjeb watershed, Northwest Ethiopia. SN Appl. Sci. 3(5), 582, doi: 10.1007/s42452-021-04564-x.

[64]
Vicente-Serrano, S.M., Quiring, S.M., Peña-Gallardo, M., et al., 2020. A review of environmental droughts: increased risk under global warming? Earth-Sci. Rev. 201, 102953, doi: 10.1016/j.earscirev.2019.102953.

[65]
Wilson, E.H., Sader, S.A., 2002. Detection of forest harvest type using multiple dates of Landsat TM imagery. Remote Sens. Environ. 80(3), 385-396.

[66]
Wischmeier, W.H., 1959. A rainfall erosion index for a universal soil-loss equation. Soil Sci. Soc. Am. J. 23(3), 181-254.

[67]
Wu, J.J., Gu, Y.H., Sun, K.X., et al., 2023. Correlation of climate change and human activities with agricultural drought and its impact on the net primary production of winter wheat. J. Hydrol. 620, 129504, doi: 10.1016/j.jhydrol.2023.129504.

[68]
Yu, Y.H., Shen, Y.Z., Wang, J.L., et al., 2021. Simulation and mapping of drought and soil erosion in Central Yunnan Province, China. Adv. Space Res. 68(11), 4556-4572.

[69]
Yusof, N.F., Lihan, T., Idris, W.M.R., et al., 2021. Spatially distributed soil losses and sediment yield: A case study of Langat watershed, Selangor, Malaysia. J. Asian Earth Sci. 212, 104742, doi: 10.1016/j.jseaes.2021.104742.

[70]
Zhang, R.Q., Lu, L., Ye, Z., et al., 2021. Assessment of agricultural drought using soil water deficit index based on ERA5-land soil moisture data in four southern provinces of China. Agriculture-Basel. 11(5), 411, doi: 10.3390/agriculture11050411.

Outlines

/