
Residents’ attitudes and behaviours on private green spaces in the suburban areas of Central European countries
Received date: 2024-03-28
Revised date: 2024-07-26
Accepted date: 2024-11-20
Online published: 2025-08-13
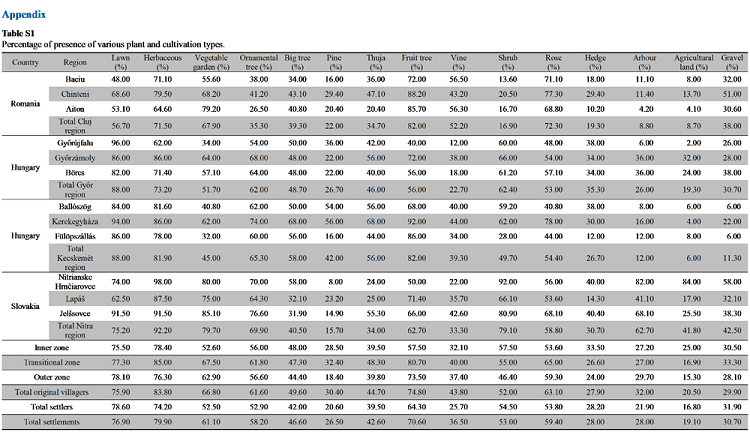
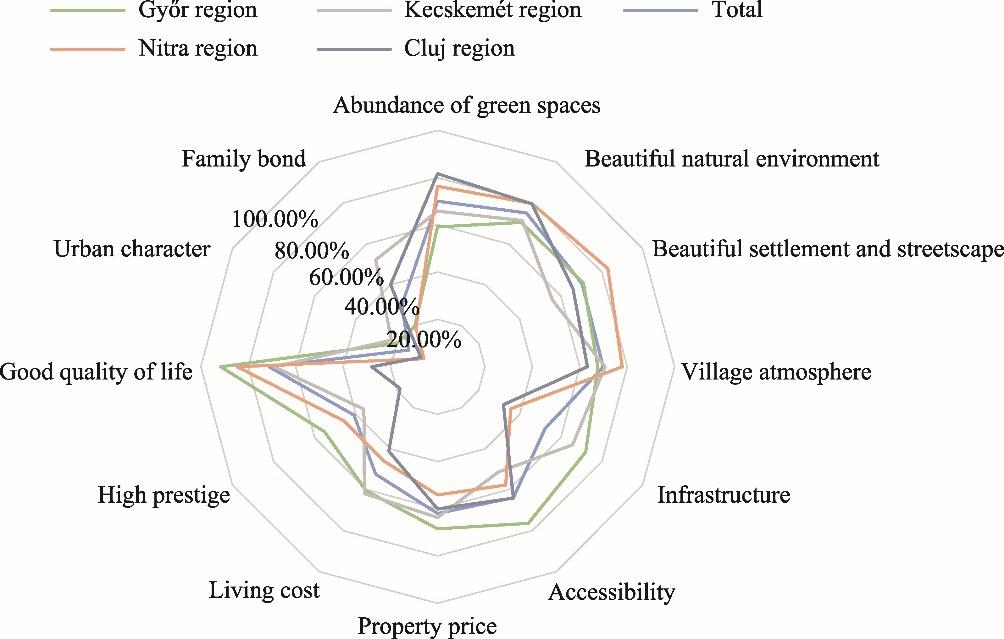
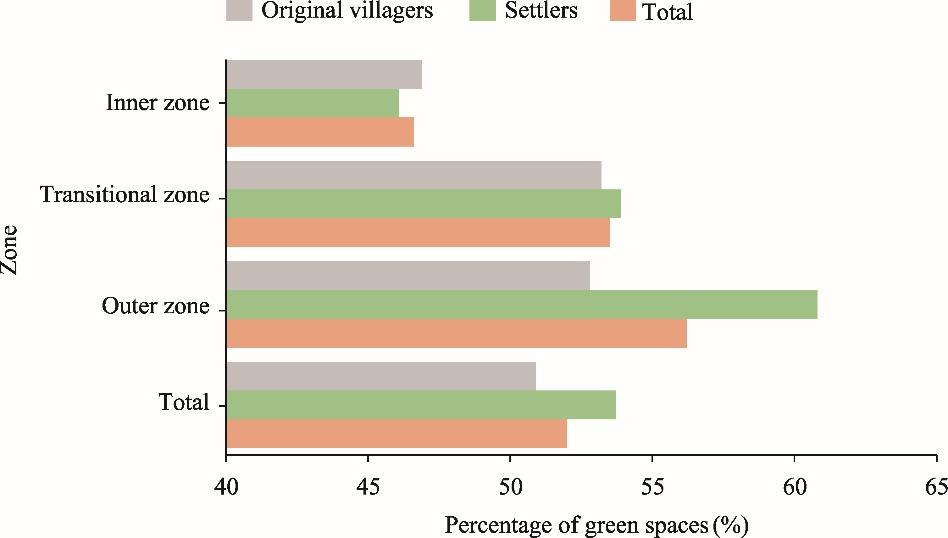
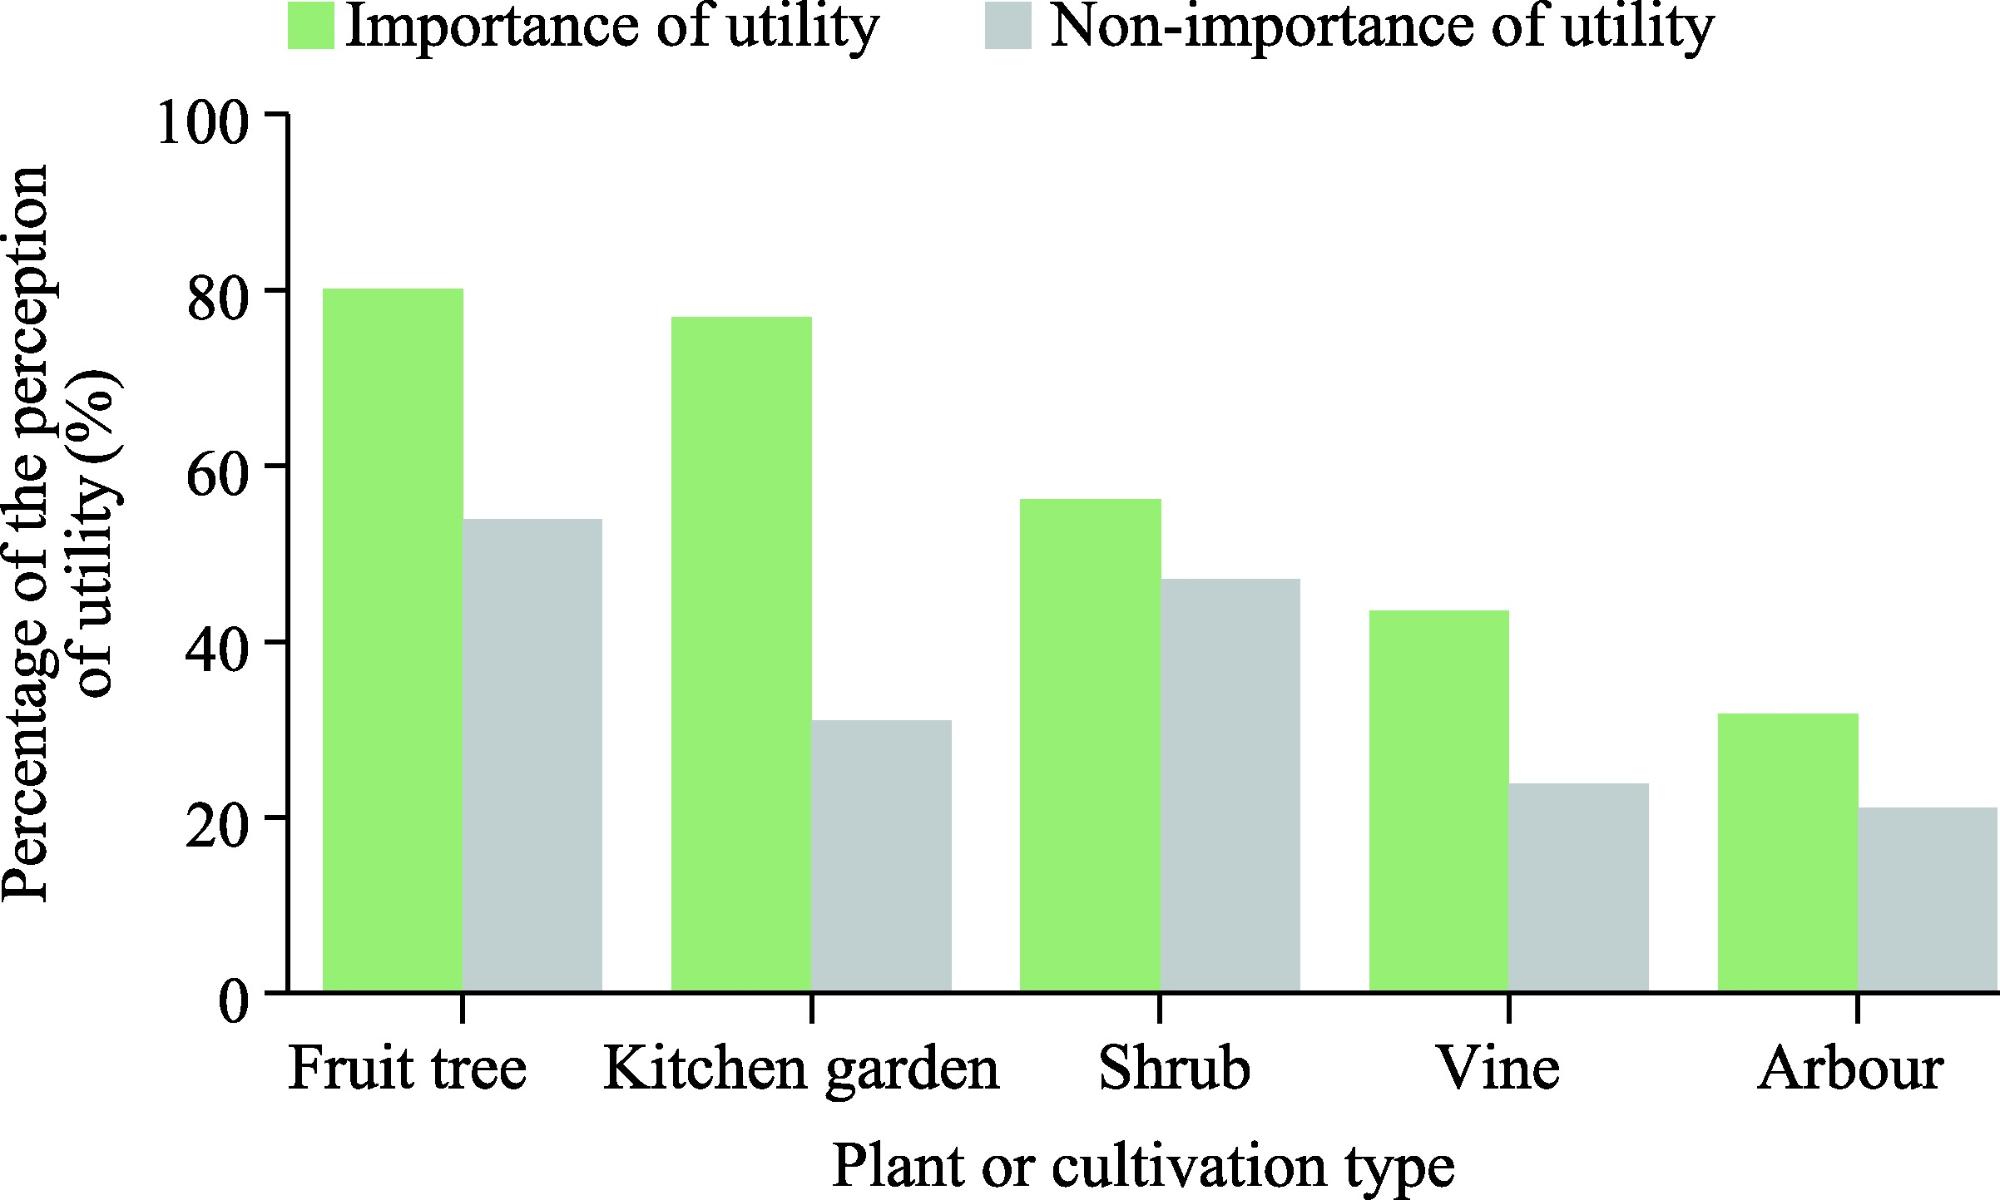
Green spaces in urban and suburban areas play a significant role in helping settlements adapt to climate change. The design, quantity, quality, and location of green spaces influence their ability to provide benefits to people and enhance the quality of life. Private green spaces, if adequately managed, can enhance the environmental quality. This study, based on a questionnaire survey and the Motivation/Attitude-Driven Behaviour (MADB) model, investigated how the attitudes and behaviours of residents shape private green spaces in 12 settlements of the 4 city regions (Cluj region, Nitra region, Kecskemét region, and Györ region) in 3 Central European countries (Hungary, Slovakia, and Romania). The results showed that beautiful natural environment, abundance of green spaces, beautiful settlement and streetscape, and village atmosphere were mentioned most often, along with good quality of life, with a mention rate of over 70.00% in the four city regions. Convenience also played a significant role in the management of green spaces, showing that convenience factors (less work, less waste, and cheaper management) more important for those who live in settlements nearer to the cities. The importance of biodiversity and ecology was positively correlated with socio-economic status such as education and financial situation. However, the importance of the utility of green spaces was less prevalent among original villagers and settlers. Moreover, we found that the percentage of green spaces of settlers is slightly higher than that of original villagers. The results of factor analysis revealed that socio-economic status can influence respondents’ attitudes towards green spaces. It suggests to increase ecological awareness of residents, especially for new settlers, and promote good management techniques for green spaces. This study can improve the awareness of urban planners about the importance of green spaces in suburban areas.
Tamás HARDI , Ádám PÁTHY , Andrea POZSGAI . Residents’ attitudes and behaviours on private green spaces in the suburban areas of Central European countries[J]. Regional Sustainability, 2024 , 5(4) : 100180 . DOI: 10.1016/j.regsus.2024.100180
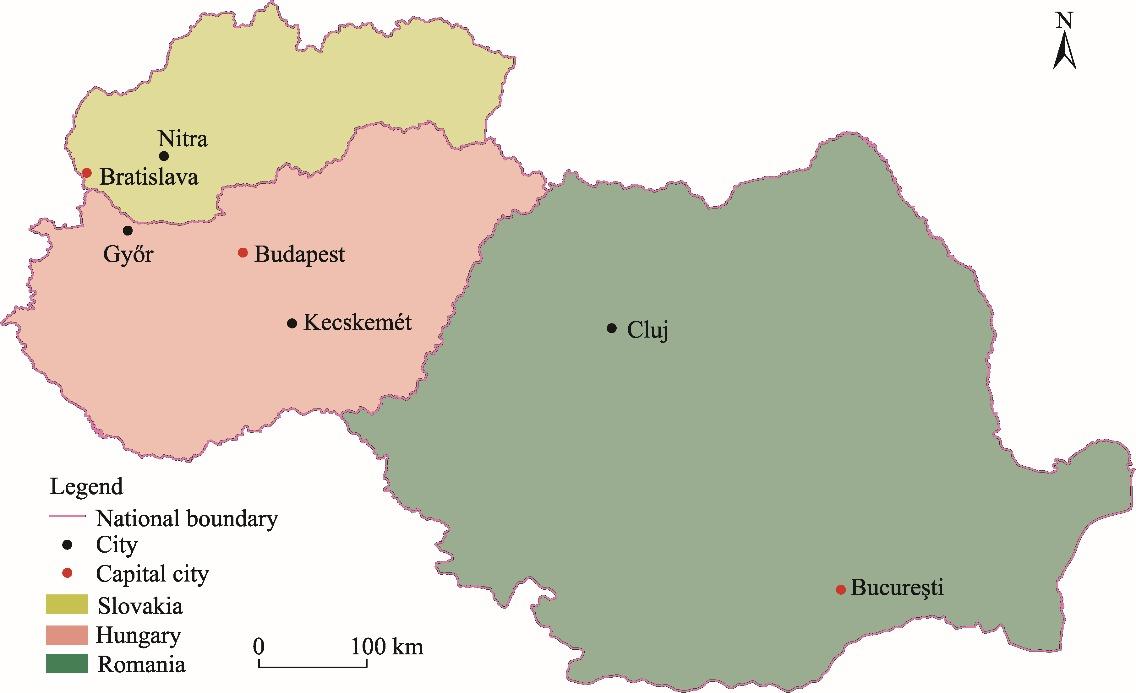
Fig. 1. Overview of the study area. The projection of this map is HD72/EOV (EPSG: 23700). |
Table 1 Basic characteristics of the study area. |
| Country | Region | Population (persons) | Percentage of impervious surface (%) | Residential density (personskm2) | |||||||||
|---|---|---|---|---|---|---|---|---|---|---|---|---|---|
| Impervious surface of 16.00%-50.00% | Impervious surface of 50.00%-100.00% | ||||||||||||
| 2001 | 2011 | 2018 | 2006 | 2012 | 2018 | 2006 | 2012 | 2018 | 2011 | 2018 | |||
| Romania | City | Cluj | 318,056 | 308,026 | 323,675 | 10.49 | 11.60 | 8.41 | 7.87 | 8.30 | 13.27 | 8624 | 8333 |
| City region | Cluj region | 185,671 | 192,791 | 213,223 | 1.15 | 1.40 | 1.28 | 0.23 | 0.30 | 0.89 | 3603 | 3151 | |
| Sample settlement | Baciu | 8064 | 9371 | 11,526 | 1.66 | 1.80 | 1.74 | 0.21 | 0.20 | 1.26 | 5246 | 4366 | |
| Chinteni | 2831 | 2929 | 3294 | 0.72 | 0.80 | 0.98 | 0.02 | 0.00 | 0.34 | 3907 | 2573 | ||
| Aiton | 1392 | 1154 | 1019 | 0.69 | 0.70 | 1.04 | 0.00 | 0.00 | 0.18 | 3421 | 1832 | ||
| Slovakia | City | Nitra | 86,656 | 79,202 | 76,655 | 18.85 | 22.80 | 13.30 | 2.37 | 2.70 | 11.24 | 3056 | 3081 |
| City region | Nitra region | 219,878 | 220,162 | 222,159 | 5.29 | 5.60 | 3.91 | 0.14 | 0.20 | 1.77 | 1922 | 1950 | |
| Sample settlement | Nitrianske Hrnčiarovce | 1746 | 1914 | 2089 | 9.59 | 11.80 | 8.74 | 0.07 | 0.10 | 3.25 | 1655 | 1791 | |
| Lapáš | 1494 | 1645 | 2659 | 7.59 | 10.49 | 7.92 | 0.16 | 0.14 | 4.68 | 1375 | 1875 | ||
| Jelšovce | 950 | 988 | 1000 | 5.92 | 6.10 | 4.26 | 0.05 | 0.10 | 1.69 | 1518 | 1587 | ||
| Hungary | City | Kecskemét | 107,708 | 111,150 | 110,687 | 8.06 | 8.36 | 5.86 | 3.03 | 3.37 | 6.09 | 2930 | 2863 |
| City region | Kecskemét region | 145,647 | 140,751 | 139,920 | 1.84 | 1.90 | 1.56 | 0.42 | 0.44 | 1.12 | 2436 | 2114 | |
| Sample settlement | Ballószög | 2666 | 3215 | 3652 | 3.31 | 3.45 | 2.18 | 0.22 | 0.23 | 1.34 | 2524 | 3000 | |
| Kerekegyháza | 5994 | 6263 | 6563 | 3.06 | 3.08 | 2.56 | 0.23 | 0.24 | 1.43 | 2313 | 2016 | ||
| Fülöpszállás | 2456 | 2191 | 2047 | 1.07 | 1.10 | 1.10 | 0.03 | 0.04 | 0.29 | 2088 | 1605 | ||
| City | Györ | 129,411 | 129,519 | 132,038 | 10.30 | 10.90 | 11.88 | 9.52 | 10.70 | 12.59 | 3410 | 3074 | |
| City region | Györ region | 146,126 | 149,396 | 158,148 | 3.00 | 3.10 | 3.20 | 0.83 | 0.90 | 1.55 | 1863 | 1681 | |
| Sample settlement | Györújfalu | 1096 | 1565 | 2201 | 6.89 | 7.70 | 7.35 | 2.58 | 3.10 | 4.54 | 1381 | 2524 | |
| Györzámoly | 1560 | 2336 | 3129 | 2.26 | 2.30 | 2.86 | 1.29 | 1.30 | 1.71 | 1595 | 2520 | ||
| Börcs | 1005 | 1236 | 1320 | 3.89 | 3.90 | 4.42 | 1.29 | 1.30 | 1.94 | 1561 | 1670 | ||
Note: City region means a 20 km radius zone around each city. |
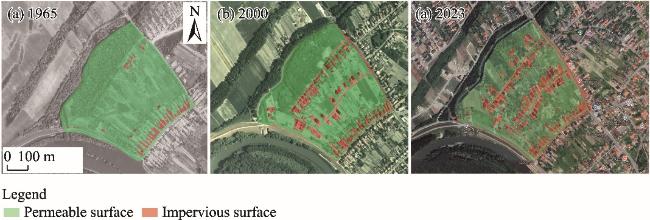
Fig. 2. Distribution of permeable and impervious surfaces in the first neighbourhood of Györzámoly in 1965 (a), 2000 (b), and 2023 (c). |
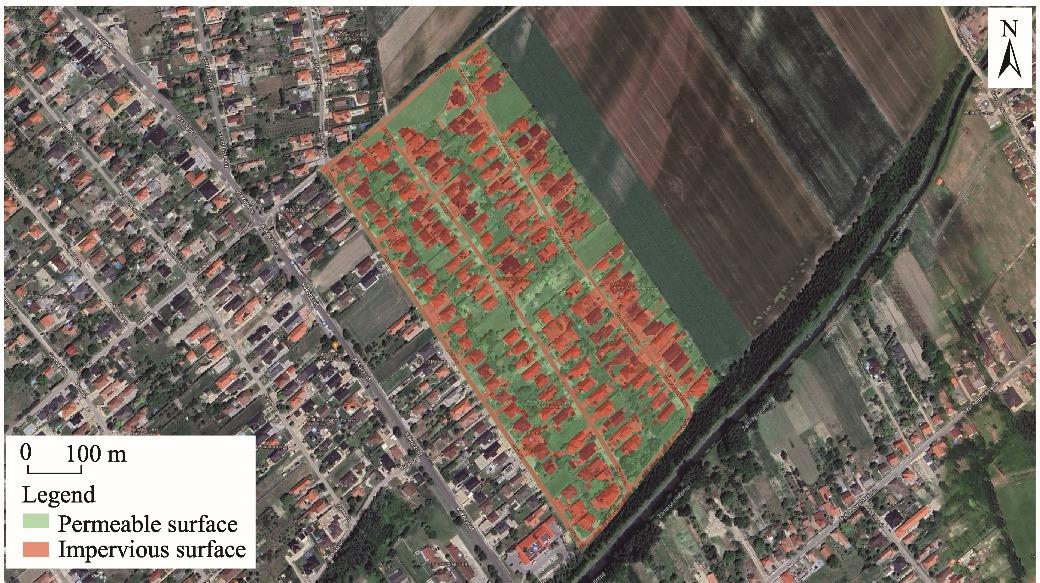
Fig. 3. Distribution of permeable and impervious surfaces in the second neighbourhood of Györzámoly in 2023. |
Table 2 Migration patterns of settlers in the four city regions. |
| City region | Settlement | Percentage of settlers always living here (%) | Percentage of settlers moving to settlements (%) | Percentage of settlers moving from the centre of the city (%) | |
|---|---|---|---|---|---|
| Anytime | After 2000 | ||||
| Cluj region | Baciu | 64.60 | 35.40 | 14. 00 | 64.70 |
| Chinteni | 56.30 | 43.80 | 37.30 | 81.00 | |
| Aiton | 31.30 | 68.80 | 59.20 | 60.50 | |
| Total | 50.70 | 49.30 | 36.70 | 67.60 | |
| Györ region | Györújfalu | 30.00 | 70.00 | 58.00 | 80.00 |
| Györzámoly | 44.00 | 56.00 | 48.00 | 81.50 | |
| Börcs | 50.00 | 50.00 | 46.00 | 88.00 | |
| Total | 41.30 | 58.70 | 50.70 | 82.80 | |
| Kecskemét region | Ballószög | 38.00 | 62.00 | 33.00 | 73.30 |
| Kerekegyháza | 62.00 | 38.00 | 20.00 | 27.80 | |
| Fülöpszállás | 52.00 | 48.00 | 32.00 | 16.70 | |
| Total | 50.70 | 49.30 | 32.00 | 43.10 | |
| Nitra region | Nitrianske Hrnčiarovce | 61.00 | 38.00 | 34.00 | 70.50 |
| Lapáš | 42.90 | 57.10 | 50.00 | 65.60 | |
| Jelšovce | 61.70 | 38.30 | 29.80 | 50.00 | |
| Total | 54.90 | 45.10 | 38.60 | 62.70 | |
| Inner zone | 48.50 | 51.50 | 37.50 | 73.70 | |
| Transitional zone | 51.00 | 49.00 | 39.10 | 66.30 | |
| Outer zone | 48.70 | 51.30 | 41.80 | 55.00 | |
| Total zone | 49.40 | 50.60 | 39.50 | 65.00 | |
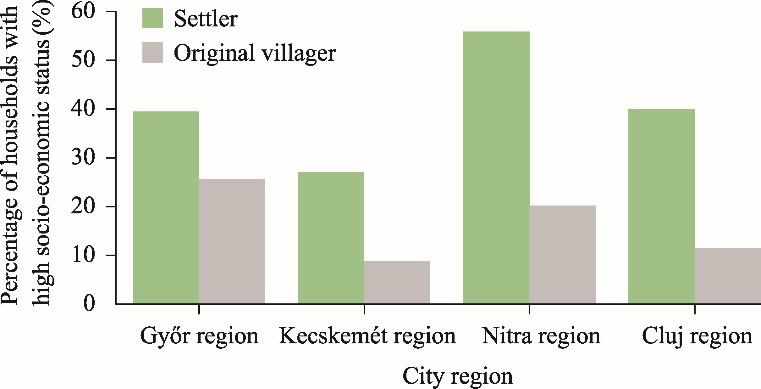
Fig. 4. Percentage of households with high socio-economic status in the four city regions. |
Fig. 5. Percentage of factors driving for moving to a settlement in the four city regions. |
Fig. 6. Percentage of green spaces of original villagers and settlers in different zones of the four city regions. |
Table 3 Factor scores of attitudes and behaviours of respondents towards green spaces. |
| Function or characteristic of garden | Biodiversity | Convenience | Ecology | Utility | Indigenous species | Climate |
|---|---|---|---|---|---|---|
| Providing habitat for birds | 0.570 | |||||
| Providing habitat for insects | 0.756 | |||||
| Providing habitat for other animals | 0.703 | |||||
| Being maintained with little work | 0.597 | |||||
| Being maintained inexpensively | 0.668 | |||||
| Does not generate much waste | 0.620 | |||||
| Increasing green areas | 0.670 | |||||
| Contributing to ecological corridors | 0.751 | |||||
| Useful from a market perspective | 0.881 | |||||
| Useful for providing food for the household | 0.419 | |||||
| Containing indigenous species | 0.489 | |||||
| Does not contain invasive species | 0.680 | |||||
| Providing shade | 0.626 | |||||
| Regulating microclimate | 0.481 | |||||
| Having big trees | 0.416 | |||||
| Kaiser-Meyer-Olkin=0.704; Significance of Bartlett’s test of sphericity=0.000 | ||||||
Table 4 Percentage of respondents considering convenience important in the four city regions. |
| Zone | Cluj region | Györ region | Kecskemét region | Nitra region | ||||
|---|---|---|---|---|---|---|---|---|
| Settlement | Percentage (%) | Settlement | Percentage (%) | Settlement | Percentage (%) | Settlement | Percentage (%) | |
| Inner zone | Baciu | 56.00 | Györújfalu | 90.00 | Ballószög | 94.00 | Nitrianske Hrnčiarovce | 96.00 |
| Transitional zone | Chinteni | 49.00 | Györzámoly | 88.00 | Kerekegyháza | 86.00 | Lapáš | 93.60 |
| Outer zone | Aiton | 45.10 | Börcs | 86.00 | Fülöpszállás | 54.00 | Jelšsovce | 87.50 |
| Chi2 significance=0.000 | ||||||||
Table 5 Influence of plants or cultivation types on awareness on the management of green spaces. |
| Plant or cultivation type | Biodiversity | Ecology | Indigenous species | Climate |
|---|---|---|---|---|
| Lawn | + | |||
| Herbaceous plant | + | + | + | |
| Kitchen garden | + | + | ||
| Large tree | - | + | ||
| Pine | - - | ++ | ||
| Thuja | - | |||
| Vine | + | |||
| Shrub | ++ | ++ | + | |
| Rose | + | - | ||
| Arbor | ++ | ++ | + | |
| Uncultivated soil | ++ | - - | ++ | ++ |
| Gravel | - - | ++ |
Note: + means positive impact; - means negative impact. One mark means significant impact below 10.00% and two marks mean significant impact over 10.00%. |
Table 6 Logistic regression results for the driving factors of utility of green spaces. |
| Factor | Wald | Significance | Exp(B) |
|---|---|---|---|
| Moved to settlement after 2000 | 18.589 | 0.000 | 0.416 |
| Outer zone | 35.441 | 0.000 | - |
| Transitional zone | 1.361 | 0.243 | 0.762 |
| Inner zone | 30.699 | 0.000 | 0.277 |
| Household member with a tertiary degree | 4.465 | 0.035 | 0.544 |
| Socio-economic status | 6.517 | 0.043 | 0.734 |
| Average age of household | 1.788 | 0.281 | 1.014 |
| Constant | 8.259 | 0.000 | 3.171 |
| Nagelkerke R=0.159 | |||
Note: Exp(B) is the odds ratio of predictors, indicating the predicted change in odds for a unit increase in the predictor. - means no value. |
Fig. 7. Percentage of the perception of utility of the plants or cultivation types in green spaces. |
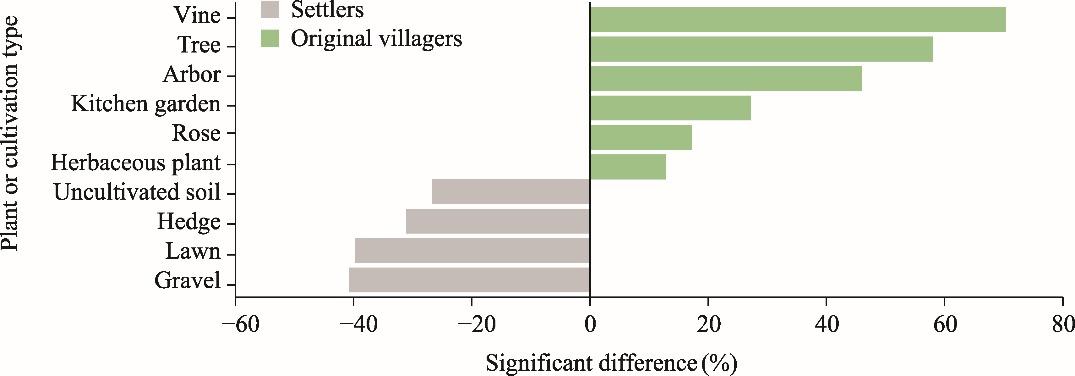
Fig. 8. Differences in plants or cultivation types between original villagers and settlers. |
| [1] |
|
| [2] |
|
| [3] |
|
| [4] |
|
| [5] |
|
| [6] |
|
| [7] |
|
| [8] |
|
| [9] |
|
| [10] |
|
| [11] |
|
| [12] |
|
| [13] |
|
| [14] |
EEA (European Environment Agency), 2016. Urban Sprawl in Europe. [2024-01-15]. https://www.eea.europa.eu/publications/urban-sprawl-in-europe.
|
| [15] |
|
| [16] |
|
| [17] |
|
| [18] |
|
| [19] |
|
| [20] |
|
| [21] |
|
| [22] |
|
| [23] |
|
| [24] |
|
| [25] |
|
| [26] |
|
| [27] |
|
| [28] |
|
| [29] |
|
| [30] |
|
| [31] |
|
| [32] |
|
| [33] |
|
| [34] |
|
| [35] |
|
| [36] |
|
| [37] |
|
| [38] |
|
| [39] |
|
| [40] |
|
| [41] |
|
| [42] |
|
| [43] |
|
| [44] |
|
| [45] |
UN-DESAPD (United Nations-Department of Economic and Social Affairs Population Dynamics), 2019. World Urbanization Prospects: The 2018 Revision. [2024-01-15]. https://population.un.org/wup/Publi-catio-ns/Files/WUP2018-Report.pdf.
|
| [46] |
|
| [47] |
|
| [48] |
|
/
| 〈 |
|
〉 |