
Efficiency and sustainability of the tourism industry in Latin America
Received date: 2023-12-14
Revised date: 2024-04-22
Accepted date: 2024-11-25
Online published: 2025-08-13
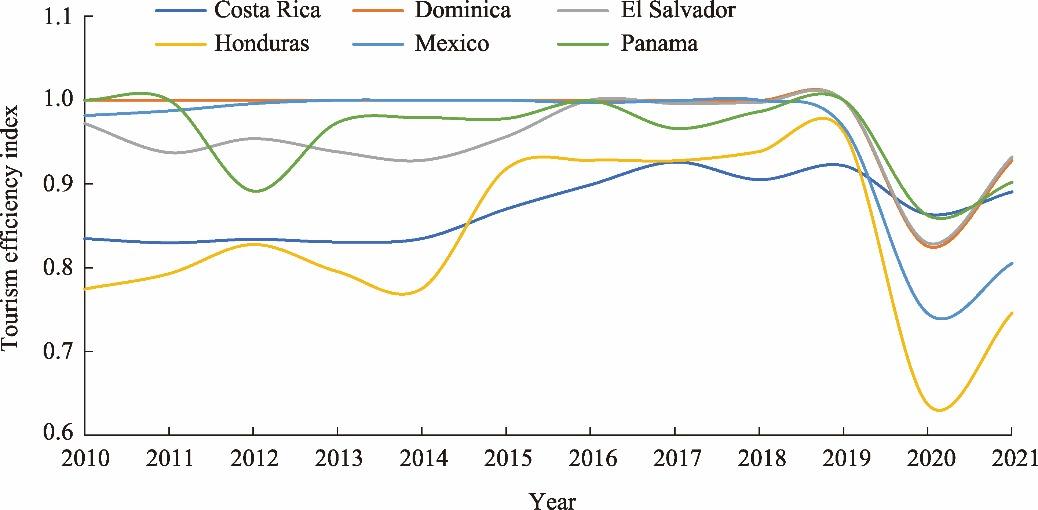
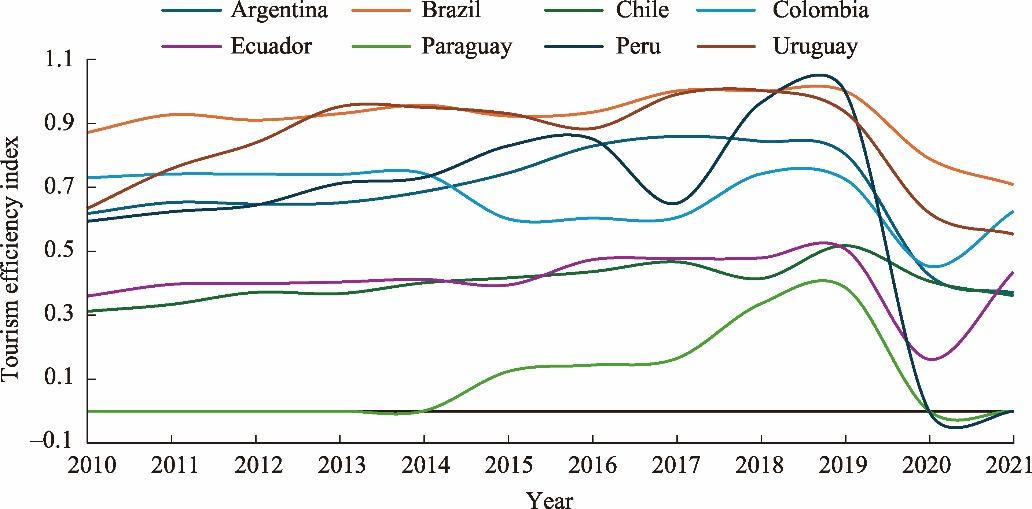
The tourism industry is economically very important. According to the World Travel Tourism Council, in 2019, the tourism industry accounted for a quarter of all new jobs created worldwide, 10.3% of all jobs, and 9.6×10¹² USD of the global gross domestic product. This study aimed to calculate the tourism efficiency index for different Latin American countries from 2010 to 2021 using data envelopment analysis, which analyzes the relationships between input variables (including the number of employees in the tourism industry and the number of hotel-type establishments) and output variables (including tourism expenditures in other countries and public social expenditures in recreation and culture per capita). Additionally, this study aimed to identify the countries with greater tourism development and the factors that may affect the development of the tourism industry through the stochastic frontier production function. The results of the tourism efficiency index for Central America (including Costa Rica, Dominica, El Salvador, Honduras, Mexico, and Panama) and South America (including Argentina, Brazil, Chile, Colombia, Ecuador, Paraguay, Peru, and Uruguay) exhibited different trends. However, after the global health crisis, the tourism industry recovered, showing new opportunities to promote sustainability. The results of the stochastic frontier production function demonstrated that countries with higher levels of inbound and outbound tourism, contribution of tourism to the economy, natural resources, and literacy rate exhibited more efficient tourism industry, whereas countries with higher pollution levels exhibited less efficient tourism industry. The findings of this study could allow us to formulate suitable public policies to promote tourism, maintain natural resources, and diversify these sectors with more inclusive programmes that can facilitate growth and benefit vulnerable communities.
Clara Inés PARDO MARTÍNEZ , Alexander COTTE POVEDA . Efficiency and sustainability of the tourism industry in Latin America[J]. Regional Sustainability, 2024 , 5(4) : 100178 . DOI: 10.1016/j.regsus.2024.100178
Table 1 Variables used in this study and their sources. |
| Variable | Definition | Source |
|---|---|---|
| Employment in the tourism industry (103 persons) | Number of employees in the tourism industry | UNWTO |
| Establishments in the tourism industry | Number of hotel-type establishments | UNWTO |
| Tourism expenditure (106 USD) | Tourism expenditure in other countries | UNWTO |
| Public social expenditure (USD per capita) | Public social expenditure in recreation and culture per capita | ECLAC |
| Inbound tourism (103 persons) | Total arrivals | UNWTO |
| Outbound tourism (103 persons) | Total departures | UNWTO |
| Contribution of tourism to the economy (%) | Share of tourism in the GDP | UNWTO |
| Mangroves area (103 hm2) | ECLAC | |
| Terrestrial biodiversity (%) | Proportion of terrestrial biodiversity sites covered by protected areas | ECLAC |
| Marine biodiversity (%) | Proportion of marine biodiversity sites covered by protected areas | ECLAC |
| Freshwater biodiversity (%) | Proportion of freshwater biodiversity sites covered by protected areas | ECLAC |
| Forest area (103 hm2) | ECLAC | |
| Percentage of land area covered by forests (%) | ECLAC | |
| Area of forest plantations (%) | Area of forest plantations expressed as a percentage | ECLAC |
| GHG emissions per capita (t CO2e per capita) | ECLAC | |
| CO2 emissions per capita (t per capita) | ECLAC | |
| Literacy rate (%) | Literacy rate of people ages 15 years old and over | ECLAC |
| Public social expenditure in education (USD per capita) | ECLAC | |
| Public social expenditure in health (USD per capita) | ECLAC | |
| Public social expenditure in environmental protection (USD per capita) | ECLAC |
Note: UNWTO, World Tourism Organization; ECLAC, the United Nations Economic Commission for Latin America and the Caribbean; GPD, gross domestic product; GHG, greenhouse gas; CO2e, carbon dioxide equivalent. Monetary variables were calculated in constant dollar units. |
Table 2 Variable classification of the models. |
| Classification | Variable | Estimated relationship | Reference |
|---|---|---|---|
| Economic variables | Inbound tourism | + | OECD (2024) |
| Outbound tourism | + | ||
| Contribution of tourism to the economy | + | ||
| Natural resources variables | Mangroves area | + | WTO (2010); Tyrväinen et al. (2014, 2017); Juutinen (2017) |
| Terrestrial biodiversity | + | ||
| Marine biodiversity | + | ||
| Freshwater biodiversity | + | ||
| Forest area | + | ||
| Land area covered by forests | + | ||
| Area of forest plantations | + | ||
| Pollution variables | GHG emissions per capita | - | The One Planet Network (2022) |
| CO2 emissions per capita | - | ||
| Social variables | Literacy rate | + | Schianetz and Kavanagh (2008); Badulescu et al. (2022); Pololikashvili (2022); Ar Rashid (2023) |
| Public social expenditure in education | + | ||
| Public social expenditure in health | + | ||
| Public social expenditure in environmental protection | + |
Note: + and - denote positive and negative effects, respectively. |
Fig. 1. Tourism efficiency index for Central America (including Costa Rica, Dominica, El Salvador, Honduras, Mexico, and Panama) during 2010-2021. |
Fig. 2. Tourism efficiency index for South America (including Argentina, Brazil, Chile, Colombia, Ecuador, Paraguay, Peru, and Uruguay) during 2010-2021. |
Table 3 Results of regression models with the tourism efficiency index as the dependent variable. |
| Parameter | Model 1 | Model 2 | Model 3 | Model 4 | Model 5 | Model 6 | Model 7 | Model 8 | Model 9 | Model 10 | Model 11 | Model 12 | Model 13 | Model 14 |
|---|---|---|---|---|---|---|---|---|---|---|---|---|---|---|
| Constant | -0.590** (0.276) | -1.093*** (0.277) | 0.048 (0.228) | 0.966*** (0.328) | -2.418*** (0.423) | -2.833*** (0.551) | -3.292*** (0.413) | -3.766*** (0.629) | -3.119*** (0.583) | -3.559*** (0.525) | -5.098*** (1.038) | -3.298*** (0.635) | -2.654** (1.079) | -5.002*** (1.265) |
| Inbound tourism | 0.005 (0.012) | 0.002*** (0.000) | 0.012 (0.012) | 0.117*** (0.552) | 0.035*** (0.007) | 0.034*** (0.007) | 0.014* (0.008) | 0.011 (0.008) | 0.004 (0.008) | 0.003 (0.008) | 0.001 (0.007) | 0.003 (0.008) | 0.003 (0.008) | 0.002 (0.010) |
| Outbound tourism | 0.181*** (0.022) | 0.406*** (0.041) | 0.148*** (0.024) | 0.243*** (0.029) | 0.197*** (0.017) | 0.142*** (0.027) | 0.217*** (0.030) | 0.215*** (0.029) | 0.190*** (0.049) | 0.173*** (0.052) | 0.137*** (0.032) | 0.169*** (0.033) | 0.160*** (0.032) | 0.139*** (0.034) |
| Contribution of tourism to the economy | 0.074* (0.038) | 0.292*** (0.051) | 0.120** (0.039) | 0.115*** (0.035) | 0.115*** (0.030) | 0.175*** (0.035) | 0.124*** (0.037) | 0.135*** (0.038) | 0.075 (0.052) | 0.064 (0.052) | 0.066* (0.049) | 0.081* (0.050) | 0.090** (0.050) | 0.064 (0.050) |
| Mangroves area | 0.069*** (0.019) | 0.000** (0.000) | 0.052*** (0.014) | 0.000*** (0.000) | 0.000 (0.000) | 0.000 (0.000) | 0.000 (0.000) | 0.000 (0.000) | 0.000 (0.000) | 0.000* (0.000) | 0.000 (0.000) | 0.000 (0.000) | 0.000 (0.000) | |
| Terrestrial biodiversity | 0.006*** (0.001) | 0.926*** (0.079) | 0.016*** (0.001) | 0.018*** (0.001) | 0.015*** (0.001) | 0.017*** (0.001) | 0.016*** (0.002) | 0.016*** (0.002) | 0.017*** (0.002) | 0.016*** (0.002) | 0.016*** (0.003) | 0.017*** (0.002) | ||
| Marine biodiversity | 0.229*** (0.054) | 0.321*** (0.039) | 0.240*** (0.049) | 0.191*** (0.048) | 0.215*** (0.052) | 0.296*** (0.056) | 0.318*** (0.060) | 0.243*** (0.059) | 0.291*** (0.056) | 0.307*** (0.061) | 0.238*** (0.062) | |||
| Freshwater biodiversity | 0.279*** (0.048) | 0.472*** (0.099) | 0.423*** (0.074) | 0.497*** (0.102) | 0.383*** (0.104) | 0.464** (0.109) | 0.603*** (0.134) | 0.439*** (0.114) | 0.352* (0.220) | 0.577*** (0.194) | ||||
| Forest area | 0.078** (0.031) | 0.029 (0.026) | 0.049 (0.032) | 0.050 (0.052) | 0.068 (0.055) | 0.105** (0.041) | 0.075* (0.040) | 0.065 (0.074) | 0.093* (0.064) | |||||
| Land area covered by forests | 0.151*** (0.038) | 0.160*** (0.037) | 0.057 (0.071) | 0.032 (0.075) | ||||||||||
| Area of forest plantations | 0.028 (0.028) | 0.029 (0.034) | 0.075* (0.047) | 0.032 (0.029) | 0.016 (0.038) | 0.026 (0.091) | 0.014 (0.083) | |||||||
| GHG emissions per capita | -0.158* (0.085) | -0.264*** (0.047) | -0.211*** (0.044) | -0.215*** (0.046) | -0.263*** (0.060) | |||||||||
| CO2 emissions per capita | -0.161** (0.076) | |||||||||||||
| Literacy rate | 0.016** (0.007) | 0.017** (0.007) | ||||||||||||
| Public social expenditure in education | 0.038 (0.036) | |||||||||||||
| Public social expenditure in health | 0.013 (0.075) | 0.000 (0.000) | ||||||||||||
| Public social expenditure in environmental protection | 0.001 (0.025) | |||||||||||||
| σv | 0.214 | 0.121 | 0.180 | 0.083 | 0.073 | 0.053 | 0.068 | 0.066 | 0.068 | 0.068 | 0.068 | 0.068 | 0.068 | 0.066 |
| σu | 0.002 | 0.001 | 0.059 | 0.001 | 0.108 | 0.132 | 0.090 | 0.093 | 0.001 | 0.000 | 0.001 | 0.001 | 0.000 | 0.000 |
| σ2 | 0.046 | 0.014 | 0.036 | 0.007 | 0.017 | 0.020 | 0.012 | 0.013 | 0.004 | 0.004 | 0.004 | 0.004 | 0.004 | 0.004 |
| λ | 0.011 | 0.015 | 0.331 | 0.018 | 1.476 | 2.473 | 1.318 | 1.409 | 0.016 | 0.100 | 0.014 | 0.014 | 0.012 | 0.013 |
| Log likelihood | 11.07 | 37.16 | 25.14 | 56.25 | 78.08 | 82.21 | 88.45 | 88.97 | 99.55 | 100.00 | 99.80 | 99.800 | 99.245 | 100.30 |
Note: σv is the estimate of the standard deviation of the idiosyncratic component; σu is the estimate of the standard deviation of technical inefficiency; σ2 is the estimate of the total error variance; λ is the estimate of the ratio of the standard deviation of the ineffective component to the standard deviation of idiosyncratic component; Log likelihood is a test to determine the existence of a frontier; Model 1 is economic model; Model 2 is natural resources model including mangroves area; Model 3 is natural resources model including terrestrial biodiversity; Model 4 is natural resources model including marine biodiversity; Model 5 is natural resources model including freshwater biodiversity; Model 6 is natural resources model including forest area; Model 7 is natural resources model including land area covered by forests; Model 8 is natural resources model including area of forest plantations; Model 9 is pollution model including GHG emissions; Model 10 is pollution model including CO2 emissions; Model 11 is social model including literacy rate; Model 12 is social model including the public social expenditure in education; Model 13 is social model including the public social expenditure in health; and Model 14 is social model including the public social expenditure in environmental protection. The values outside the parentheses are coefficients that determine the relationship between parameters, and the values in the parentheses are the standard errors. *** indicates significance at the P<0.01 level, ** indicates significance at the P<0.05 level, and * indicates significance at the P<0.10 level. |
| [1] |
|
| [2] |
|
| [3] |
|
| [4] |
|
| [5] |
|
| [6] |
|
| [7] |
|
| [8] |
BMZ (Federal Ministry for Economic Cooperation and Development), 2022. An Opportunity for Sustainable Development. [2023-11-17]. https://www.bmz.de/en/issues/tourism#:-:text=It%20creates%20jobs%2C%20strengthens%20the,to%20reduce%20poverty%20and%20inequality&anc=id_119280_119280.
|
| [9] |
CAF (Development Bank of Latin America and the Caribbean), 2023. Latin America’s New Voice in Global Tourism. [2023-11-22]. https://www.caf.com/en/knowledge/views/2023/01/latin-americas-new-voice-in-global-tourism/.
|
| [10] |
|
| [11] |
|
| [12] |
|
| [13] |
|
| [14] |
|
| [15] |
ECLAC (United Nations Economic Comission for Latin America and the Caribbean) , 2020. The Impact of the COVID-19 Pandemic on the Tourism Sector in Latin America and the Caribbean, and Options for a Sustainable and Resilient Recovery. [2023-11-21]. https://www.cepal.org/en/publications/46502-impact-covid-19-pandemic-tourism-sector-latin-america-and-caribbean-and-options.
|
| [16] |
ECLAC, 2022. Towards Transformation of the Development Model in Latin America and the Caribbean: Production, Inclusion and Sustainability. [2023-11-20]. https://www.cepal.org/en/publications/48305-towards-transformation-development-model-latin-america-and-caribbean-production.
|
| [17] |
ECLAC, 2023a. Statistical Databases and Publications. [2023-11-13]. https://statistics.cepal.org/portal/cepalstat/index.html?lang=en.
|
| [18] |
ECLAC, 2023b. Halfway to 2030 in Latin America and the Caribbean: Progress and Recommendations for Acceleration. [2023-11-14]. https://www.cepal.org/en/publications/48826-halfway-2030-latin-america-and-caribbean-progress-and-recommendations.
|
| [19] |
ECLAC, 2023c. Sustainable Tourism. [2023-08-13]. https://biblioguias.cepal.org/c.php?g=1041479&p=7670186.
|
| [20] |
|
| [21] |
|
| [22] |
|
| [23] |
|
| [24] |
|
| [25] |
|
| [26] |
GIZ (German Society for International Cooperation), 2021. Inclusion and Tourism. Analysis and Practical Approaches for Development Cooperation Projects. [2023-11-15]. https://www.giz.de/de/downloads/giz2021-en-inclusion-tourism.pdf.
|
| [27] |
GIZ, 2022. Adaptation to Climate Change in the Tourism Sector. [2023-08-18]. https://www.giz.de/en/worldwide/66805.html.
|
| [28] |
Global Sustainable Tourism Council, 2021. GSTC Criteria Overview. [2023-10-28]. https://www.gstcouncil.org/gstc-criteria/.
|
| [29] |
|
| [30] |
|
| [31] |
|
| [32] |
IDB (Intermaerican Development Bank), 2020. Extreme Outlier: The Pandemic’s Unprecedented Shock to Tourism in Latin America and the Caribbean. [2023-10-19]. https://publications.iadb.org/en/extreme-outlier-pandemics-unprecedented-shock-tourism-latin-america-and-caribbean.
|
| [33] |
|
| [34] |
|
| [35] |
|
| [36] |
|
| [37] |
|
| [38] |
|
| [39] |
|
| [40] |
|
| [41] |
|
| [42] |
|
| [43] |
|
| [44] |
|
| [45] |
|
| [46] |
|
| [47] |
|
| [48] |
|
| [49] |
|
| [50] |
|
| [51] |
|
| [52] |
|
| [53] |
OECD (Organisation for Economic Co-operation and Development), 2017. Policy Statement - Tourism Policies for Sustainable and Inclusive Growth. [2023-08-29]. https://www.oecd-ilibrary.org/docserver/tour-2018-2-en.pdf?expires=1728900624&id=id&accname=guest&checksum=AAFA950C E5A92954F153A342C537189F.
|
| [54] |
OECD, 2021. Managing Tourism Development for Sustainable and Inclusive Recovery. [2023-08-12]. https://www.oecd-ilibrary.org/docserver/b062f603-en.pdf?expires=1681082246&id=id&accname=guest&checksum=0EA2874BC1CD6929C55AF72AF08267CA.
|
| [55] |
OECD, 2024. Key Tourism Indicators. [2024-01-22]. https://www.oecd-ilibrary.org/economics/data/oecd-tourism-statistics/key-tourism-indicators_e5d0c450-en.
|
| [56] |
|
| [57] |
|
| [58] |
|
| [59] |
|
| [60] |
|
| [61] |
|
| [62] |
|
| [63] |
|
| [64] |
|
| [65] |
|
| [66] |
|
| [67] |
The One Planet Network, 2022. Tourism Climate Action. Climate Change & Tourism. [2023-08-17]. https://www.oneplanetnetwork.org/programmes/sustainable-tourism/glasgow-declaration/climatechange-tourism.
|
| [68] |
|
| [69] |
|
| [70] |
UNEP (United Nations Environment Program), UNWTO (World Tourism Organization), 2005. Making Tourism More Sustainable - A Guide for Policy Makers. [2023-11-13]. https://www.e-unwto.org/doi/book/10.18111/9789284408214.
|
| [71] |
UNEP, 2022. Tourism. [2023-11-13]. https://www.unep.org/explore-topics/resource-efficiency/what-we-do/responsible-industry/tourism.
|
| [72] |
UNWTO, 2023. Tourism Statistics Database. [2023-11-13]. https://www.unwto.org/tourism-statistics/tourism-statistics-database.
|
| [73] |
|
| [74] |
World Economic Forum, 2020. Latin America’s Tourism Industry Must Address Long-Standing Shortfalls to Bounce Back after COVID-19. [2023-09-21]. https://www.weforum.org/press/2020/07/latin-america-s-tourism-industry-must-address-long-standing-shortfalls-to-bounce-back-after-covid-19/.
|
| [75] |
WTO (World Trade Organization) , 2010. Tourism and Biodiversity - Achieving Common Goals Towards Sustainability. [2023-08-26]. https://www.e-unwto.org/doi/book/10.18111/9789284413713.
|
| [76] |
WTTC (World Travel & Tourism Council), 2021a. A Net Zero Roadmap for Travel & Tourism Proposing a New Target Framework for the Travel & Tourism Sector. [2023-11-13]. https://www.unep.org/events/publication-launch/net-zero-roadmap-travel-and-tourism-proposing-new-target-framework-travel.
|
| [77] |
WTTC, 2021b. Travel & Tourism. As a Catalyst for Social Impact. [2024-03-23]. https://researchhub.wttc.org/product/travel-and-tourism-as-a-catalyst-for-social-impact.
|
| [78] |
WTTC, 2023. Travel & Tourism. Economic Impact 2023 Report. [2023-11-11]. https://uploads-ssl.webflow.com/6329bc97af73223b575983ac/64e6244d08528e654e406de6_EIR2023-Global-Trends-compressed%20(1).pdf.
|
| [79] |
|
| [80] |
|
| [81] |
|
| [82] |
|
| [83] |
|
| [84] |
|
| [85] |
|
| [86] |
|
| [87] |
|
/
| 〈 |
|
〉 |