
Impact of geopolitical risk, GDP, inflation, interest rate, and trade openness on foreign direct investment: Evidence from five Southeast Asian countries
Received date: 2023-08-21
Revised date: 2024-03-27
Accepted date: 2024-11-10
Online published: 2025-08-13
Historically, geopolitical risk (GPR) has posed significant challenges to international economic, social, and political frameworks. This study investigated how internal GPR in the selected five Southeast Asian countries (Indonesia, South Korea, Malaysia, the Philippines, and Thailand) influences foreign direct investment (FDI) during 1996-2019. The stationarity of the data was assessed using the Augmented Dickey-Fuller (ADF) unit root test, which shows that the data became stationary after the first difference. The Kao, Pedroni, and Westerlund cointegration tests were employed to examine long-term cointegration among the selected variables (FDI, GPR index (GPRI), gross domestic product (GDP), inflation, interest rate, and trade openness (TOP)). The results indicated that these variables have a long-term cointegration. Consequently, regression analysis using the Pooled Ordinary Least Squares (OLS) regression, fixed effect, random effect, Arellano-Bond dynamic panel-data estimation, and system generalized moment method (GMM) revealed that GPRI and TOP negatively impacted FDI in the selected five Southeast Asian countries. At the same time, GDP, inflation, and interest rate positively influenced FDI in these countries. Because FDI is crucial to shaping a country’s macroeconomic structure, this study recommends that governments and central banks of the selected five Southeast Asian countries should implement policies and strategies to encourage foreign investments.
Md. Shaddam HOSSAIN , Liton Chandra VOUMIK , Tahsin Tabassum AHMED , Mehnaz Binta ALAM , Zabin TASMIM . Impact of geopolitical risk, GDP, inflation, interest rate, and trade openness on foreign direct investment: Evidence from five Southeast Asian countries[J]. Regional Sustainability, 2024 , 5(4) : 100177 . DOI: 10.1016/j.regsus.2024.100177
Table 1 Description of selected variables. |
| Variable | Abbreviation | Description | Unit | Logarithmic form | Sources |
|---|---|---|---|---|---|
| Foreign direct investment | FDI | Net foreign direct investment | USD | lnFDI | World Bank (2019) |
| Gross domestic product | GDP | The total value of all final goods and services produced by a country or region in a given period of time | USD | lnGDP | World Bank (2019) |
| Inflation | INF | GDP deflator | % | lnINF | World Bank (2019) |
| Interest rate | IR | Lending rate minus deposit rate | % | lnIR | World Bank (2019) |
| Trade openness | TOP | The ratio of exports plus imports to GDP | - | lnTOP | World Bank (2019) |
| Geopolitical risk index | GPRI | The 12-month GPRI is summed to obtain its annual GPRI | - | lnGPRI | Caldara and Iacoviello (2018, 2022) |
Note: - means the variable is dimensionless. |
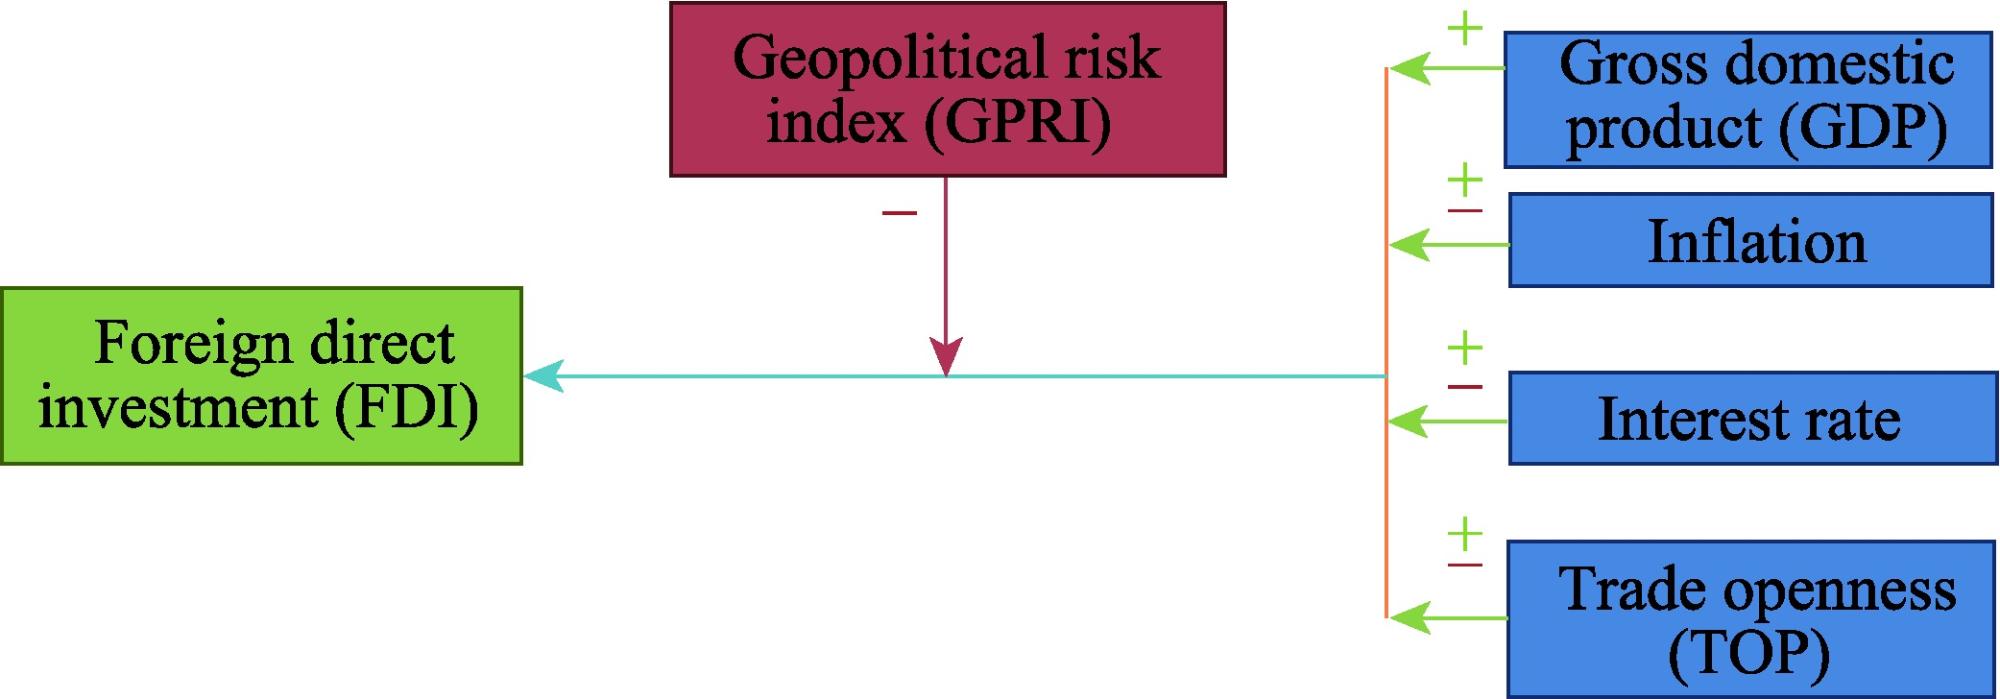
Fig. 1. Theoretical framework of this study. The arrow represents the hypothesized direction of the impact of independent variable on dependent variable. - means a negative effect and + means a positive effect. |
Table 2 Pesaran heterogeneity test results. |
| Test statistic value | P-value | |
|---|---|---|
| Delta | -0.817 | 0.414 |
| Adjusted Delta | -1.173 | 0.241 |
Table 3 Augmented Dickey-Fuller (ADF) unit root test results of variables. |
| Variable | Statistic method | P-value | |
|---|---|---|---|
| At the level | At the first difference | ||
| lnFDI | Inverse chi-squared | 6.7705 | 27.0383*** |
| Inverse normal | 0.6366 | -2.9633*** | |
| Inverse logit | 0.6337 | -3.0813*** | |
| Modified inverse chi2 | -0.7221 | 3.8099*** | |
| lnGDP | Inverse chi-squared | 19.3300 | 15.2167** |
| Inverse normal | 0.4458 | -1.5009* | |
| Inverse logit | 0.1045 | -1.4431* | |
| Modified inverse chi2 | 2.0862 | 1.1665** | |
| lnINF | Inverse chi-squared | 1.9961 | 16.2151* |
| Inverse normal | 1.7555 | -2.4326*** | |
| Inverse logit | 1.6656 | -2.5275** | |
| Modified inverse chi2 | -1.7897 | 1.3897* | |
| lnIR | Inverse chi-squared | 51.7097 | 38.4702*** |
| Inverse normal | -2.2478 | -4.0519*** | |
| Inverse logit | -5.3770 | -4.6261*** | |
| Modified inverse chi2 | 9.3266 | 6.3661*** | |
| lnTOP | Inverse chi-squared | 19.4291 | 18.3896** |
| Inverse normal | -1.3891 | -1.9994** | |
| Inverse logit | -1.6804 | -1.9755** | |
| Modified inverse chi2 | 2.1084 | 1.8760** | |
| lnGPRI | Inverse chi-squared | 19.1246 | 15.7659* |
| Inverse normal | -2.0146 | -1.7415** | |
| Inverse logit | -1.9860 | -1.6286** | |
| Modified inverse chi2 | 2.0403 | 1.2893* | |
Note: ***, **, and * denote the significance at the 1%, 5%, and 10% levels, respectively. |
Table 4 Cointegration test results. |
| Cointegration test | Statistic value | P-value | |
|---|---|---|---|
| Kao cointegration test | Modified Dickey-Fuller | -1.4311 | 0.0762 |
| Dickey-Fuller | -2.7701 | 0.0028 | |
| ADF | -0.8027 | 0.2111 | |
| Unadjusted modified Dickey-Fuller | -7.7260 | 0.0000 | |
| Unadjusted Dickey-Fuller | -5.3771 | 0.0000 | |
| Pedroni cointegration test | Modified Phillips-Perron | 0.5995 | 0.2744 |
| Phillips-Perron | -3.2228 | 0.0006 | |
| ADF | -3.5676 | 0.0002 | |
| Westerlund cointegration test | Variance ratio | -0.9778 | 0.0164 |
Table 5 Regression analysis results of the selected variables. |
| Variable | Pooled ordinary least squares (OLS) regression | Fixed effect | Random effect | Arellano-Bond dynamic panel-data estimation | System generalized moment method (GMM) |
|---|---|---|---|---|---|
| lnFDI | - | - | - | -0.0980 | -0.0690 |
| lnGDP | 0.2960** | 1.9360*** | 0.2960** | 0.9640** | 0.4110** |
| lnINF | -0.0430 | 0.0580*** | -0.0430 | 0.0090** | 0.0220** |
| lnIR | -0.0340 | 1.2720*** | -0.0340 | 0.2980** | -0.0640 |
| lnTOP | -0.3040** | -0.6590*** | -0.3040** | -0.4620** | -0.2030* |
| lnGPRI | -0.3210** | -0.1770** | -0.3200** | -0.2000*** | -0.2690*** |
| Constant | 14.6510*** | -29.3110*** | 14.6510*** | -0.5660 | 13.0620*** |
| R2 | 0.2790 | 0.1347 | 0.2790 | - | - |
| F-statistic | 4.8110 | 11.0500 | - | - | - |
| Probability (F-statistic) | 0.0010 | 0.0000 | - | - | - |
| Wald chi2 | - | - | 24.0300 | 16.7000 | 27.8000 |
| Probability>chi2 | - | - | 0.0000 | 0.0100 | 0.0000 |
| Hausman test statistic (chi2)=22.2300; Probability (Probability>chi2)=0.0002 | |||||
Note: ***, **, and * denote the significance at the 1%, 5%, and 10% levels, respectively. - means no value. |
| [1] |
|
| [2] |
|
| [3] |
|
| [4] |
|
| [5] |
|
| [6] |
|
| [7] |
|
| [8] |
|
| [9] |
|
| [10] |
|
| [11] |
|
| [12] |
|
| [13] |
|
| [14] |
|
| [15] |
|
| [16] |
|
| [17] |
|
| [18] |
|
| [19] |
|
| [20] |
|
| [21] |
|
| [22] |
|
| [23] |
|
| [24] |
|
| [25] |
|
| [26] |
|
| [27] |
|
| [28] |
|
| [29] |
|
| [30] |
|
| [31] |
|
| [32] |
|
| [33] |
|
| [34] |
|
| [35] |
|
| [36] |
|
| [37] |
|
| [38] |
|
| [39] |
|
| [40] |
|
| [41] |
|
| [42] |
|
| [43] |
|
| [44] |
|
| [45] |
|
| [46] |
|
| [47] |
|
| [48] |
OECD (Organisation for Economic Co-operation and Development), 1996. OECD Benchmark Definition of Foreign Direct Investment. Paris: OECD.
|
| [49] |
|
| [50] |
|
| [51] |
|
| [52] |
|
| [53] |
|
| [54] |
|
| [55] |
|
| [56] |
|
| [57] |
|
| [58] |
|
| [59] |
|
| [60] |
|
| [61] |
|
| [62] |
|
| [63] |
|
| [64] |
|
| [65] |
|
| [66] |
World Economic Forum, 2017. The Global Risks Report 2017. [2023-06-10]. http://wef.ch/risks2017.
|
| [67] |
|
/
| 〈 |
|
〉 |