
Evolutionary characteristics of export trade network in the Arctic region
Received date: 2023-12-30
Revised date: 2024-07-16
Accepted date: 2024-11-25
Online published: 2025-08-13
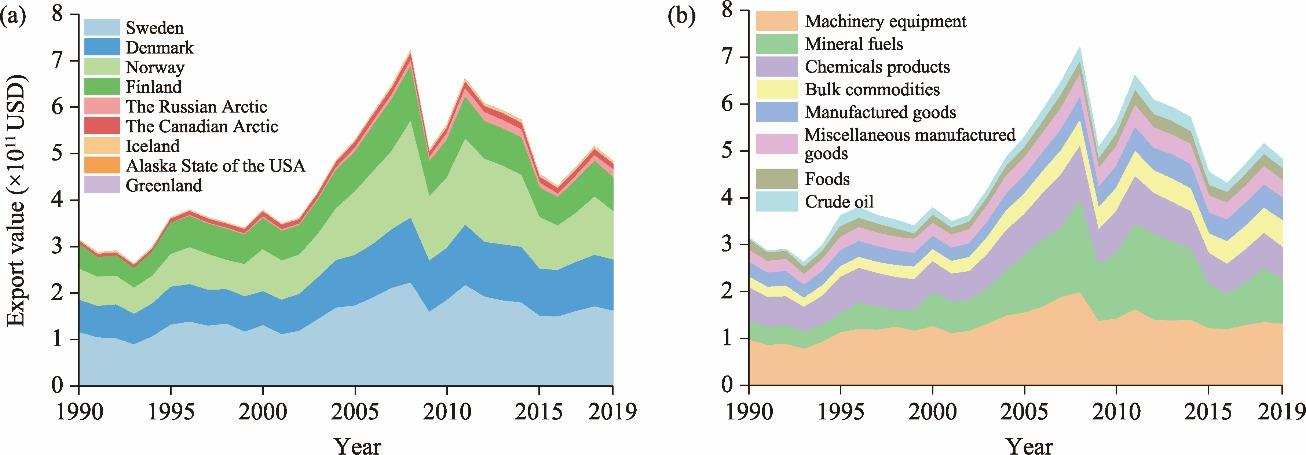
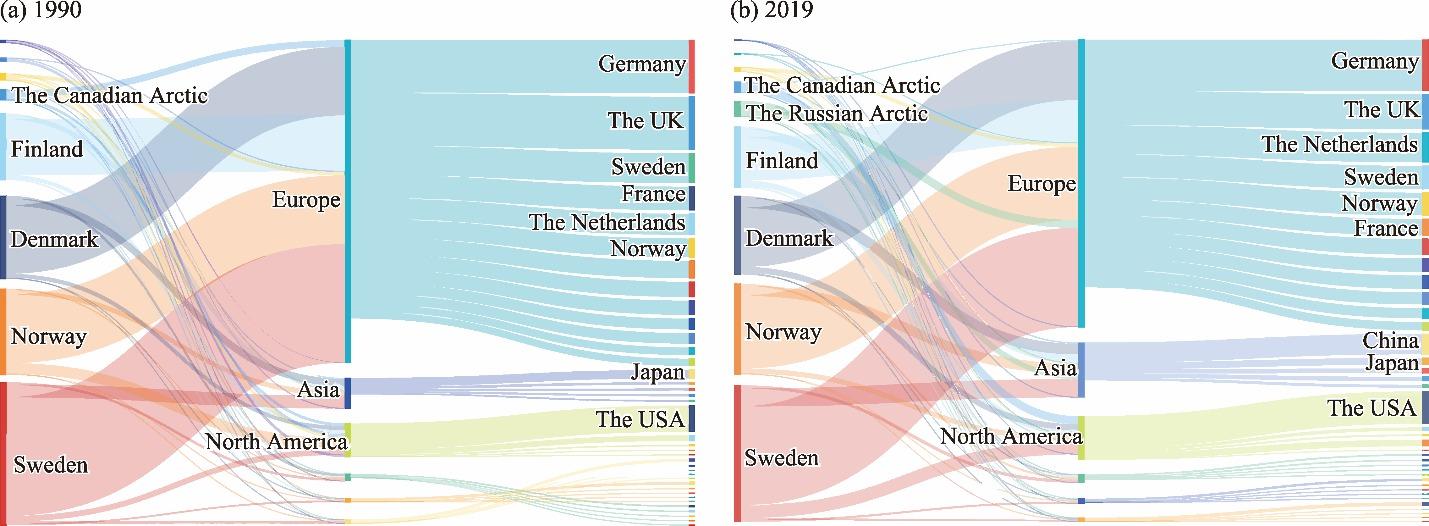
The economic potential induced by environmental changes in the Arctic region garnered substantial interest, which positions Arctic trade as a crucial indicator in forecasting the impacts of climate change on the global economy. Nevertheless, attention devoted to the evolving dynamics of trade in the Arctic region remains scarce. In this study, we constructed export trade network in the Arctic region (including Denmark, Finland, Sweden, Norway, Iceland, the Canadian Arctic, the Russian Arctic, Alaska State of the USA, and Greenland) from 1990 to 2019 and analyzed its topology and evolutionary characteristics through complex network theory. We used a structural entropy index based on the distribution of the number of trading partners and the degree of trade concentration to assess export diversity, while we also utilized a revealed comparative advantage index to evaluate product export competitiveness using the share of trade volume of each type of product. The results indicate that the total export trade in the Arctic region increased by 53.4% during 1990-2019, with the most significant growth observed in the exports of chemical products and mineral fuels. The increasing complexity of trade network in the Arctic region resulted in the region’s export destinations no longer being concentrated on a few major countries and regions. The proportion of exports from the Arctic region to Europe decreased by 13.5%, while the proportion of exports from the Arctic region to Asia and North America increased by 6.8% and 3.1%, respectively. The Arctic region exhibited clear distinctions in the range of flows of different products, and its export trade was becoming increasingly diversified. Although differences in comparative advantages between products within individual countries or regions have narrowed, substantial gaps persist. The findings of this study can enhance the comprehensive understanding of the significance and function of Arctic trade activities within the global economy, providing a scientific basis for addressing the associated challenges and opportunities in the context of climate change.
MA Xing , QIANG Wenli , WANG Shijin , LIU Jiayi , Arunima MALIK , LI Mengyu , WANG Xiang . Evolutionary characteristics of export trade network in the Arctic region[J]. Regional Sustainability, 2024 , 5(4) : 100176 . DOI: 10.1016/j.regsus.2024.100176
Fig. 1. Changes in export strength (a) and export structure (b) in the Arctic region from 1990 to 2019. |
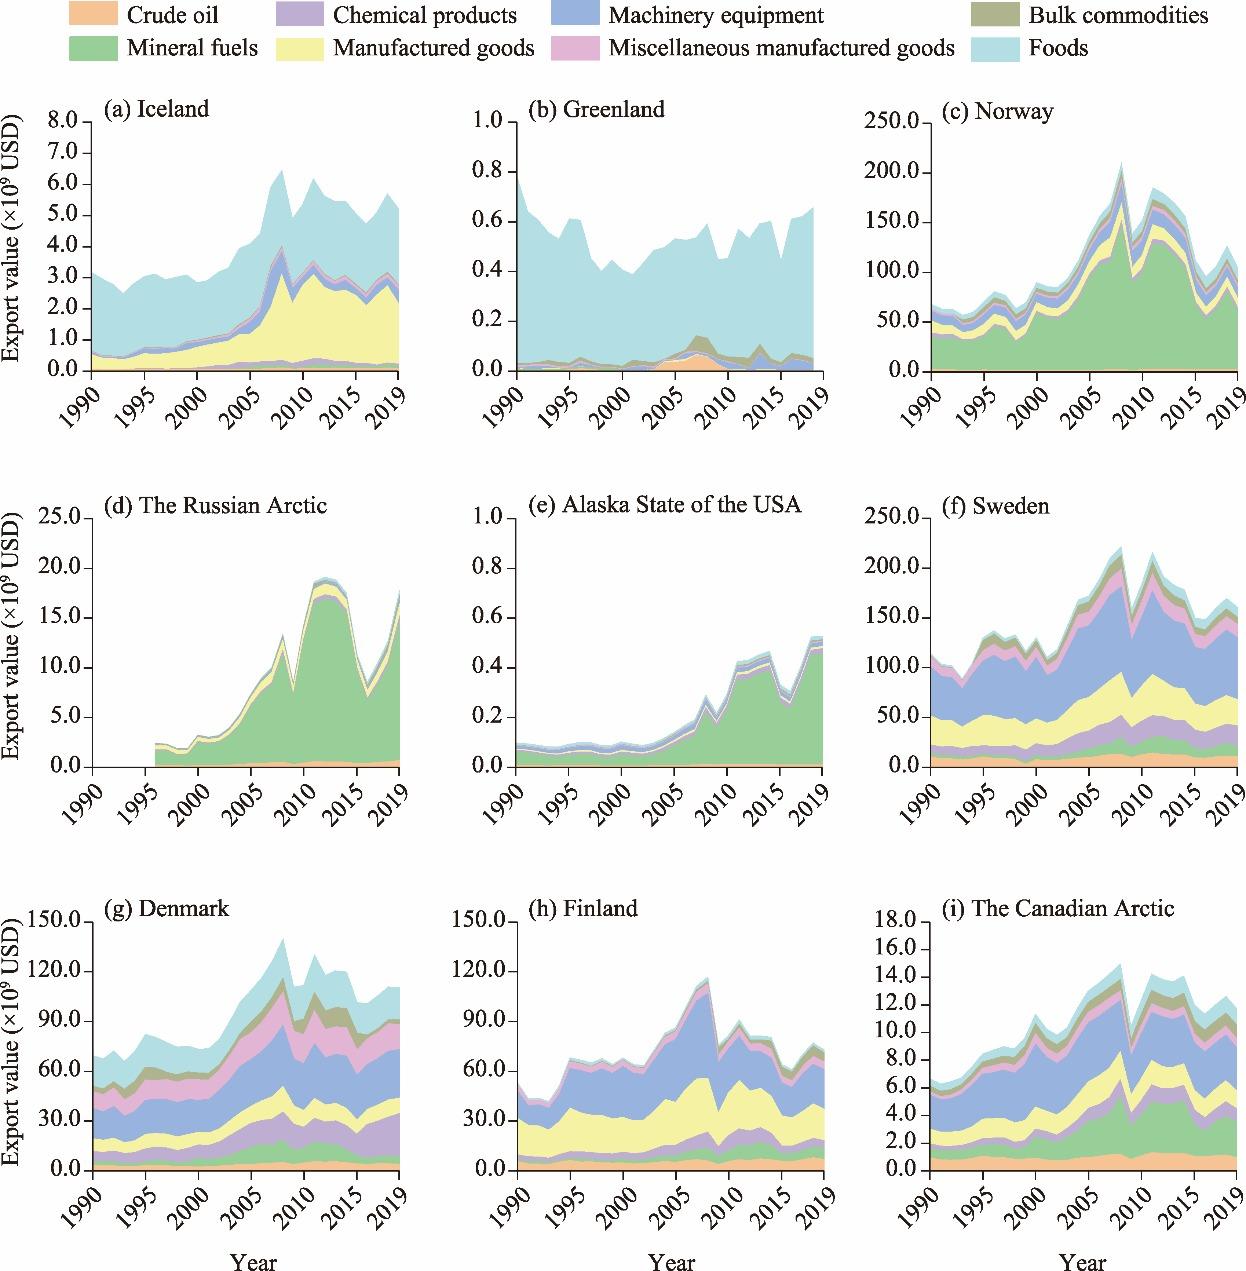
Fig. 2. Trends in product categories exported from the Arctic region by country or region from 1990 to 2019. (a), Iceland; (b), Greenland; (c), Norway; (d), the Russian Arctic; (e), Alaska State of the USA; (f), Sweden; (g), Denmark; (h), Finland; (i), the Canadian Arctic. |
Table 1 Evolution of export trade network in the Arctic region. |
| Year | Overall network parameter | Node degree | Node strength | |||||
|---|---|---|---|---|---|---|---|---|
| Node | Link | Density | Total flow (×109 USD) | Mean K | Kout | Mean Sout (×109 USD) | Mean Sin (×109 USD) | |
| 1990 | 200 | 1138 | 0.78 | 314.6 | 144.5 | 192.0 | 35.0 | 1.6 |
| 2000 | 232 | 1546 | 0.80 | 377.5 | 172.7 | 223.0 | 42.0 | 1.7 |
| 2010 | 235 | 1622 | 0.84 | 560.8 | 179.9 | 235.0 | 62.3 | 2.4 |
| 2019 | 235 | 1637 | 0.85 | 482.4 | 183.6 | 235.0 | 53.6 | 2.1 |
Note: Node represents the number of regions involved in the network. Link represents the number of trade links between regions. Density is the ratio of the number of links in the network to the maximum number of potential links. Total flow is the sum of trade volumes of all links in the network. Mean K represents the node degree of average export (the number of export destinations). Kout represents the node degree of the total export (the number of total export destinations). Mean Sout represents the average outbound strength of nodes. Mean Sin represents the average inbound strength of nodes. |
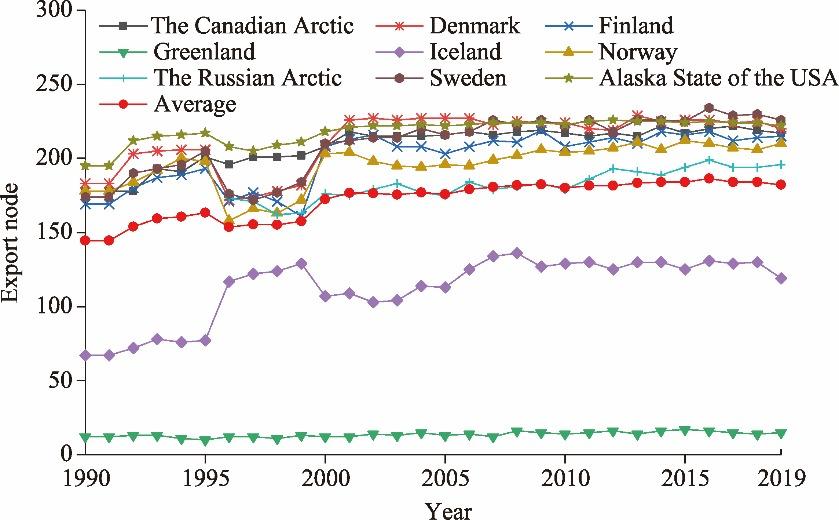
Fig. 3. Changes in the node degree of export trade in the Arctic region from 1990 to 2019. |
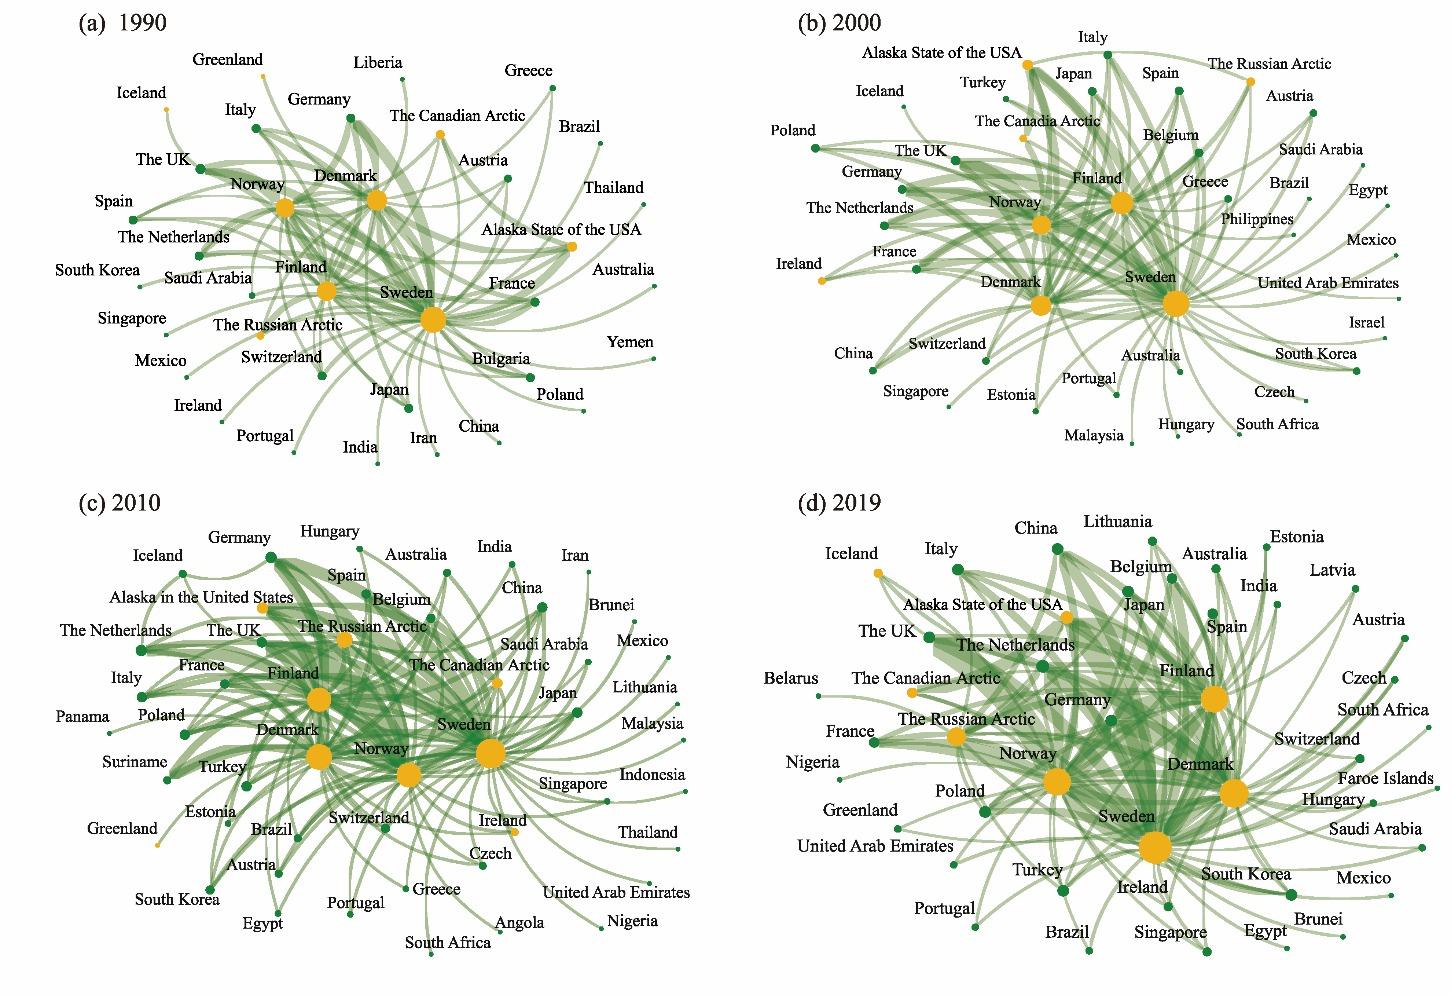
Fig. 4. Strength and structure of export trade in the Arctic region in 1990 (a), 2000 (b), 2010 (c), and 2019 (d). Yellow nodes indicate export regions, while green nodes denote import regions. Node size indicates the trade intensity; the larger the point, the greater the trade intensity. The width of connecting lines indicates the intensity of trade flow between nodes; the thicker the connecting line, the stronger the intensity of trade flow. |
Fig. 5. Export trade network of the Arctic region to continents and major countries in 1990 (a) and 2019 (b). |
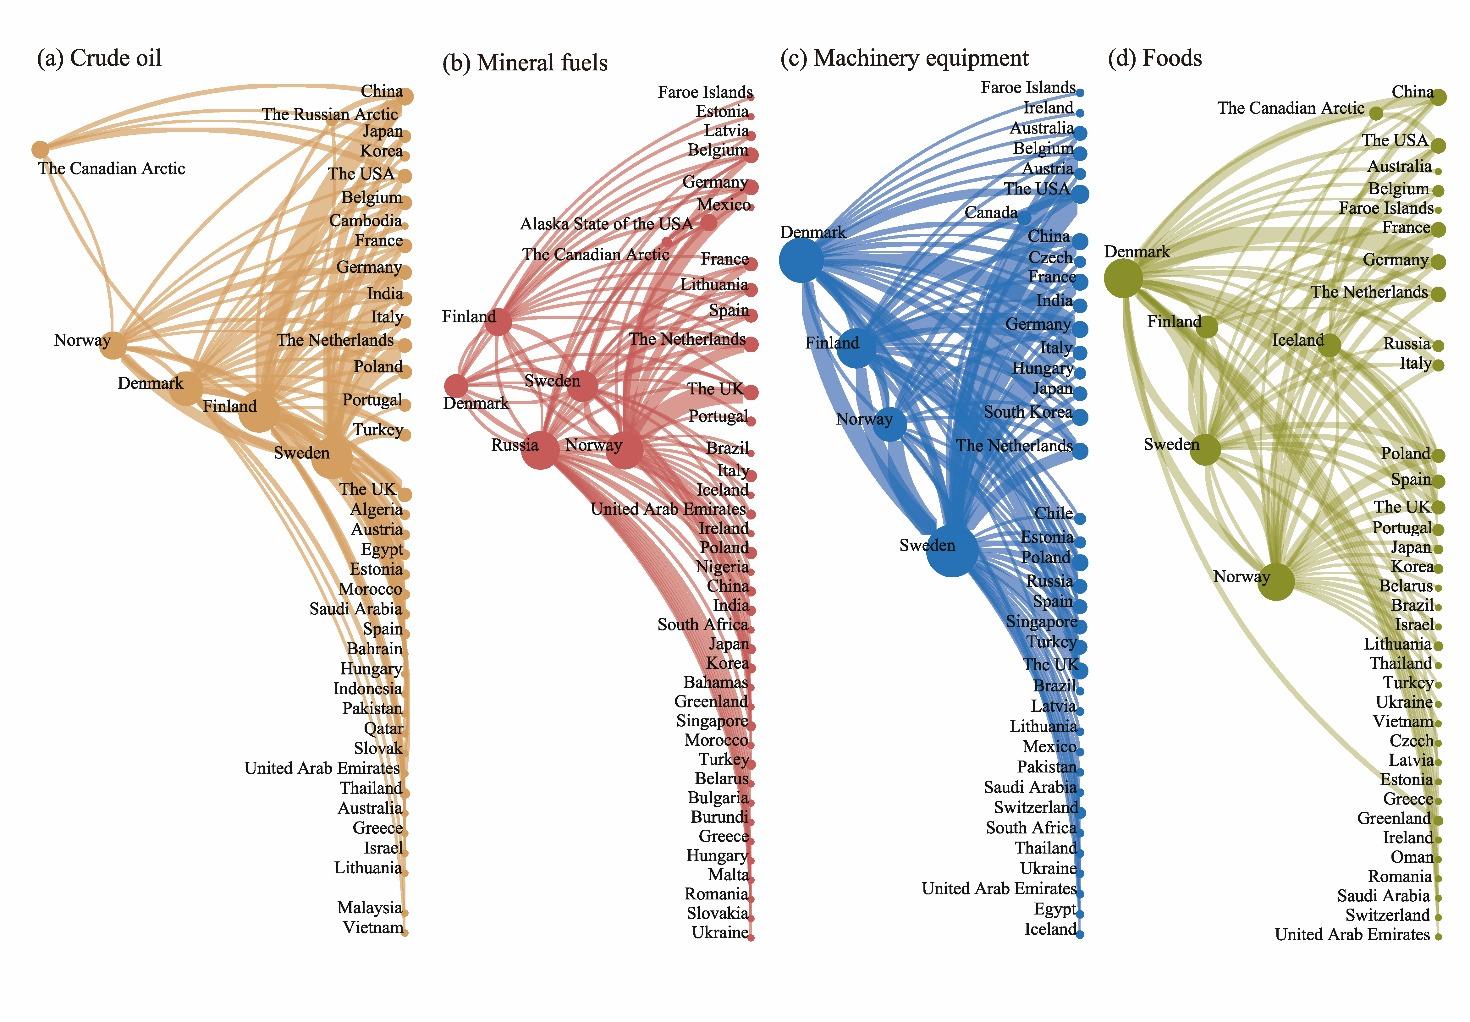
Fig. 6. Export trade network of primary products from the Arctic region in 2019. (a), crude oil; (b), mineral fuels; (c), machinery equipment; (d), foods. The size of each node indicates the trade intensity. Large nodes represent high trade intensity. The width of the connecting line indicates the intensity of trade flow between the nodes. The thicker the connecting line, the greater the intensity of trade flow between two nodes. |
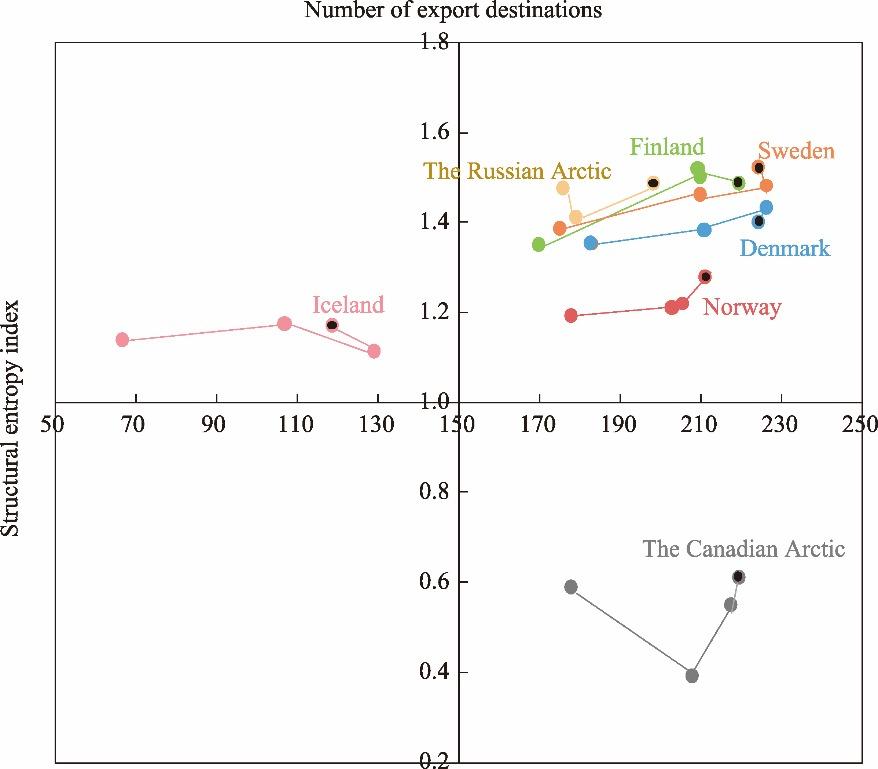
Fig. 7. Nodal degree and structural entropy distribution of export trade in the Arctic region from 1990, 2000, 2010 to 2019. The connecting line indicates the change in the position of the point, and the black dot represents the position in 2019. |
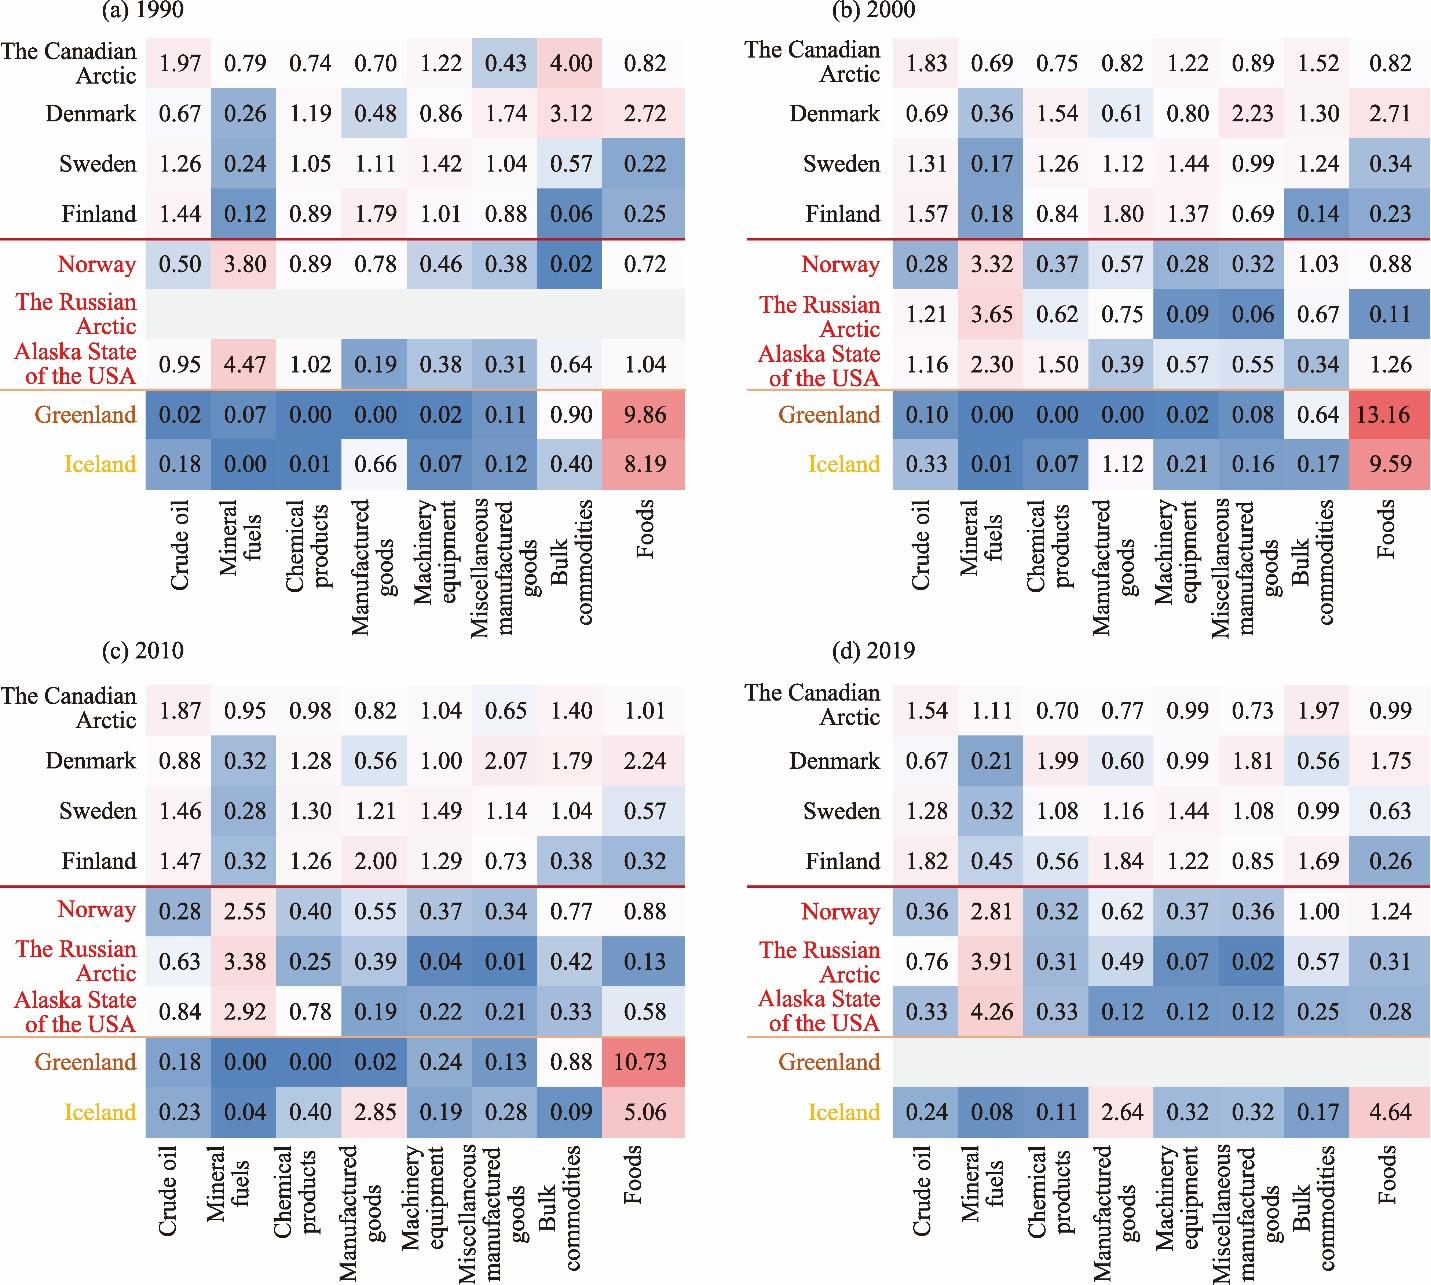
Fig. 8. Matrix of comparative advantage of the exports of the Arctic region. (a), 1990; (b), 2000; (c), 2010; (d), 2019. Red and blue colors indicate relatively high and low comparative advantage, respectively. The shaded area represents the year for which no trade data were recorded. |
| [1] |
ACIA (Arctic Climate Impact Assessment), 2004. Impacts of a Warming Arctic:Arctic Climate Impact Assessment. London: Cambridge University Press.
|
| [2] |
|
| [3] |
AMAP (Arctic Monitoring and Assessment Programme), 2021. Arctic Climate Change Update 2021:Key Trends and Impacts. Summary for Policy-makers. In: Arctic Council Repository: Arctic Monitoring and Assessment Programme. Tromsø, Norway.
|
| [4] |
|
| [5] |
|
| [6] |
|
| [7] |
|
| [8] |
|
| [9] |
|
| [10] |
|
| [11] |
|
| [12] |
|
| [13] |
|
| [14] |
|
| [15] |
|
| [16] |
|
| [17] |
|
| [18] |
|
| [19] |
|
| [20] |
|
| [21] |
|
| [22] |
|
| [23] |
|
| [24] |
|
| [25] |
|
| [26] |
|
| [27] |
|
| [28] |
|
| [29] |
|
| [30] |
|
| [31] |
|
| [32] |
|
| [33] |
|
| [34] |
|
| [35] |
National Research Council, 2015. Arctic Matters:The Global Connection to Changes in the Arctic. Washington: The National Academies Press.
|
| [36] |
|
| [37] |
PAME (Protection of the Arctic Marine Environment), , 2024. The Increase in Arctic Shipping 2013-2023. In: Arctic Council Repository: Arctic Shipping Status Reports. Tromsø, Norway.
|
| [38] |
|
| [39] |
|
| [40] |
|
| [41] |
|
| [42] |
|
| [43] |
|
| [44] |
|
| [45] |
|
| [46] |
|
| [47] |
|
| [48] |
|
| [49] |
|
| [50] |
|
| [51] |
|
| [52] |
|
| [53] |
|
| [54] |
|
| [55] |
|
/
| 〈 |
|
〉 |