
Relationship between environmental performance indices and blockchain-based sustainability-focused companies: Evidence from countries in Europe and America
Received date: 2024-08-09
Revised date: 2025-01-02
Accepted date: 2025-03-14
Online published: 2025-05-21
Copyright
As the world grapples with increasing environmental challenges, innovative technologies are essential for promoting sustainability and accountability. This study examined the impact of environmental performance indices (EPIs) on the growth and investment trends of blockchain-based sustainability-focused companies in 15 countries (Belgium, Czechia, Denmark, Estonia, Finland, France, Germany, Italy, Norway, Poland, Sweden, Spain, Switzerland, the United Kingdom, and the United States) from Europe and America during 2010-2022. This study used the negative binomial regression model to assess the relationship between EPIs and blockchain-based sustainability-focused companies based on the data from the CrunchBase and EarthData. Results indicated that in ecosystem vitality, national terrestrial biome protection efforts were negatively correlated the formation of blockchain-based sustainability-focused companies, while global terrestrial biome protection efforts and marine protected areas had a positive impact on the formation of these companies and the number of funding rounds. In environmental health, PM2.5 exposure had a positive impact on the number of funding rounds. Conversely, pollutants such as sulfur dioxide (SO2) and ocean plastics deterred the formation of blockchain-based sustainability-focused companies and reduced the number of funding rounds. In climate change performance, adjusted emission growth rate for carbon dioxide (CO2), adjusted emission growth rate for F-gases, and adjusted emission growth rate for black carbon had a significantly positive impact on the formation of blockchain-based sustainability-focused companies. Conversely, adjusted emission growth rate for Nitrous Oxide (N2O) and projected greenhouse gas emissions in 2050 negatively affected the formation of these companies. These findings highlight the dual role of EPIs as driving factors and barriers in the development and investment of blockchain-based sustainability-focused companies in countries from Europe and America.
Hussain Mohi-ud-Din QADRI , Hassnian ALI , Atta UL MUSTAFA . Relationship between environmental performance indices and blockchain-based sustainability-focused companies: Evidence from countries in Europe and America[J]. Regional Sustainability, 2025 , 6(2) : 100214 . DOI: 10.1016/j.regsus.2025.100214
Table 1 Description of variables. |
| Variable | Category | Sub-category | Unit | Transformation | |
|---|---|---|---|---|---|
| Dependent variable | Blockchain technology | - | Formation of blockchain-based sustainability-focused companies | - | None |
| Number of funding rounds | - | None | |||
| Number of lead investors | Persons | None | |||
| Independent variable | Ecosystem vitality | Biodiversity and habitat | National terrestrial biome protection efforts | % | None |
| Global terrestrial biome protection efforts | % | None | |||
| Marine protected areas | % | None | |||
| Protected area representativeness index | - | None | |||
| Biodiversity habitat index | - | None | |||
| Species protection index | % | None | |||
| Species habitat index | % | None | |||
| Ecosystem services | Tree cover loss | % | Logarithmic transformation | ||
| Grassland loss | % | Logarithmic transformation | |||
| Wetland loss | % | Logarithmic transformation | |||
| Fishery | Fish stock status | % | Logarithmic transformation | ||
| Marine trophic index | - | Logarithmic transformation | |||
| Fish caught by trawling | % | Logarithmic transformation | |||
| Acidification | Adjusted emission growth rate for sulfur dioxide (SO2) | mg/m3 | Logarithmic transformation | ||
| Adjusted emission growth rate for nitric oxide (NO) | mg/m3 | Logarithmic transformation | |||
| Agriculture | Sustainable pesticide use | - | None | ||
| Sustainable nitrogen (N) management index | - | None | |||
| Water resources | Wastewater treatment | % | None | ||
| Environmental health | Air quality | PM2.5 exposure | mg/m3 | Logarithmic transformation | |
| Household solid fuels | Age-standardized DALYs/105 persons | Logarithmic transformation | |||
| Ozone exposure | Age-standardized DALYs/105 persons | Logarithmic transformation | |||
| Oxynitride (NOx) exposure | mg/m3 | Logarithmic transformation | |||
| SO2 exposure | mg/m3 | Logarithmic transformation | |||
| Carbon monoxide (CO) exposure | mg/m3 | Logarithmic transformation | |||
| Volatile organic compound exposure | mg/m3 | Logarithmic transformation | |||
| Sanitation and drinking water | Unsafe sanitation | Age-standardized DALYs/105 persons | Logarithmic transformation | ||
| Unsafe drinking water | Age-standardized DALYs/105 persons | Logarithmic transformation | |||
| Heavy metals | Plumbum (Pb) exposure | Age-standardized DALYs/105 persons | Logarithmic transformation | ||
| Waste management | Controlled solid waste | % | None | ||
| Recycling | % | None | |||
| Ocean plastics | 106 t | Logarithmic transformation | |||
| Climate change performance | - | Adjusted emission growth rate for carbon dioxide (CO2) | % | None | |
| Adjusted emission growth rate for CH4 | % | None | |||
| Adjusted emission growth rate for F-gases | % | None | |||
| Adjusted emission growth rate for Nitrous Oxide (N2O) | % | None | |||
| Adjusted emission growth rate for black carbon | % | None | |||
| Projected greenhouse gas emissions in 2050 | Gg CO2-equivalent | Logarithmic transformation | |||
| Growth rate in CO2 emissions from land cover | % | None | |||
| Greenhouse gas intensity growth rate | % | None | |||
| Greenhouse gas emissions per capita | Gg CO2-equivalent | Logarithmic transformation | |||
Note: - means no category or no unit. DALYs, disability-adjusted life-years lost rates. |
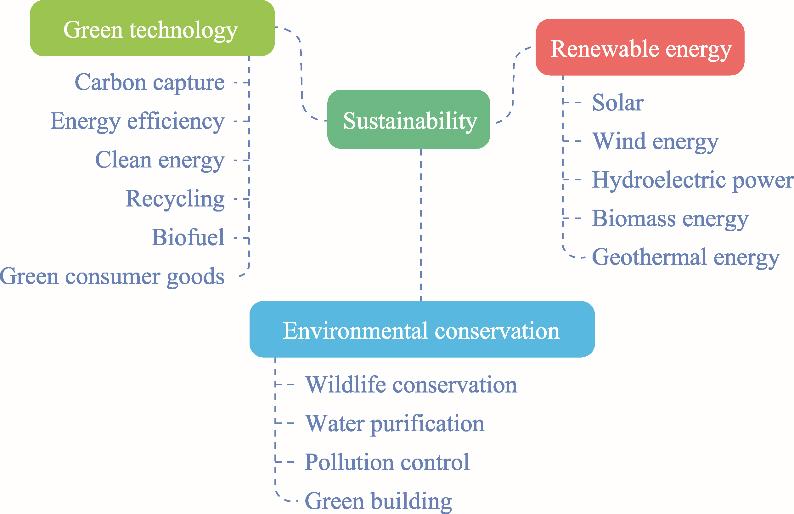
Fig. 1. Categories of companies with sustainability. |
Table 2 Results of negative binomial regression model between the formation of blockchain-based sustainability-focused companies and ecosystem vitality. |
| Category | Sub-category | Biodiversity and habitat | Ecosystem services | Fishery | Acidification | Agriculture | Water resources |
|---|---|---|---|---|---|---|---|
| Biodiversity and habitat | National terrestrial biome protection efforts | -0.523** | |||||
| (0.069) | |||||||
| Global terrestrial biome protection efforts | 0.601** | ||||||
| (0.084) | |||||||
| Marine protected areas | 0.020** | ||||||
| (0.005) | |||||||
| Protected area representativeness index | -0.001 | ||||||
| (0.009) | |||||||
| Biodiversity habitat index | -0.005 | ||||||
| (0.014) | |||||||
| Species protection index | -0.027** | ||||||
| (0.006) | |||||||
| Species habitat index | -0.005 | ||||||
| (0.013) | |||||||
| Ecosystem services | Tree cover loss | -0.008 | |||||
| (0.026) | |||||||
| Grassland loss | -0.039** | ||||||
| (0.008) | |||||||
| Wetland loss | -0.008 | ||||||
| (0.009) | |||||||
| Fishery | Fish stock status | 0.009 | |||||
| (0.011) | |||||||
| Marine trophic index | -0.019** | ||||||
| (0.009) | |||||||
| Fish caught by trawling | 0.117** | ||||||
| (0.045) | |||||||
| Acidification | Adjusted emission growth rate for SO2 | -0.064 | |||||
| (0.080) | |||||||
| Adjusted emission growth rate for NO | 0.095** | ||||||
| (0.035) | |||||||
| Agriculture | Sustainable pesticide use | -0.015 | |||||
| (0.009) | |||||||
| Sustainable N management index | 0.067** | ||||||
| (0.014) | |||||||
| Water resources | Wastewater treatment | -0.026** | |||||
| (0.008) | |||||||
| Constant | -6.954** | 3.442** | -0.400 | -2.507 | -2.962** | 2.399** | |
| (2.285) | (0.797) | (0.361) | (6.583) | (0.728) | (0.658) | ||
| lnalpha | -0.165 | 1.116** | 1.223** | 1.290** | 1.119** | 1.262** | |
| (0.278) | (0.167) | (0.166) | (0.163) | (0.173) | (0.165) | ||
| Observations | 195 | 195 | 195 | 195 | 195 | 195 | |
| AIC | 500.051 | 568.975 | 582.076 | 585.861 | 572.436 | 582.397 | |
Note: The values in parentheses represent standard errors. AIC, Akaike Information Criterion; **, significance at the P<0.05 level. |
Table 3 Results of negative binomial regression model between the number of funding rounds and ecosystem vitality. |
| Category | Sub-category | Biodiversity and habitat | Ecosystem services | Fishery | Acidification | Agriculture | Water resources |
|---|---|---|---|---|---|---|---|
| Biodiversity and habitat | National terrestrial biome protection efforts | -0.743** | |||||
| (0.134) | |||||||
| Global terrestrial biome protection efforts | 0.865** | ||||||
| (0.162) | |||||||
| Marine protected areas | 0.038** | ||||||
| (0.009) | |||||||
| Protected area representativeness index | 0.034** | ||||||
| (0.016) | |||||||
| Biodiversity habitat index | 0.009 | ||||||
| (0.020) | |||||||
| Species protection index | -0.051** | ||||||
| (0.010) | |||||||
| Species habitat index | 0.006 | ||||||
| (0.022) | |||||||
| Ecosystem services | Tree cover loss | -0.016 | |||||
| (0.043) | |||||||
| Grassland loss | -0.045** | ||||||
| (0.012) | |||||||
| Wetland loss | -0.020 | ||||||
| (0.017) | |||||||
| Fishery | Fish stock status | 0.019 | |||||
| (0.026) | |||||||
| Marine trophic index | -0.017 | ||||||
| (0.013) | |||||||
| Fish caught by trawling | 0.124 | ||||||
| (0.090) | |||||||
| Acidification | Adjusted emission growth rate for SO2 | -0.221* | |||||
| (0.121) | |||||||
| Adjusted emission growth rate for NO | 0.162** | ||||||
| (0.063) | |||||||
| Agriculture | Sustainable pesticide use | -0.031* | |||||
| (0.017) | |||||||
| Sustainable N management index | 0.073** | ||||||
| (0.023) | |||||||
| Water resources | Wastewater treatment | -0.020* | |||||
| (0.012) | |||||||
| Constant | -14.411** | 4.712** | -0.565 | 6.581 | -2.423** | 2.163** | |
| (3.996) | (1.437) | (0.551) | (8.711) | (1.082) | (1.002) | ||
| lnalpha | 1.194** | 2.108** | 2.185** | 2.204** | 2.157** | 2.256** | |
| (0.224) | (0.182) | (0.181) | (0.180) | (0.182) | (0.179) | ||
| Observations | 195 | 195 | 195 | 195 | 195 | 195 | |
| AIC | 448.210 | 497.015 | 503.611 | 502.246 | 499.718 | 504.469 | |
Note: The values in parentheses represent standard errors. *, significance at the P<0.10 level; **, significance at the P<0.05 level. |
Table 4 Results of negative binomial regression model between the number of lead investors and ecosystem vitality. |
| Category | Sub-category | Biodiversity and habitat | Ecosystem services | Fishery | Acidification | Agriculture | Water resources |
|---|---|---|---|---|---|---|---|
| Biodiversity and habitat | National terrestrial biome protection efforts | -0.551** | |||||
| (0.125) | |||||||
| Global terrestrial biome protection efforts | 0.635** | ||||||
| (0.150) | |||||||
| Marine protected areas | 0.034** | ||||||
| (0.009) | |||||||
| Protected area representativeness index | 0.004 | ||||||
| (0.019) | |||||||
| Biodiversity habitat index | 0.027 | ||||||
| (0.031) | |||||||
| Species protection index | -0.028** | ||||||
| (0.011) | |||||||
| Species habitat index | 0.017 | ||||||
| (0.026) | |||||||
| Ecosystem services | Tree cover loss | -0.083* | |||||
| (0.043) | |||||||
| Grassland loss | -0.042** | ||||||
| (0.013) | |||||||
| Wetland loss | -0.031* | ||||||
| (0.018) | |||||||
| Fishery | Fish stock status | 0.033 | |||||
| (0.023) | |||||||
| Marine trophic index | -0.037** | ||||||
| (0.016) | |||||||
| Fish caught by trawling | 0.110 | ||||||
| (0.084) | |||||||
| Acidification | Adjusted emission growth rate for SO2 | 0.026 | |||||
| (0.199) | |||||||
| Adjusted emission growth rate for NO | 0.177** | ||||||
| (0.069) | |||||||
| Agriculture | Sustainable pesticide use | -0.009 | |||||
| (0.019) | |||||||
| Sustainable N management index | 0.064** | ||||||
| (0.024) | |||||||
| Water resources | Wastewater treatment | -0.020 | |||||
| (0.014) | |||||||
| Constant | -12.025** | 5.925** | -0.460 | -19.522 | -2.808** | 2.197* | |
| (4.776) | (1.652) | (0.599) | (18.942) | (1.252) | (1.144) | ||
| lnalpha | 1.821** | 2.371** | 2.402** | 2.444** | 2.444** | 2.531** | |
| (0.221) | (0.191) | (0.192) | (0.189) | (0.191) | (0.188) | ||
| Observations | 195 | 195 | 195 | 195 | 195 | 195 | |
| AIC | 441.067 | 461.606 | 464.727 | 464.460 | 465.547 | 468.623 | |
Note: The values in parentheses represent standard errors. *, significance at the P<0.10 level; **, significance at the P<0.05 level. |
Table 5 Results of negative binomial regression model between the formation of blockchain-based sustainability-focused companies and environmental health. |
| Category | Sub-category | Air quality | Sanitation and drinking water | Heavy metals | Waste management |
|---|---|---|---|---|---|
| Air quality | PM2.5 exposure | 0.033** | |||
| (0.015) | |||||
| Household solid fuels | 0.029 | ||||
| (0.020) | |||||
| Ozone exposure | -0.032** | ||||
| (0.016) | |||||
| NOx exposure | -0.076 | ||||
| (0.054) | |||||
| SO2 exposure | -0.060** | ||||
| (0.018) | |||||
| CO exposure | 0.057* | ||||
| (0.033) | |||||
| Volatile organic compound exposure | -0.004 | ||||
| (0.012) | |||||
| Sanitation and drinking water | Unsafe sanitation | -0.165** | |||
| (0.024) | |||||
| Unsafe drinking water | 0.139** | ||||
| (0.023) | |||||
| Heavy metal | Pb exposure | -0.027* | |||
| (0.016) | |||||
| Waste management | Controlled solid waste | -0.005 | |||
| (0.050) | |||||
| Recycling | -0.015 | ||||
| (0.011) | |||||
| Ocean plastics | -0.053** | ||||
| (0.012) | |||||
| Constant | -2.059 | 2.836** | 2.628** | 2.214 | |
| (1.529) | (1.160) | (1.296) | (4.826) | ||
| lnalpha | 0.677** | 0.607** | 1.345** | 0.943** | |
| (0.203) | (0.221) | (0.161) | (0.180) | ||
| Observations | 195 | 195 | 195 | 195 | |
| AIC | 548.731 | 541.845 | 589.318 | 558.890 | |
Note: The values in parentheses represent standard errors. *, significance at the P<0.10 level; **, significance at the P<0.05 level. |
Table 6 Results of negative binomial regression model between the number of funding rounds and environmental health. |
| Category | Sub-category | Air quality | Sanitation and drinking water | Heavy metals | Waste management |
|---|---|---|---|---|---|
| Air quality | PM2.5 exposure | 0.049* | |||
| (0.027) | |||||
| Household solid fuels | 0.027 | ||||
| (0.036) | |||||
| Ozone exposure | -0.037 | ||||
| (0.023) | |||||
| NOx exposure | -0.172 | ||||
| (0.107) | |||||
| SO2 exposure | -0.063** | ||||
| (0.030) | |||||
| CO exposure | 0.081 | ||||
| (0.053) | |||||
| Volatile organic compound exposure | -0.005 | ||||
| (0.021) | |||||
| Sanitation and drinking water | Unsafe sanitation | -0.215** | |||
| (0.043) | |||||
| Unsafe drinking water | 0.215** | ||||
| (0.040) | |||||
| Heavy metal | Pb exposure | -0.023 | |||
| (0.025) | |||||
| Waste management | Controlled solid waste | 0.021 | |||
| (0.082) | |||||
| Recycling | -0.010 | ||||
| (0.017) | |||||
| Ocean plastics | -0.066** | ||||
| (0.020) | |||||
| Constant | -2.391 | 0.516 | 2.502 | 0.020 | |
| (2.316) | (1.938) | (2.070) | (7.893) | ||
| lalpha | 1.767** | 1.757** | 2.285** | 1.985** | |
| (0.199) | (0.200) | (0.178) | (0.190) | ||
| Observations | 195 | 195 | 195 | 195 | |
| AIC | 484.534 | 473.646 | 506.354 | 490.878 | |
Note: The values in parentheses represent standard errors. *, significance at the P<0.10 level; **, significance at the P<0.05 level. |
Table 7 Results of negative binomial regression model between the number of lead investors and environmental health. |
| Category | Sub-category | Air quality | Sanitation and drinking water | Heavy metals | Waste management |
|---|---|---|---|---|---|
| Air quality | PM2.5 exposure | 0.058** | |||
| (0.029) | |||||
| Household solid fuels | 0.031 | ||||
| (0.039) | |||||
| Ozone exposure | -0.036 | ||||
| (0.026) | |||||
| NOx exposure | -0.182 | ||||
| (0.111) | |||||
| SO2 exposure | -0.060* | ||||
| (0.034) | |||||
| CO exposure | 0.111* | ||||
| (0.067) | |||||
| Volatile organic compound exposure | -0.007 | ||||
| (0.025) | |||||
| Sanitation and drinking water | Unsafe sanitation | -0.171** | |||
| (0.041) | |||||
| Unsafe drinking water | 0.172** | ||||
| (0.038) | |||||
| Heavy metals | Pb exposure | -0.023 | |||
| (0.028) | |||||
| Waste management | Controlled solid waste | 0.087 | |||
| (0.103) | |||||
| Recycling | -0.016 | ||||
| (0.023) | |||||
| Ocean plastics | -0.057** | ||||
| (0.024) | |||||
| Constant | -4.945 | 0.451 | 2.503 | -6.391 | |
| (3.109) | (2.267) | (2.280) | (9.849) | ||
| lnalpha | 2.075** | 2.149** | 2.555** | 2.304** | |
| (0.203) | (0.205) | (0.187) | (0.196) | ||
| Observations | 195 | 195 | 195 | 195 | |
| AIC | 453.454 | 449.669 | 470.026 | 459.437 | |
Note: The values in parentheses represent standard errors. *, significance at the P<0.10 level; **, significance at the P<0.05 level. |
Table 8 Results of negative binomial regression model between blockchain technology and climate change performance. |
| Sub-category | Formation of blockchain-based sustainability-focused companies | Number of funding rounds | Number of lead investors |
|---|---|---|---|
| Adjusted emission growth rate for CO2 | 0.057** | 0.122 | 0.078** |
| (0.021) | (0.220) | (0.039) | |
| Adjusted emission growth rate for CH4 | 0.004 | 0.028 | 0.025 |
| (0.010) | (0.085) | (0.017) | |
| Adjusted emission growth rate for F-gases | 0.021** | 0.106 | 0.048** |
| (0.008) | (0.087) | (0.017) | |
| Adjusted emission growth rate for N2O | -0.020* | -0.006 | -0.015 |
| (0.012) | (0.191) | (0.025) | |
| Adjusted emission growth rate for black carbon | 0.035** | 0.245 | 0.096** |
| (0.016) | (0.193) | (0.049) | |
| Projected greenhouse gas emissions in 2050 | -0.030** | -0.120 | -0.042** |
| (0.008) | (0.092) | (0.015) | |
| Growth rate in CO2 emissions from land cover | -0.003 | -0.049 | -0.007 |
| (0.007) | (0.073) | (0.013) | |
| Greenhouse gas intensity growth rate | 0.034 | 0.345 | 0.077 |
| (0.023) | (0.251) | (0.055) | |
| Greenhouse gas emissions per capita | -0.039** | 0.041 | -0.041** |
| (0.011) | (0.091) | (0.019) | |
| Constant | -7.193** | -42.449* | -20.350** |
| (2.106) | (24.470) | (6.879) | |
| lnalpha | 0.592** | 4.142** | 1.975** |
| (0.210) | (0.160) | (0.202) | |
| Observations | 195 | 195 | 195 |
| AIC | 546.779 | 1717.363 | 447.493 |
Note: The values in parentheses represent standard errors. *, significance at the P<0.10 level; **, significance at the P<0.05 level. |
| [1] |
|
| [2] |
|
| [3] |
|
| [4] |
|
| [5] |
|
| [6] |
|
| [7] |
|
| [8] |
|
| [9] |
|
| [10] |
|
| [11] |
|
| [12] |
|
| [13] |
|
| [14] |
|
| [15] |
|
| [16] |
|
| [17] |
|
| [18] |
|
| [19] |
|
| [20] |
|
| [21] |
|
| [22] |
|
| [23] |
|
| [24] |
|
| [25] |
|
| [26] |
|
| [27] |
|
| [28] |
|
| [29] |
|
| [30] |
|
| [31] |
|
| [32] |
|
| [33] |
|
| [34] |
|
| [35] |
|
| [36] |
|
| [37] |
|
| [38] |
|
| [39] |
|
| [40] |
|
| [41] |
|
| [42] |
|
| [43] |
|
| [44] |
|
| [45] |
|
| [46] |
|
| [47] |
|
| [48] |
|
| [49] |
|
| [50] |
|
| [51] |
|
| [52] |
|
| [53] |
|
| [54] |
|
| [55] |
|
| [56] |
|
| [57] |
|
| [58] |
|
| [59] |
|
| [60] |
|
| [61] |
|
| [62] |
|
| [63] |
|
| [64] |
|
| [65] |
|
/
| 〈 |
|
〉 |