
Analysis of environmental protection priority zones and their impacts on urban planning in small- and medium-sized cities of Indonesia
Received date: 2024-06-19
Revised date: 2025-04-04
Accepted date: 2025-05-06
Online published: 2025-05-21
Copyright
Urbanization in small- and medium-sized cities has often been overlooked in urban studies. Research on urbanization has predominantly focused on large metropolitan cities; however, urbanization in small- and medium-sized cities also contributes to the acceleration of urban sprawl. Urban growth boundary (UGB) is an ecological approach designed to limit urban development. This study aimed to analyze environmental protection priority zones by combining ecological quality and sensitivity indices to identify the areas suitable for UGB implementation. Tegal City and its surrounding areas (including Tegal and Brebes regencies) of Indonesia were selected as the study area. The ecological quality index was calculated using the normalized difference vegetation index, humidity index, land surface temperature, and normalized difference bare soil index. These indices were subsequently subjected to principal component analysis (PCA) to extract orthogonal factors, which were summed to derive the final index value. In parallel, we mapped and evaluated ecological sensitivity based on spatial planning policies and regulations. The results revealed that ecological quality in Tegal and Brebes regencies was predominantly categorized as good and very good ecological quality, whereas Tegal City exhibited moderate and poor ecological quality. Additionally, over 45.00% of the area in Tegal and Brebes regencies demonstrated very high ecological sensitivity. Consequently, more than 50.00% of the area in Tegal and Brebes regencies, along with 27.00% of Tegal City, were classified as ecological constraint zone, making them potential regions for UGB development. The UGB is expected to curtail urban expansion, promote compact city planning, and preserve ecosystem services to achieve urban sustainability. This study implies that planning small- and medium-sized cities is important to prevent urban sprawl and maintain environmental health. Designing UGB to limit urban expansion should be enhanced by better knowledge about its ecological functions in supporting urban sustainability.
Rizal IMANA , Andrea Emma PRAVITASARI , Didit Okta PRIBADI . Analysis of environmental protection priority zones and their impacts on urban planning in small- and medium-sized cities of Indonesia[J]. Regional Sustainability, 2025 , 6(2) : 100211 . DOI: 10.1016/j.regsus.2025.100211
Table 1 Data types and sources. |
| Data type | Source |
|---|---|
| Map of protected rice fields | Regulation number 1589/SK-HK.02.01/XII/2021 issued by Ministry of Agrarian Affairs and Spatial Planning Republic of Indonesia (2021) |
| Map of green open spaces | Regulation number 1 of 2021 issued by Tegal City Government (2021) |
| Map of forest areas | Regulation number 6605/MENLHK-PKTL/KUH/PLA.2/11/2019 issued by Ministry of Environment and Forestry Republic of Indonesia (2019) |
| Map of river and lake boundaries | Indonesian Geospatial Information Agency (2020) |
| Map of shoreline | Indonesian Geospatial Information Agency (2020) |
| Map of disaster-prone areas | Indonesia’s National Board for Disaster Management (2024) |
| Slope map | Earth Resources Observation and Science (EROS) Center (2018) |
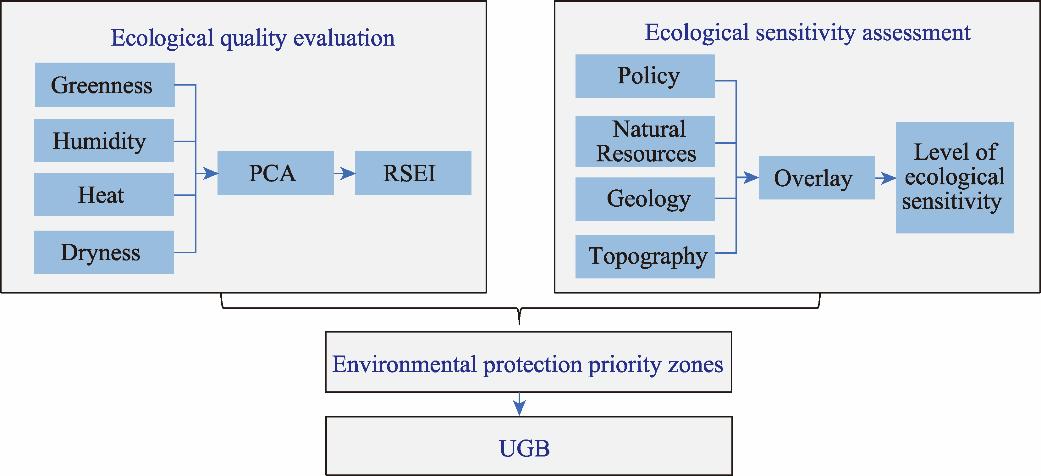
Fig. 1. Methodological flowchart used in this study. PCA, principal component analysis; RSEI, remote sensing ecological index; UGB, urban growth boundary. |
Table 2 Indicators, variables, and weights used for assessing ecological sensitivity. |
| Indicator | Variable | Ecological sensitivity level | Data source | ||||
|---|---|---|---|---|---|---|---|
| Non- ecological sensitivity | Light ecological sensitivity | Moderate ecological sensitivity | High ecological sensitivity | Very high ecological sensitivity | |||
| Policy | Area of protected rice fields | Rice fields (5) | Regulation number 1589/SK-HK.02.01/XII/2021 issued by Ministry of Agrarian Affairs and Spatial Planning Republic of Indonesia (2021) | ||||
| Area of green open spaces | Green open spaces (5) | Regulation number 1 of 2021 issued by Tegal City Government (2021) | |||||
| Natural resources | Forest areas | Permanent production forest and limited production forest (4) | Nature reserves and protected forests (5) | Regulation number 6605/MEN LHK-PKTL/KUH/PLA.2/11/ 2019 issued by Ministry of Environment and Forestry Republic of Indonesia (2019) | |||
| Riverbanks | Within a distance of 0-50 m (5) | Regulation number 28/PRT/M/ 2015 issued by Ministry of Public Works and Housing Republic of Indonesia (2015) | |||||
| Lake borders | Within a distance of 0-100 m (5) | Regulation number 28/PRT/M/ 2015 issued by Ministry of Public Works and Housing Republic of Indonesia (2015) | |||||
| Coastal line | Within a distance of 0-100 m (5) | Regulation number 51 of 2016 issued by Presidential Regulation of the Republic of Indonesia (2016) | |||||
| Geology | Flood hazard | Low with a score of 0.0-0.3 (2) | Moderate with a score of 0.3-0.6 (3) | High with a score of 0.6-1.0 (4) | Indonesia’s National Board for Disaster Management (2024) | ||
| Volcanic eruption hazard | Low with a score of 0.0-0.3 (2) | Moderate with a score of 0.3-0.6 (3) | High with a score of 0.6-1.0 (4) | Indonesia’s National Board for Disaster Management (2024) | |||
| Landslide and soil movement hazard | Low with a score of 0.0-0.3 (2) | Moderate with a score of 0.3-0.6 (3) | High with a score of 0.6-1.0 (4) | Indonesia’s National Board for Disaster Management (2024) | |||
| Topography | Slope | 0.00%- 8.00% (1) | 8.00%- 15.00% (2) | 25.00%- 30.00% (3) | 30.00%- 45.00% (4) | >45.00% (5) | Rahmad et al. (2018) |
Note: In the column of ecological sensitivity level, the value in parentheses represents the weight. |
Table 3 Determination of environmental protection priority zones. |
| Classification | First priority zone (ecological constraint zone) | Second priority zone (conditional urban development zone) | Third priority zone (urban development zone) |
|---|---|---|---|
| Ecological evaluation based on remote sensing ecological index (RSEI) results | Very good ecological quality | Good ecological quality | Average ecological quality, poor ecological quality, and very poor ecological quality |
| Ecological sensitivity assessment results | Very high ecological sensitivity | High ecological sensitivity | Moderate ecological sensitivity, light ecological sensitivity, and non- ecological sensitivity |
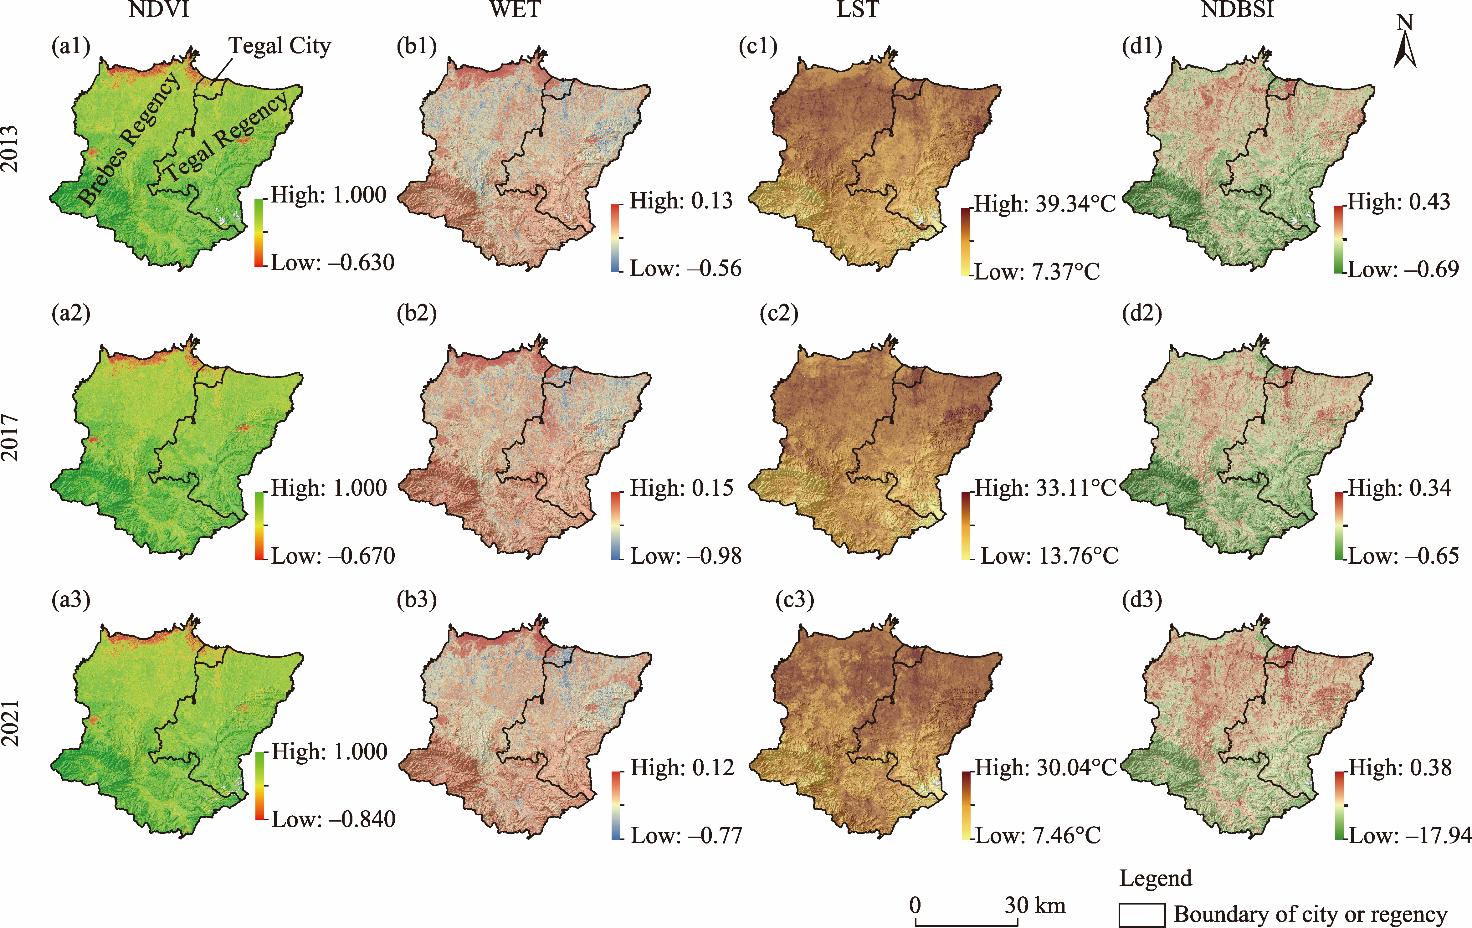
Fig. 2. Spatial distributions of ecological evaluation indicators in 2013, 2017, and 2021. (a1-a3), normalized difference vegetation index (NDVI); (b1-b3), wetness index (WET); (c1-c3), land surface temperature (LST); (d1-d3), normalized difference bare soil index (NDBSI). |
Table 4 Correlation between principal components and original RSEI variables. |
| Year | Indicator | PC1 | PC2 | PC3 | PC4 |
|---|---|---|---|---|---|
| 2013 | NDVI | 0.70495 | 0.67911 | 0.00771 | 0.20442 |
| WET | 0.17190 | -0.42692 | 0.35910 | 0.81193 | |
| LST | -0.39045 | 0.41461 | 0.81965 | -0.06184 | |
| NDBSI | -0.56661 | 0.42970 | -0.44628 | 0.54328 | |
| Eigenvalue | 0.01472 | 0.00463 | 0.00154 | 0.00037 | |
| Contribution rate (%) | 69.22 | 21.77 | 7.26 | 1.73 | |
| 2017 | NDVI | 0.61882 | 0.77001 | -0.10776 | 0.11191 |
| WET | 0.10345 | -0.19069 | 0.21934 | 0.95122 | |
| LST | -0.47513 | 0.48719 | 0.73247 | -0.01956 | |
| NDBSI | -0.61694 | 0.36519 | -0.63542 | 0.28683 | |
| Eigenvalue | 0.01742 | 0.00447 | 0.00180 | 0.00020 | |
| Contribution rate (%) | 72.89 | 18.72 | 7.51 | 0.85 | |
| 2021 | NDVI | 0.74901 | 0.66139 | 0.03352 | 0.02059 |
| WET | 0.12055 | -0.18854 | 0.97036 | 0.09123 | |
| LST | -0.65073 | 0.72590 | 0.22261 | -0.00778 | |
| NDBSI | -0.03162 | 0.00927 | -0.08787 | 0.99559 | |
| Eigenvalue | 0.01078 | 0.00380 | 0.00087 | 0.00000 | |
| Contribution rate (%) | 69.74 | 24.60 | 5.62 | 0.02 |
Note: PC1, the first principal component; PC2, the second principal component; PC3, the third principal component; PC4, the fourth principal component; NDVI, normalized difference vegetation index; WET, wetness index; LST, land surface temperature; NDBSI, normalized difference bare soil index. |
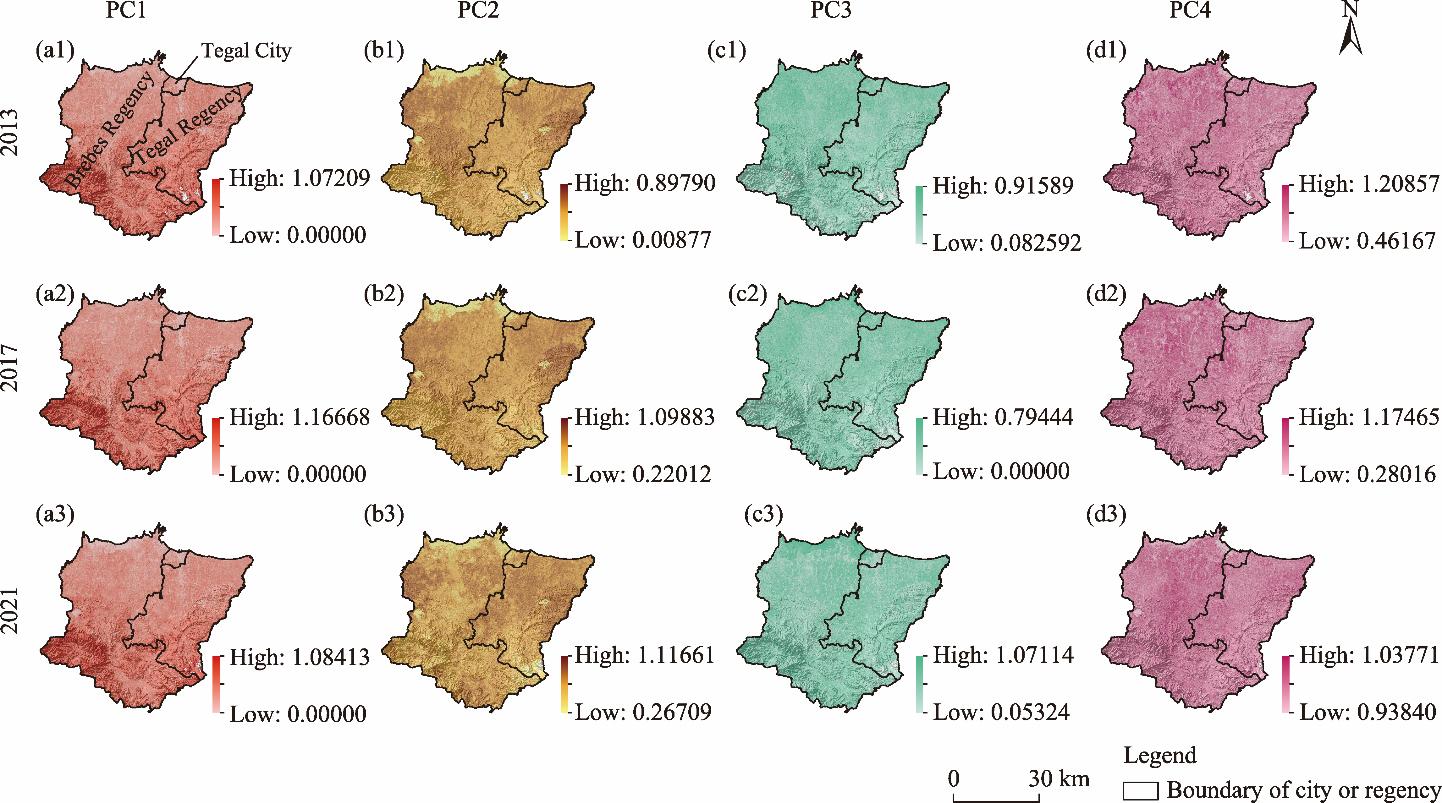
Fig. 3. Spatial distributions of PC1 (a1-a3), PC2 (b1-b3), PC3 (c1-c3), and PC4 (d1-d3) in 2013, 2017, and 2021. PC1, the first principal component; PC2, the second principal component; PC3, the third principal component; PC4, the fourth principal component. |
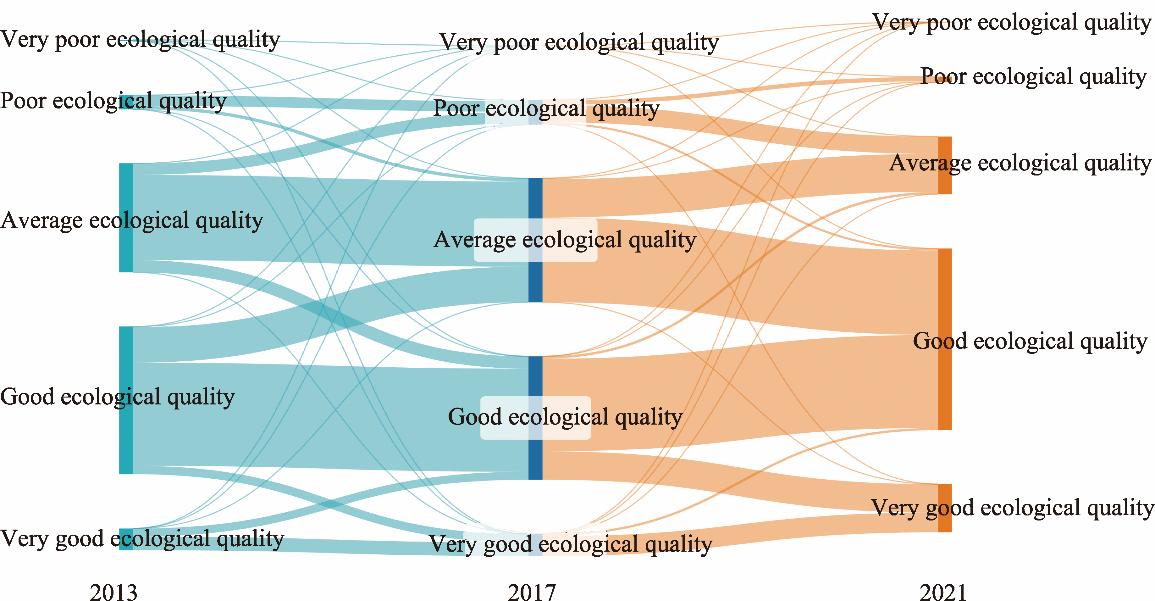
Table 5 Ecological evaluation results using RSEI in 2013, 2017, and 2021. |
| Region | Category of ecological quality index | Area (hm2) | ||
|---|---|---|---|---|
| 2013 | 2017 | 2021 | ||
| Whole study area | Very poor ecological quality | 1175.85 | 332.27 | 471.59 |
| Poor ecological quality | 13,066.90 | 22,256.58 | 5233.41 | |
| Average ecological quality | 101,050.70 | 115,041.58 | 53,772.58 | |
| Good ecological quality | 137,357.97 | 114,732.69 | 168,572.09 | |
| Very good ecological quality | 20,128.74 | 20,417.05 | 44,730.50 | |
| Tegal City | Very poor ecological quality | 9.38 | 48.20 | 1.41 |
| Poor ecological quality | 1313.42 | 1842.18 | 429.05 | |
| Average ecological quality | 1966.43 | 1538.99 | 2631.43 | |
| Good ecological quality | 619.15 | 476.13 | 846.15 | |
| Very good ecological quality | 0.16 | 3.02 | 0.49 | |
| Brebes Regency | Very poor ecological quality | 1164.95 | 273.58 | 471.49 |
| Poor ecological quality | 10,080.52 | 14,594.61 | 4809.04 | |
| Average ecological quality | 64,831.65 | 71,186.74 | 34,722.44 | |
| Good ecological quality | 82,224.69 | 71,576.72 | 99,726.02 | |
| Very good ecological quality | 16,065.98 | 16,736.14 | 34,638.79 | |
| Tegal Regency | Very poor ecological quality | 10.90 | 58.70 | 0.10 |
| Poor ecological quality | 2986.37 | 7661.97 | 424.37 | |
| Average ecological quality | 36,219.06 | 43,854.84 | 19,050.14 | |
| Good ecological quality | 55,133.28 | 43,155.96 | 68,846.07 | |
| Very good ecological quality | 4062.76 | 3680.91 | 10,091.70 | |
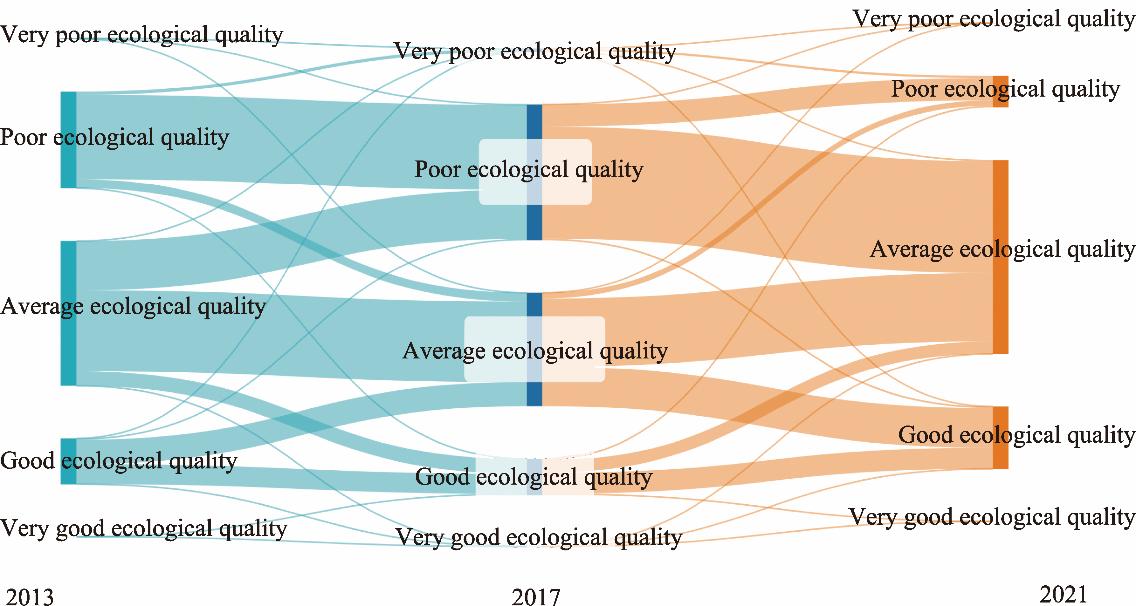
Fig. 4. Changes in ecological quality from 2013 to 2021 in Tegal City. |
Fig. 5. Changes in ecological quality from 2013 to 2021 in Brebes and Tegal regencies. |
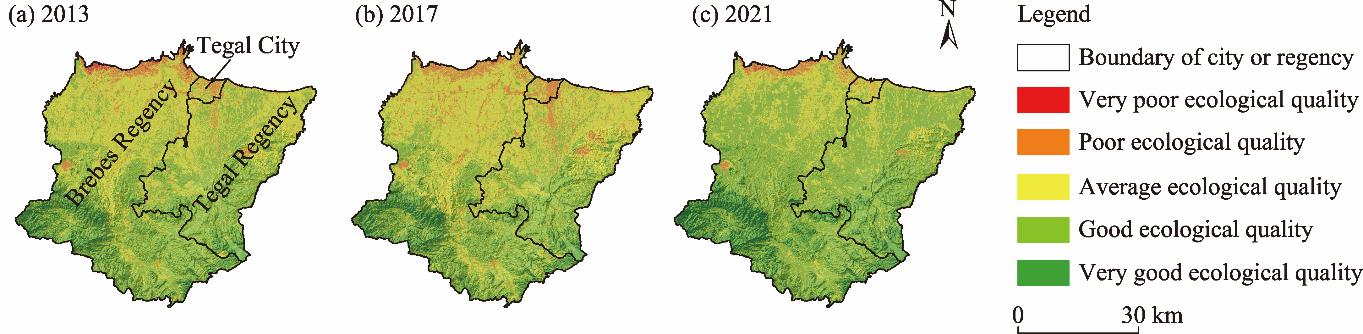
Fig. 6. Spatial distributions of different categories of ecological quality index in 2013 (a), 2017 (b), and 2021 (c). |
Table 6 Ecological sensitivity analysis results. |
| Ecological sensitivity level | Brebes Regency | Tegal City | Tegal Regency | |||
|---|---|---|---|---|---|---|
| Area (hm2) | Percentage in the total area (%) | Area (hm2) | Percentage in the total area (%) | Area (hm2) | Percentage in the total area (%) | |
| Very high ecological sensitivity | 84,068.04 | 48.21 | 1070.00 | 27.38 | 45,922.62 | 46.66 |
| High ecological sensitivity | 60,318.82 | 34.59 | 1281.41 | 32.79 | 28,425.61 | 28.88 |
| Moderate ecological sensitivity | 16,260.66 | 9.33 | 1249.94 | 31.98 | 8439.45 | 8.58 |
| Light ecological sensitivity | 5564.77 | 3.19 | 85.80 | 2.20 | 3916.39 | 3.98 |
| Non-ecological sensitivity | 8155.52 | 4.68 | 221.37 | 5.66 | 11,708.31 | 11.90 |
| Total | 174,367.79 | 100.00 | 3908.53 | 100.00 | 98,412.38 | 100.00 |
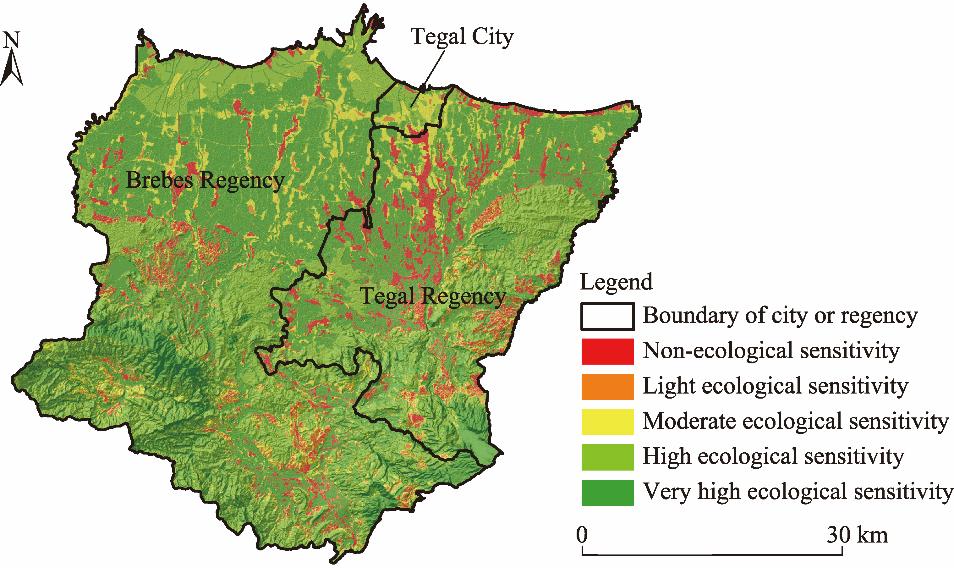
Fig. 7. Spatial distribution of ecological sensitivity in the study area. |
Table 7 Area and percentage of ecological constraint zone, conditional urban development zone, and urban development zone in Tegal City, Brebes Regency, and Tegal Regency. |
| Environmental protection priority zone | Tegal City | Brebes Regency | Tegal Regency | |||
|---|---|---|---|---|---|---|
| Area (hm2) | Percentage in the total area (%) | Area (hm2) | Percentage in the total area (%) | Area (hm2) | Percentage in the total area (%) | |
| First priority zone (ecological constraint zone) | 1070.01 | 27.38 | 107,644.67 | 61.73 | 52,355.96 | 53.20 |
| Second priority zone (conditional urban development zone) | 1468.47 | 37.57 | 56,293.57 | 32.28 | 36,549.42 | 37.14 |
| Third priority zone (urban development zone) | 1370.05 | 35.05 | 10,429.55 | 5.98 | 9507.00 | 9.66 |
| Total | 3908.53 | 100.00 | 174,367.79 | 100.00 | 98,412.38 | 100.00 |
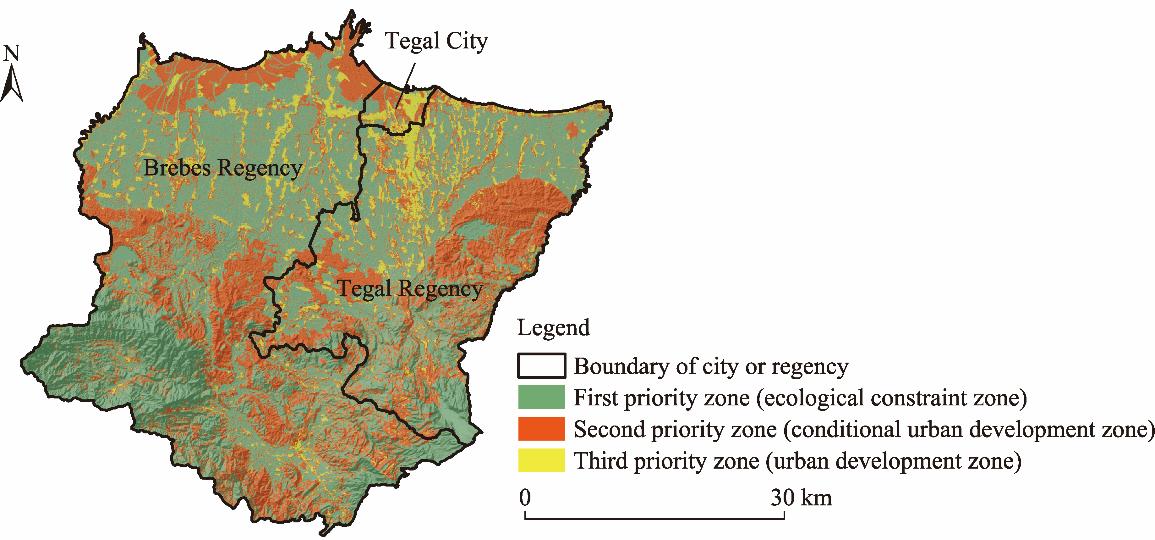
Fig. 8. Spatial distribution of different environmental protection priority zones in this study area. |
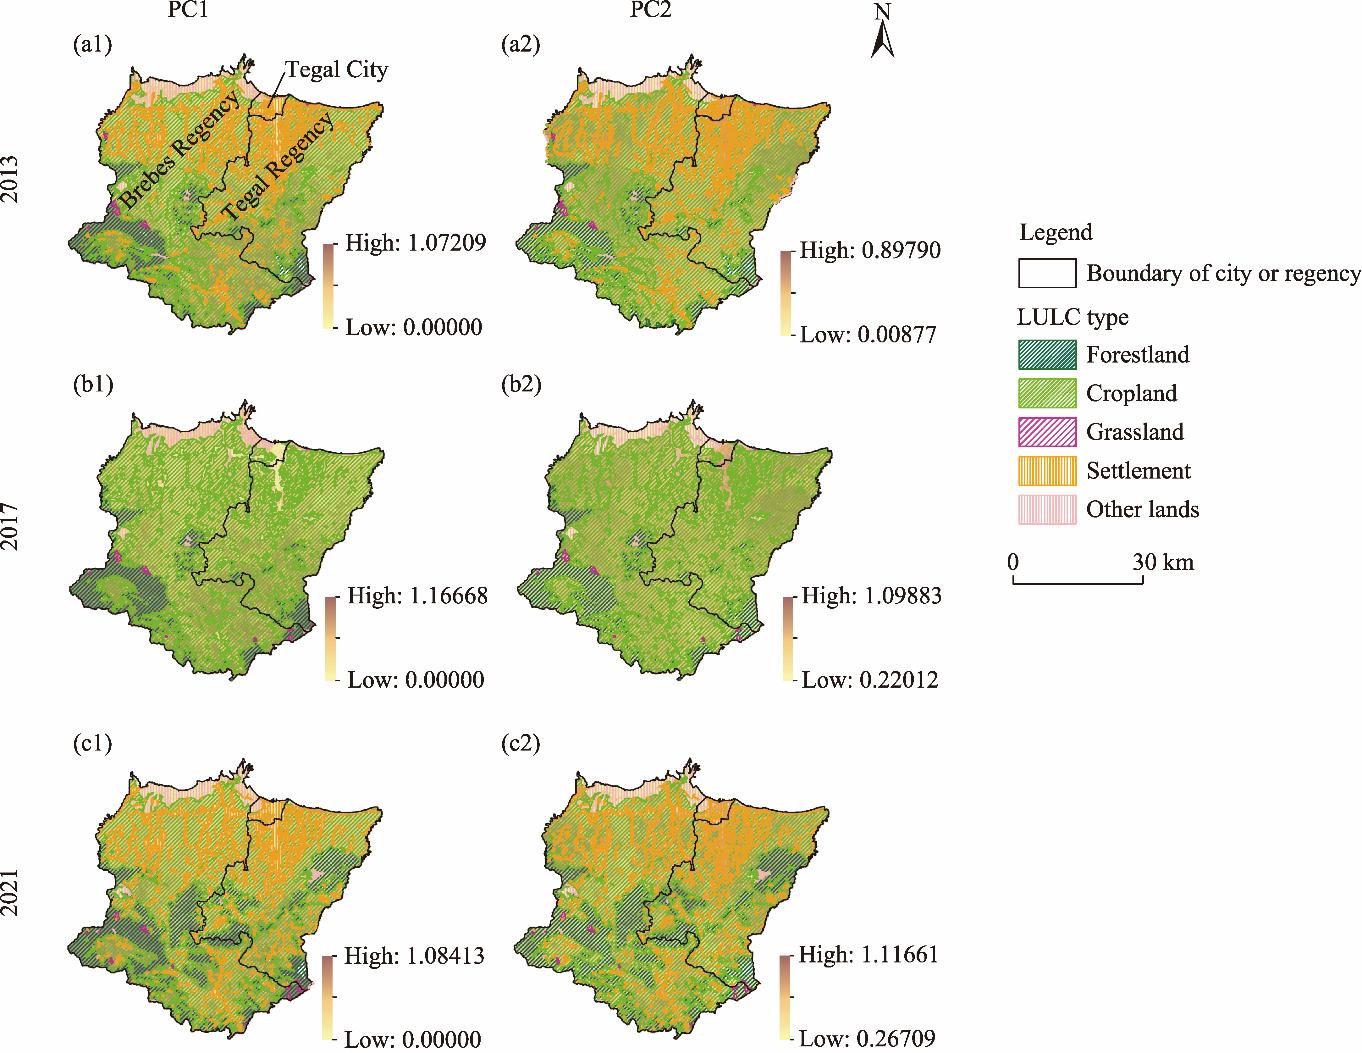
Fig. 9. Spatial distributions of land use and land cover (LULC) types overlapping with PC1 and PC2 in 2013 (a1 and a2), 2017 (b1 and b2), and 2021 (c1 and c2). |
This study is part of the research umbrella entitled “Spatial Quantitative Zoning and Regional Development Model Based on Environmental Carrying Capacity to Achieve Sustainable Spatial Planning for Jawa-Bali Island”, which is funded by the Directorate of Research and Community Service, Ministry of Education, Culture, Research, and Technology, Indonesia (027/E5/PG.02.00.PL/2024). We would like to express our deepest gratitude to Bogor Agricultural University for their invaluable support and resources that made this research possible, and we are also profoundly thankful to the Directorate of Research and Community Service, Ministry of Education, Culture, Research, and Technology, Indonesia, for their financial and administrative support.
| [1] |
|
| [2] |
|
| [3] |
|
| [4] |
|
| [5] |
|
| [6] |
|
| [7] |
|
| [8] |
|
| [9] |
|
| [10] |
|
| [11] |
|
| [12] |
Earth Resources Observation and Science (EROS) Center, 2018. USGS EROS Archive - Digital Elevation - Shuttle Radar Topography Mission (SRTM). [2024-05-03]. https://www.usgs.gov/centers/eros/science/usgs-eros-archive-digital-elevation-shuttle-radar-topography-mission-srtm
|
| [13] |
|
| [14] |
|
| [15] |
|
| [16] |
|
| [17] |
|
| [18] |
|
| [19] |
|
| [20] |
Indonesian Geospatial Information Agency, 2020. Land Use and Land Cover (LULC). [2024-05-01]. https://www.big.go.id/
|
| [21] |
Indonesia’s National Board for Disaster Management, 2024. inaRISK. [2024-05-01]. https://inarisk.bnpb.go.id/
|
| [22] |
|
| [23] |
|
| [24] |
|
| [25] |
|
| [26] |
|
| [27] |
|
| [28] |
|
| [29] |
|
| [30] |
|
| [31] |
|
| [32] |
Ministry of Agrarian Affairs and Spatial Planning Republic of Indonesia, 2021. Regulation Number 1589/SK-HK.02.01/XII/2021 about Establishment of Protected Paddy Field Maps in Districts/Cities in West Sumatra Province, Banten Province, West Java Province, Central Java Province, Special Region of Yogyakarta Province, East Java Province, Bali Province, and West Nusa Tenggara Province. [2024-05-03]. https://www.atrbpn.go.id/in Indonesian).
|
| [33] |
Ministry of Environment and Forestry Republic of Indonesia, 2019. Regulation Number 6605/MENLHK-PKTL/KUH/PLA.2/11/2019 about Map of Forest Area in Central Java Province. [2024-05-03]. https://sigap.menlhk.go.id/in Indonesian).
|
| [34] |
Ministry of Public Works and Housing Republic of Indonesia, 2015. Regulation Number 28/PRT/M/ 2015 about Determination of River Boundary Line and Lake Boundary Line. [2024-05-03]. https://peraturan.bpk.go.id/Details/159992/permen-pupr-no-28prtm2015-tahun-2015in Indonesian).
|
| [35] |
|
| [36] |
|
| [37] |
|
| [38] |
|
| [39] |
|
| [40] |
Presidential Regulation of the Republic of Indonesia, 2016. Regulation Number 51 of 2016 about Coastal Line Boundaries. [2024-05-05]. https://peraturan.bpk.go.id/Details/40463/perpres-no-51-tahun-2016in Indonesian).
|
| [41] |
|
| [42] |
|
| [43] |
|
| [44] |
|
| [45] |
|
| [46] |
|
| [47] |
|
| [48] |
|
| [49] |
|
| [50] |
|
| [51] |
|
| [52] |
Statistics Indonesia, 2018. Indonesia’s Population Projection 2015-2045 by SUPAS 2015. [2024-05-18]. https://www.bps.go.id/id/publication/2018/10/19/78d24d9020026ad95c6b5965/proyeksi-penduduk-indonesia-2015-2045-hasil-supas-2015.htmlin Indonesian).
|
| [53] |
|
| [54] |
Tegal City Government, 2021. Regulation Number 1 of 2021 about Amendment to Tegal City Regional Regulation No. 4/2012 on Tegal City Regional Spatial Plan 2011-2031. [2024-05-18]. https://peraturan.bpk.go.id/Details/185543/perda-kota-tegal-no-1-tahun-2021
|
| [55] |
|
| [56] |
UN-Habitat, 2022a. World Cities Report 2022:Envisaging the Future of Cities. [2024-05-05]. https://unhabitat.org/world-cities-report-2022-envisaging-the-future-of-cities
|
| [57] |
UN-Habitat, 2022b. ASEAN Sustainable Urbanization Report 2022: Sustainable Cities toward 2025 and Beyond. [2024-05-20]. https://unhabitat.org/asean-sustainable-urbanisation-report
|
| [58] |
|
| [59] |
|
| [60] |
|
| [61] |
|
| [62] |
|
| [63] |
|
| [64] |
|
| [65] |
|
| [66] |
|
| [67] |
|
| [68] |
|
| [69] |
|
/
| 〈 |
|
〉 |