Research article

Impact of environmental taxes, hydroelectricity consumption, economic globalization, and gross domestic product (GDP) on the load capacity factor in the selected European Union (EU) member countries

  • Funda KAYA a ,
  • Badsha MIA b ,
  • Most. Asikha AKTAR c ,
  • Md. Shaddam HOSSAIN d ,
  • Md Mahedi HASSAN e ,
  • Muhammad Abdur RAHAMAN f ,
  • Liton Chandra VOUMIK , d, *
Expand
  • aHealth Sciences Institute, Mugla Sitki Kocman University, Mugla, 48100, Turkey
  • bDepartment of Law, Noakhali Science and Technology University, Noakhali, 3814, Bangladesh
  • cDepartment of Economics, Comilla University, Cumilla, 3506, Bangladesh
  • dDepartment of Economics, Noakhali Science and Technology University, Noakhali, 3814, Bangladesh
  • eInternational American University, Los Angeles, 90010, the United States
  • fCentre for People and Environ, Dhaka, 1000, Bangladesh
* E-mail address: (Liton Chandra VOUMIK).

Received date: 2024-05-09

  Revised date: 2024-12-22

  Accepted date: 2025-05-06

  Online published: 2025-05-21

Copyright

2666-660X/© 2025 Xinjiang Institute of Ecology and Geography, Chinese Academy of Sciences. Publishing services by Elsevier B.V. on behalf of KeAi Communications Co. Ltd. This is an open access article under the CC BY-NC-ND license (http://creativecommons.org/licenses/by-nc-nd/4.0/).

Abstract

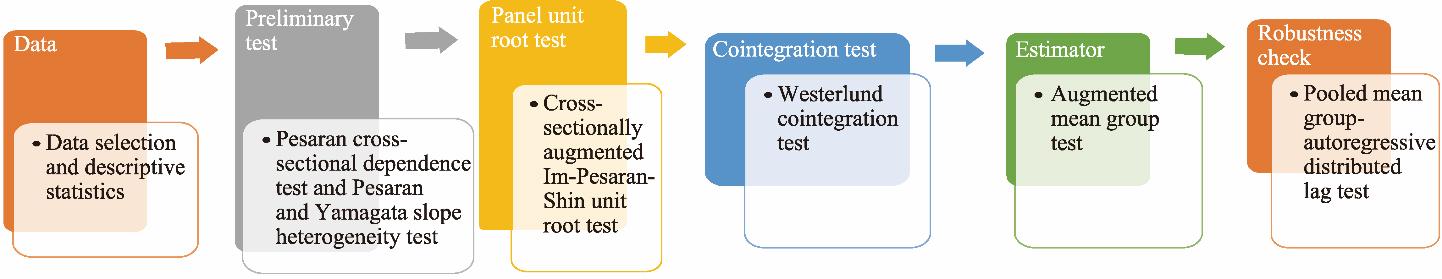
The intersection of economic development, energy dynamics, environmental policy, and environmental sustainability presents complex challenges for European Union (EU) countries. This study investigated the impact of environmental taxes, hydroelectricity consumption, economic globalization, and gross domestic product (GDP) on the load capacity factor (LCF) in the 10 EU member countries (including Austria, Finland, France, Germany, Italy, Poland, Portugal, Slovakia, Spain, and Sweden) using data from 1995 to 2020. To ensure the reliability and validity of the data, this study applied several advanced econometric tests, including the Pesaran and Yamagata slope heterogeneity test, Pesaran cross-sectional dependence (CSD) test, second-generation unit root test, and Westerlund cointegration test. The data showed important statistical issues such as slope heterogeneity across panels, CSD, mixed-order unit root structures, and long-run associations between variables. To address these issues, we applied an augmented mean group (AMG) model as the main regression approach, and used the pooled mean group-autoregressive distributed lag (PMG-ARDL) method to check the robustness. Specifically, the AMG results indicate that a 1.000% rise in hydroelectricity consumption results in a 0.048% rise in the LCF, while a 1.000% increase in environmental taxes leads to a 0.175% increase in the LCF. Contrary to this, a 1.000% increase in economic globalization results in a 0.370% decrease in the LCF, and a 1.000% increase in GDP leads to a 0.850% decrease in the LCF. Environmental taxes have a more beneficial impact on the environment, and GDP has the most detrimental effect. The findings provide empirical evidence on the role of environmental taxes, hydroelectricity consumption, economic globalization, and GDP in driving the LCF. Additionally, the findings provide valuable information to policy-makers, academicians, and stakeholders shaping energy and environmental policies in the 10 EU member countries.

Cite this article

Funda KAYA , Badsha MIA , Most. Asikha AKTAR , Md. Shaddam HOSSAIN , Md Mahedi HASSAN , Muhammad Abdur RAHAMAN , Liton Chandra VOUMIK . Impact of environmental taxes, hydroelectricity consumption, economic globalization, and gross domestic product (GDP) on the load capacity factor in the selected European Union (EU) member countries[J]. Regional Sustainability, 2025 , 6(2) : 100210 . DOI: 10.1016/j.regsus.2025.100210

1. Introduction

Two of the biggest environmental and economic issues nowadays are pollution and environmental sustainability. Some countries have experienced significant environmental damage due to the heavy reliance on fossil fuels, which has been continued through industrialization and economic development (Azam, 2020; Yang et al., 2021). Hence, policy-makers faced a significant dilemma in attaining enduring environmental objectives while avoiding hindering economic progress (Jahanger et al., 2021). Subsequently, it may be challenging for individuals to balance preserving the environment and advancing the economy (Olabi, 2012; Yang et al., 2020). Therefore, scholars have recommended multiple influential factors for effectively and consistently reducing environmental pollution (Bilgili et al., 2021; Kocoglu et al., 2021). The Sustainable Development Goal (SDG) 12, SDG 13, SDG 14, and SDG 15, in such a perspective, focus on promoting sustainable usage of natural resources and addressing environmental issues such as water pollution, deforestation, desertification, global warming, and air pollution (Pata, 2021a).
Several studies have used carbon dioxide (CO2) emissions as a metric to assess the environmental deterioration resulting from economic expansion (Solarin and Bello, 2018; Emir and Karlilar, 2023; Nica et al., 2023). Researchers have investigated the impact of macroeconomic indicators on ecological footprint, one of the most all-encompassing economic-ecological measures of environmental deterioration (Rees, 1992; Uzar and Eyuboglu, 2022). By incorporating six subcomponents, ecological footprint can assess the impact of human activities on the environment in terms of global hectares, thus effectively encapsulating the dynamics of the environment (Lin et al., 2018). The existing literature acknowledges ecological footprint as a robust and comprehensive measure of environmental degradation (Costanza, 2000; Borucke et al., 2013; Al-Mulali et al., 2015; Ozturk et al., 2016; Bello et al., 2018; Tiwari et al., 2022). Considering this fact, Siche et al. (2010) suggested utilizing the load capacity factor (LCF) to compute the elasticity of the factors impacting the quality of the environment. The LCF measures a specific ecological limit by comparing biocapacity and ecological footprint, allowing for a thorough assessment of environmental degradation (Siche et al., 2010; Pata, 2021b; Pata and Isik, 2021; Nica et al., 2023).
On the other hand, economists have increasingly endorsed using economic incentives, such as environmental taxes, to incentivize businesses to shift their production practices towards more environmentally sustainable ones (Shayanmehr et al., 2023). The imposition of taxes on the environment is anticipated to bolster the quality of the environment. Also, the significance of the theoretical framework that underpins the dynamic correlation between hydropower energy and environmental quality is becoming more and more significant in the current discussion of attaining SDG 7, which calls for providing affordable, clean, and reliable energy to all, and SDG 13, which calls for combating changes in the environment. Mohsin et al. (2023) found that hydroelectric power is one of the oldest types of clean energy and a big contributor to lowering greenhouse gas emissions. Although hydroelectric power helps to reduce CO2 emissions, it may also cause environmental and social challenges, such as disruption to aquatic ecosystems, deterioration of water quality, loss of wildlife habitats, and reduced recreational value of river landscapes (Adebayo et al., 2021; Bilgili et al., 2021).
Proponents of globalization claim that its economic benefits outweigh the environmental costs, which they often view as necessary compromises (Ahmed et al., 2021). So far, Wang et al. (2019) have stated that globalization greatly encourages technological progress and lessens environmental damage. On the other hand, several scholars believe that as globalization expands, it will lead to more economic expansion, trade activities, and higher energy use (Bekun et al., 2020; Rehman et al., 2023). More precisely, this results in environmental degradation due to adverse demand and supply pressures on the LCF (Shahbaz et al., 2019). Ghosh (2010) found that developing countries have adverse consequences of globalization due to their inadequate institutional quality and environmental norms. As a result, these countries are subject to adverse repercussions in the form of environmental degradation. Moreover, as trade liberalization increases because of globalization, governments worldwide are constrained to reduce their production costs by disregarding or sacrificing their environment (Zaidi et al., 2019).
At the country level, European Union (EU) member countries exhibit diverse economic and environmental policies, energy generation and consumption patterns, and globalization levels, which can have varying effects on their LCFs. It is crucial to investigate the impacts of environmental taxes, hydroelectricity consumption, economic globalization, and gross domestic product (GDP) on the LCF in EU member countries to fill this knowledge gap. This study preferred EU member countries for several reasons. First, Europe is confronted with enduring environmental challenges encompassing biodiversity depletion, resource depletion, the repercussions of climate change, and hazards to human health and welfare. Also, compared to other global regions, the continent’s resource consumption and contribution to environmental degradation remain higher (European Environment Agency, 2023). Second, the European Environmental Agency stated that the Global Footprint Network has already established and generated EU countries’ ecological footprint and biocapacity data. For this reason, it is preferable to examine the LCF as an environmental quality indicator for EU member countries to generate policy implications that are feasible to implement. Third, hydroelectricity stands out as the EU’s leading renewable energy source. According to Mohsin et al. (2023), in 2020, hydroelectric power contributed to 33.000% of the generation of renewable energy in the EU region and provided 17.000% of the EU’s total electricity supply. Fourth, environmental taxes are essential in implementing the EU’s energy and climate policy. They are equally applicable across all EU member countries. Furthermore, the tax policy implemented in EU countries deserves attention, as it demonstrates the efficacy of taxes in promoting sustainable development and serving as a self-financing mechanism for environmental preservation (Famulska et al., 2022).
In light of the above discussion, this study aimed to investigate the effects of environmental taxes, hydroelectricity consumption, economic globalization, and GDP on the LCF in the 10 EU member countries, including Austria, Finland, France, Germany, Italy, Poland, Portugal, Slovakia, Spain, and Sweden. One key reason for this study is the ongoing debate about whether environmental taxes truly help reduce environmental degradation. According to Shayanmehr et al. (2023), concerns regarding the association between environmental taxes and environmental sustainability still need to be addressed. More research needs to be done to find out exactly how hydroelectricity consumption and economic globalization affect the LCF in the EU. While previous studies often used CO2 and greenhouse gas emissions to measure environmental quality, this study took a broader approach by using the LCF as the dependent variable to capture both ecological demand and biocapacity. To fill these gaps in research, this study used the new dynamic augmented mean group (AMG) model to explore the long-term effects. The results of this study contribute to advancing SDGs, particularly SDG 7 and SDG 13. The findings highlight the importance of integrating environmental, social, and governance criteria into policy-making to promote a sustainable environment, foster green growth, and support long-term development.

2. Literature review

This section provides an overview of the literature on environmental degradation and related factors, including environmental taxes, hydroelectricity consumption, economic globalization, and GDP. Therefore, four main sub-sections are presented to evaluate the literature review: environmental taxes, hydroelectricity consumption, economic globalization, and GDP.

2.1. Environmental taxes

The first part of the literature review is mainly about the previous studies that investigated the links between environmental taxes and the environmental situation. Aydin and Esen (2018) examined 15 EU countries from 1995 to 2013 using a dynamic panel threshold regression model. They discovered that environmental taxes do enhance the integrity of the environment, but only to a certain extent. A study conducted by Vlahinić Lenz and Fajdetić (2021) used a similar approach and found the same result for 26 EU countries. According to the results, environmental taxes lessen the bad effects of climate change and the environment. In other countries, the researchers have found the opposite result. Hao et al. (2021) used second-generation panel data analysis and found that environmental taxes are a great way for the G7 countries (including Canada, France, Germany, Italy, Japan, the United Kingdom, and the United States) to fix the damage being done to the ground. The fully modified ordinary least squares (FMOLS) method was used by Doğan et al. (2022) to find that environmental taxes are a good way for the G7 countries to reduce carbon pollution.
Bashir et al. (2020) examined how technology and economic growth affect the relationship between CO2 emissions and environmental costs using the system-generalized method of moments and quantile regression methods. The results showed that implementing environmental tax policies improves the environment of the Organization for Economic Cooperation and Development (OECD) countries. Rafique et al. (2022) found that the OECD countries that want to deal with the issue of ecological damage could make their economy and environment more stable by imposing environmental taxes. Specifically, they used the panel autoregressive distributed lag (ARDL), FMOLS, dynamic ordinary least squares, fixed effect model, and Westerlund cointegration test. Ulucak et al. (2020) compared how environmental taxes affected CO2 pollution in the BRICS countries (including Brazil, Russia, India, China, and South Africa). The panel smooth transition regression model they used showed that environmental taxes have caused a big drop in carbon pollution in these countries.

2.2. Hydroelectricity consumption

The second phase of the literature review investigates the environmental consequences of hydroelectricity usage. According to a study conducted by Murshed et al. (2021), electricity has the potential to significantly reduce CO2 and greenhouse gas emissions, as measured by the ARDL approach in Bangladesh. All things being equal, consuming more energy at a rate of 1.000% results in lower per capita CO2 and greenhouse gas emissions. Destek and Aslan (2020) also explored how hydroelectric power is good for the environment in G7 countries that are big carbon emitters. Mohsin et al. (2023) used the quantile cointegration test to examine 10 EU countries (including Austria, Finland, France, Germany, Italy, Norway, Portugal, Spain, Sweden, and Switzerland) and discovered that the use of hydroelectric power greatly lowers CO2 emissions in all of them except for Portugal.
Alnour et al. (2022) applied the structural vector autoregression (SVAR) model and asserted that the utilization of hydroelectric power is crucial in combating environmental pollution in Sudan. Pata (2018) also demonstrated the insignificant effect of hydroelectricity consumption on reducing CO2 emissions in Turkey based on the coefficients obtained from the ARDL, canonical cointegrating regression, and FMOLS. Pata and Aydin (2020) investigated the correlation among hydroelectricity consumption, ecological footprint, and economic growth in the six leading hydropower-consuming countries. The result suggested that the utilization of hydroelectric energy does not contribute to the reduction of ecological footprint in these six countries. In addition, Adebayo et al. (2021) used the ARDL-bound testing method and observed that hydroelectricity consumption positively impacts the environment in China. Bandyopadhyay et al. (2022) examined the role of hydro-energy in India’s energy policy using the ARDL and Toda-Yamamoto tests, focusing on energy security and efforts to cut down the emission intensity. The study found that the accelerated adoption of hydro-energy could help India achieve both of these objectives.

2.3. Economic globalization

The third section of the literature review examines the impact of economic globalization on environmental degradation. Kalaycı and Hayaloğlu (2019) used panel data analysis and the fixed effect model and found that in the North American Free Trade Agreement (NAFTA) countries, environmental degradation is linked to economic globalization in a good way. Destek and Aslan (2020) used a second version of panel data to look at 12 central and eastern European countries and discovered that economic globalization increases carbon emissions. The Arellano-Bond estimator of dynamic panel analysis was used by Lenz and Fajdetić (2021) to find a positive link among economic globalization, passenger movement, and greenhouse gas emissions. This result differs greatly from the findings of Erdoğan et al. (2021). Using the same method, they concluded that people’s environmental impact decreases as globalization grows in the Sub-Saharan African (SSA) countries. The results support Porter’s theory, which indicates that globalization encourages environmentally friendly business practices and makes it easier for better technologies to spread to SSA countries from developed ones (Christmann and Taylor, 2001).
According to the study by Majeed et al. (2021), the cross-sectionally augmented autoregressive distributed lag (CS-ARDL) model concluded that economic globalization improved the environmental well-being of the Gulf Cooperation Council (GCC) countries by reducing CO2 emissions. On the other hand, Yang et al. (2021) used the FMOLS estimation method and found that globalization significantly reduces environmental quality in GCC countries. Xue et al. (2021) applied the dynamic common correlated effects approach to analyze the environmental consequences of globalization and natural resource extraction in South Asian countries from 1991 to 2018. Their study supports the Pollution Halo Hypothesis, which suggests that globalization leads to cleaner and more advanced technologies by multinational companies in host economies, reducing greenhouse gas emissions. The positive correlation between globalization and ecological footprint indicates that with the intensification of globalization, environmental degradation occurs. Furthermore, globalization increases CO2 emissions in 47 emerging markets and developing countries, according to the study conducted by Le and Ozturk (2020). Alnour and Atik (2021) employed the SVAR model to assess the dynamic impact of renewable energy utilization and globalization on environmental quality in Turkey between 1990 and 2017, and found that hydroelectricity consumption negatively affects environmental quality, indicating its role in reducing ecological degradation. Conversely, globalization contributes positively to environmental degradation, suggesting that increased global integration may lead to higher environmental pressure.

2.4. Gross domestic product (GDP)

Işık et al. (2019) used panel data from 1980 to 2015 to examine the Environmental Kuznets Curve (EKC) hypothesis for 10 states in the United States. The results showed that the connections are not all the same. The EKC hypothesis only holds true for five states: Florida, Illinois, Michigan, New York, and Ohio. Although Texas is a leading oil producer, the study found that fossil fuel consumption does not have a significant effect on CO2 emissions. Also, compared to other states, using renewable energy has a relatively small effect on lowering emissions in Florida. Işık et al. (2024) looked at how economic growth, green energy, the internet, and mineral rents change CO2 emissions in 27 OECD countries from 2001 to 2020. They used a panel quantile regression analysis to find proof of the EKC hypothesis in places where CO2 emissions are low. Also, the study found that using more green energy and the internet greatly lowers CO2 emissions. On the other hand, higher mineral rents are linked to higher CO2 emissions. These results show how important it is to support digitalization and renewable energy while carefully controlling the use of natural resources to protect the Earth. Işık et al. (2018) examined the complicated connections among developing tourism, green energy, and economic growth in seven critical countries, and used a bootstrap panel Granger causality model to identify the direction of causal relationships and the interdependence between the variables.

2.5. Literature gaps

Even though the literature review examines the correlation of environmental taxes, hydroelectricity consumption, economic globalization, and GPD with the LCF, it is necessary to conduct a separate discussion regarding the precise effects of these factors on the LCF. To make effective policy decisions, it is imperative to comprehend the determinants of the LCF, which is a critical indicator of environmental sustainability. More research needs to examine the relationship between the studied variables and the LCF across a broader range of countries or regions, particularly within the context of the EU. Many previous studies rely on linear regression models or panel data analysis techniques (Bilgili et al., 2023; Mehmood and Kaewsaeng-on, 2024). However, these methods may only partially capture the complex and potentially nonlinear relationships between the variables. More advanced econometric techniques, such as the AMG model and the pooled mean group-autoregressive distributed lag (PMG-ARDL), could provide deeper insights into the heterogeneous effects across diverse levels of the LCF. By addressing these gaps, this study can significantly contribute to the existing literature and provide valuable insights to promote sustainable development and environmental protection.

3. Data and methodology

3.1. Data sources

This study used data from 10 EU member countries during 1995-2020, including Austria, Finland, France, Germany, Italy, Poland, Portugal, Slovakia, Spain, and Sweden. Data on the LCF were from Global Footprint Network (2023), the data for hydroelectricity consumption were collected from Statistical Review of World Energy (British Petroleum, 2022), the data for environmental taxes were from OECD (2023), the economic globalization data were from KOF Swiss Economic Institute (2022), and the data of GDP were collected from the World Development Indicators of World Bank (2023). We also clarified the selection of the 10 EU member countries in this study, emphasizing their shared dependence on conventional energy sources and their integration within the EU’s social, macroeconomic, environmental, and political frameworks. Historical evidence suggests that technological advancements in a member country often influence neighboring countries, enhancing the relevance of this analysis. This study aimed to provide a novel perspective on how economic globalization, environmental taxes, hydroelectricity consumption, and GDP impact the LCF within these specific EU member countries. Table 1 shows the variables, short forms, and sources of the data. Logarithmic transformation was applied to all variables.
Table 1 Detailed information about the variables, description, and sources.
Variable Short form for variables after logarithmic transformation Description and measurement Source
Load capacity factor (LCF) lnLCF LCF is the ratio of biocapacity and ecological footprint. It reflects the ecological sustainability of a country by comparing its biocapacity to ecological footprint (LCF>1 indicates ecological reserve, and LCF<1 indicates ecological deficit). Global Footprint Network (2023)
Hydroelectricity consumption lnHYD Hydroelectricity consumption measures the amount of electricity generated from hydropower sources. British Petroleum (2022)
Environmental taxes lnENV Environmental taxes represent the share of environmentally related tax revenues in GDP, indicating the fiscal effort toward environmental protection. OECD (2023)
Economic globalization lnGLOB Economic globalization captures the extent of economic integration through trade, investment, and financial flows, as measured by the KOF economic globalization index. KOF Swiss Economic Institute (2022)
Gross domestic product (GDP) lnGDP GDP reflects the economic performance of a country in terms of income per capita. World Bank (2023)

3.2. Model construction

This study mainly investigated the long-term impact of environmental taxes, hydroelectricity consumption, economic globalization, and GDP on the LCF. Equation 1 shows the function form used in this study.
LCF = f ( HYD , ENV , GLOB , GDP ) ,
where LCF denotes the load capacity factor; HYD represents the hydroelectricity consumption (EJ); ENV denotes the environmental taxes, calculated as a percentage of GDP (% of GDP); GLOB is the economic globalization, measured by the KOF economic globalization index; and GDP represents the gross domestic product (USD).
This study used the LCF as the dependent variable, and the econometric model is as follows:
ln LCF i t = α 0 + α 1 ln HYD i t + α 2 ln ENV i t + α 3 ln GLOB i t + α 4 ln GDP i t + μ i t ,
where α0 is the constant term; α1, α2, α3, and α4 are the long-run elasticity coefficients; i represents the cross-sectional country; t is the time dimension; and μ is the error term.

3.3. Empirical methods

This study investigated the effects of environmental taxes, hydroelectricity consumption, economic globalization, and GDP on the LCF during 1995-2020 in the 10 EU member countries. The AMG model was used for long-term estimations. In addition, the PMG-ARDL method was used for the robustness check test. The empirical strategy of this study is summarized in Figure 1.
Fig. 1. Stepwise empirical strategy applied in this study.
In the first stage of the econometric procedure of this study, whether there was a cross-sectional dependence (CSD) between the variables was tested. CSD in panel data groups is important in choosing appropriate verification tests in the following stages. In this study, the Pesaran CSD test was applied:
CSD test = 2 T N N 1 ( c = 1 N 1 k = c + 1 N τ c k ^ ) ,
where CSDtest is the CSD test statistic; T is the number of time periods; N is the number of years; c is the country; k is the second cross-sectional unit; and τ i k ^ is the estimated correlation coefficient.
The slope heterogeneity test is also of great importance in the estimator selection. For the consistency and reliability of the analysis results, the appropriate estimator is selected by testing the slope heterogeneity. In this study, we calculated the slope heterogeneity coefficients with the help of the Pesaran and Yamagata (2008) test. Pesaran and Yamagata slope heterogeneity test statistics were generated using the following equations:
$\tilde{\Delta}=\sqrt{N'}(\frac{N{{'}^{-1}}\tilde{S}-k'}{\sqrt{2k'}}),$
S ˜ = i ' = 1 N ' ( β ^ i ' β ^ WFE ) x ¯ x ¯ σ ^ i ' 2 ( β ^ i ' β ^ WFE ) ,
where Δ ˜ is the slope heterogeneity test statistic; N' is the number of cross-sectional units, representing the total number of countries included in the analysis; S ˜ is the Swamy-type test statistic; k' represents the independent variable; i' is the individual cross-sectional unit; β ^ i ' represents the heterogeneous coefficient for each cross-section; β ^ WFE represents the coefficient of the fixed estimators; x ¯ x ¯ is the pooled cross-sectional variance-covariance matrix; and σ ^ i ' 2is the estimated error variance.
The adjusted slope heterogeneity test statistic ( Δ ˜ adj), accounting for bias in the mean and variance under normally distributed error terms, was calculated as follows:
Δ ˜ adj = N ' ( N ' 1 S ˜     E ( Z ˜ i T ) V a r ( Z ˜ i T ) ) ,
where E ( Z ˜ i T ) is the expected value (mean) of the test statistic; and V a r ( Z ˜ i T ) is the variance of the test statistic.
The next step in the econometric procedure is to test the stationarity of the variables. In this study, the cross-sectional augmented Im-Pesaran-Shin (CIPS) unit root test, which is the second-generation unit root test, was preferred because cross-section dependence was determined. The CIPS unit root test is expressed as follows:
CIPS N ' , N = 1 N ' i ' = 1 N ' t i ' N ' , N ,
where ti' is the augmented Dickey-Fuller t-statistic for the ith cross-sectional unit.
In the following step, the existence of a long-term relationship between variables was tested using the cointegration test developed by Westerlund. Westerlund cointegration test considers cross-section dependence and produces more effective results in this situation (Westerlund, 2007). Westerlund cointegration test is shown in following equations:
$\Delta{{Y}_{it}}=\delta'{{d}_{t}}+{{a}_{i}}({{\gamma}_{it-1}}-{{\beta'}_{i}}{{X}_{1t-1}})+\underset{j=1}{\overset{{{\rho }_{i}}}{\mathop \sum }}\,{{a}_{i}}\Delta{{\gamma}_{it-j}}+\underset{j=-{{q}_{i}}}{\overset{{{\rho }_{i}}}{\mathop \sum }}\,{{\gamma}_{i}}\Delta{{X}_{it-j}}+{{\varepsilon}_{it}},$
G t = 1 N ' i i = 1 N ' a ^ i SE( a ^ i ) ,
G a = 1 N ' i i = 1 N ' a ^ a ^ 1 ( 1 ) ,
P t = a ^ i SE( a ^ i ) ,
P a = T a ^ ,
where Δ Y i t is the first difference of the dependent variable; δ' is the vector of coefficients on the deterministic components; dt is the deterministic component; ai is the speed of adjustment coefficient; γit-1 is the lagged dependent variable; ${{\beta '}_{i}}$ is the coefficient vector of the long-run relationship; X1t-1 is the vector of lagged explanatory variable; ρi is the maximum lag length of the dependent variable; j is the lag index; Δγ i t j is the lagged error correction term; qi is the lag order of the explanatory variable; γi is the lagged error correction term of the dependent variable; Δ X i t j is the first difference of the explanatory variable; εit is the error term; Gt is the group-mean test statistic; ii is the cross-sectional unit index; a ^ i is the estimated adjustment coefficient; SE( a ^ i ) is the standard error of the adjustment coefficient; Ga is the group-mean test statistic normalized by long-run variance; a ^ is the average adjustment coefficient; a ^ 1 ( 1 ) is the normalized adjustment coefficient; Pt is the panel-based t-statistic assuming homogeneity; and Pa is the panel test statistic based on pooled level estimates.
In this study, the AMG model developed by Eberhardt and Teal (2010) was used to estimate the long-term coefficients. This test considers CSD on panel datasets. The AMG model is expressed as follows:
Δ Y i t = a 1 i + β i Δ X i t + φ i f t + t = 2 T τ t DUMMY t + ε i t ,
AMG = 1 N ' i c = 1 N ' β ˜ i ,
where a1i is the unit-specific intercept capturing fixed effect; βi is the slope coefficient for differenced independent variable; Δ X i t is the first difference of the explanatory variable; φi is the factor loading for unit i; ft is the unobserved common dynamic process; τt is the coefficient associated with time dummies; DUMMYt is the time-specific dummy variable; εit is the idiosyncratic error term; ic is the index for cross-sectional unit; and β ˜ iis the estimated slope coefficient.

4. Empirical results

In this study, the descriptive statistics of the variables were examined first. Descriptive statistics are presented in detail in Table 2. The mean values of the logarithmic transformation of the LCF (lnLCF), hydroelectricity consumption (lnHYD), environmental taxes (lnENV), economic globalization (lnGLOB), and GDP (lnGDP) are -0.283, -0.724, 0.385, 1.886, and 4.424, respectively. The standard deviation shows the distribution of the data around the mean. The standard deviations of the lnLCF, lnHYD, lnENV, lnGLOB, and lnGDP are 0.304, 0.476, 0.077, 0.042, and 0.233, respectively.
Table 2 Descriptive statistics of variables used in this study.
Statistic lnLCF lnHYD lnENV lnGLOB lnGDP
Mean -0.283 -0.724 0.385 1.886 4.424
Median -0.340 -0.642 0.387 1.893 4.509
Maximum 0.373 -0.077 0.556 1.945 4.728
Minimum -0.769 -1.758 0.201 1.746 3.750
Standard deviation 0.304 0.476 0.077 0.042 0.233
In the first stage of econometric analysis, the slope heterogeneity of the variables was examined. The slope heterogeneity test checks if the relationship between variables changes across different countries or groups in the panel data. Table 3 shows the results of Pesaran and Yamagata slope heterogeneity test. In this table, Δ represents the standard slope heterogeneity statistic, and Δadj represents the bias-adjusted slope heterogeneity statistic. Both test statistics and probability values in the results of slope heterogeneity test provide strong evidence against the null hypothesis. In other words, slope heterogeneity is detected in these variables. In summary, the results show that the relationship between variables is not the same across all countries.
Table 3 Results of Pesaran and Yamagata slope heterogeneity test.
Test statistic Probability value
Δ 8.623***
Δadj 9.832***

Note: Δ represents the standard slope heterogeneity statistic, and Δadj represents the bias-adjusted slope heterogeneity statistic. *** indicates significance at 1% level.

In the econometric analysis, CSD was checked as the second condition of the pre-test. Testing CSD between variables is essential for consistent and robust results in the panel data. Pesaran CSD test results show that all variables have CSD (Table 4). The results imply that the variables are interconnected and do not act independently. When the test statistics and probability values are examined in the results, the null hypothesis is rejected in all variables, and there is strong evidence of CSD.
Table 4 Results of Pesaran cross-sectional dependence (CSD) test.
Variable Pesaran CSD value
lnLCF 12.658***
lnHYD 8.483***
lnENV 4.489***
lnGLOB 33.537***
lnGDP 26.711***

Note: *** denotes significance at 1% level.

This study found slope heterogeneity and CSD in all variables. Therefore, to test the stationarity of variables, we preferred the second-generation unit root test that considers CSD. The unit root test determines the level at which the variables become stationary. The unit root test results are significant in the selection of coefficient estimators. In this study, we used the CIPS unit root test to test the stationarity of variables. CIPS unit root test results are presented in Table 5. The results indicate that lnLCF, lnENV, and lnGDP become stationary after first difference. Meanwhile, lnHYD and lnGLOB are found to be stationary without taking the first difference. Overall, the variables exhibit a mixed order of integration.
Table 5 Results of cross-sectional augmented Im-Pesaran-Shin (CIPS) unit root test.
Variable Test statistic
I(0) I(1)
lnLCF -2.297 -5.789***
lnHYD -4.403*** -6.060***
lnENV -1.856 -4.824***
lnGLOB -2.656*** -5.175***
lnGDP -1.267 -2.561**

Note: Test statistic I(0) represents the original form of the variable without differencing, and test statistic I(1) represents the variable that has been differenced once to get stationarity. *** and ** refer to significance at 1% and 5% levels, respectively.

Table 6 presents the results of Westerlund cointegration test, which includes four test statistics: the group-mean test statistic (Gt), the group-mean test statistic normalized by long-run variance (Ga), the panel-based t-statistic assuming homogeneity (Pt), and the panel test statistic based on pooled level estimates (Pa). The test distinguishes between panel-wide and country-specific cointegration. Gt and Pt assess the presence of cointegration in the panel data, and Ga and Pa are calculated by averaging the cointegration results from each country separately. The cointegration test examines whether a long-term cointegration relationship exists between the LCF and each of the following variables: environmental taxes, hydroelectricity consumption, economic globalization, and GDP. The findings show a long-term cointegration relationship between the dependent and independent variables in the empirical analysis. The null hypothesis is rejected, and the alternative hypothesis is accepted. After determining a long-term cointegration relationship between variables, the AMG model was used in this study to estimate the coefficients.
Table 6 Results of Westerlund cointegration test.
Test statistic Estimated test statistic value Z-statistic
Gt -3.082** -2.107
Ga -10.986 0.813
Pt -10.799*** -3.697
Pa -12.881* -1.491

Note: Gt, the group-mean test statistic; Ga, the group-mean test statistic normalized by long-run variance; Pt, the panel-based t-statistic assuming homogeneity; Pa, the panel test statistic based on pooled level estimates. ***, **, and * represent significance at 1%, 5%, and 10% levels, respectively.

Table 7 presents the results of the AMG model, which estimates how each independent variable is related to the dependent variable (lnLCF) in the long run. This table reports the long-run coefficients of the impact of lnHYD, lnENV, lnGLOB, and lnGDP on lnLCF in the selected EU member countries. The results obtained from the AMG model determined a positive and statistical significant effect of lnHYD on lnLCF at the 10% significance level. There is evidence that hydroelectricity consumption has an improving impact on the LCF in the 10 EU member countries. In addition, a 1.000% rise in hydroelectricity consumption corresponds to a 0.048% increase in the LCF in the long run. Moreover, the coefficient of lnENV is positive and significant. A 1.000% increase in environmental taxes increases the LCF by 0.175%. This effect is statistically significant at the 1% level, indicating that environmental taxes are a powerful tool for advancing environmental sustainability. The results imply that environmental taxes increase the LCF in the 10 EU member countries in the long run. However, the coefficient of economic globalization is negative and significant. This result shows that economic globalization in the 10 EU member countries reduces the LCF in the long run. This study also found that the effect of GDP on the LCF is negative and significant at the 1% significance level. It shows that GDP harms the LCF in the 10 EU member countries in the long run. This negative impact is statistically significant at the 1% level, highlighting the potential trade-off between economic development and environmental sustainability. The PMG-ARDL method was also applied to measure the AMG model’s robustness.
Table 7 Long-run estimation results from the Augmented Mean Group (AMG) model.
Variable Long-run coefficient Standard error
lnHYD 0.048* 0.0263
lnENV 0.175*** 0.0586
lnGLOB -0.368** 0.1938
lnGDP -0.854*** 0.1039
Constant term 4.047*** 0.3360

Note: ***, **, and * represent significance at 1%, 5%, and 10% levels, respectively.

Table 8 displays the robustness check results obtained through the PMG-ARDL method, supporting the findings from the AMG model presented in Table 7. Long-run coefficients show that environmental taxes and hydroelectricity consumption continue to have a good effect on the LCF. Environmental taxes are statistically significant at the 1% level, underscoring their positive impact on enhancing the LCF. Economic globalization and GDP demonstrate negative impacts on the LCF, thereby affirming their detrimental environmental effects. The direction and significance of the results are always the same, which makes the AMG model more reliable. The constant term is significant, indicating that additional unobserved factors may influence the LCF levels across countries. The PMG-ARDL results confirm the robustness of the primary findings.
Table 8 Results of pooled mean group-autoregressive distributed lag (PMG-ARDL) method.
Variable Long-run coefficient Standard error
lnHYD 0.042 0.0256
lnENV 0.106*** 0.0331
lnGLOB -0.457*** 0.1193
lnGDP -1.060*** 0.0882
Constant term 4.695*** 0.4148

Note: *** denotes significance at 1% level.

5. Discussion

This study shows that hydroelectricity consumption has a positive and significant impact on the LCF in the 10 EU member countries, supporting the view that clean and renewable energy sources contribute to improve the LCF. The results are consistent with prior studies like Bello et al. (2018), Zhang et al. (2021), and Ozcan et al. (2024), which also emphasized the environmental benefits of hydroelectricity consumption. Hydroelectricity consumption is a steady and dependable energy source that helps keep the LCF safe for the environment. It also serves as a reservoir for water storage and a mean of controlling flooding, among its many other multipurpose infrastructure roles. This dual functionality feature enhances the overall resilience of the environment, sustainability, and energy system (Bello et al., 2018; Ozcan et al., 2024). Hydroelectricity consumption is important for improving the LCF and promoting clean energy in the EU because it is flexible and good for the environment.
Environmental taxes positively affect the LCF in the 10 EU member countries, demonstrating the power of policy tools to influence the environment. To begin, environmental taxes can serve as a financial incentive to purchase greener technology and reduce energy consumption. This fiscal approach stops activities that hurt the environment and puts money into projects that will last (Gao and Fan, 2023). Secondly, the money made from environmental taxes can be used to support green energy projects and make it easier for people to use clean energy. Mehboob et al. (2024) found that the interaction between environmental taxes and the LCF shows how important policy measures are for making the energy system more sustainable and resilient. So, environmental taxes can lower the use of fossil fuels and boost the use of renewable energy by making renewables more cost-effective and raising the price of fossil fuels.
The negative relationship between economic globalization and the LCF suggests that as EU countries become more connected through trade and finance, their environment may suffer in the long run. This is consistent with the findings of Ibrahim et al. (2024), Ulussever et al. (2024), and Alam et al. (2025). According to Pata et al. (2023), the demand for energy-intensive goods and services is expected to grow globally. As countries become more interconnected, people and businesses can access a broader range of goods and services, many of which use electricity. Second, the larger the world, the more export-import activities and energy consumption related to transportation, and the greater the need for energy (Topcu et al., 2021). Global supply chains can drive jobs to places with lower environmental standards and higher carbon emissions. The LCF is also affected by competitive forces that prefer to pay in terms of sustainability.
This study discovered that GDP has a negative effect on the LCF in the 10 EU member countries. This finding is similar to the studies conducted by Pata and Isik (2021), Caglar et al. (2024), and Samour et al. (2024). However, the result differs from the results of Al-Mulali (2015) and Mikayilov et al. (2019). As a start, more industrialization and energy-intensive activities are often linked to higher income. This means more power and fossil fuels are needed, which could pressure the LCF (Chen, 2024). With the economy growing, conventional energy sources may also be given more attention than cleaner options, which could hurt the environment. Also, aiming for GDP growth immediately leads to building infrastructure that might use less energy (Steckel et al., 2013).
Based on the empirical results, the following recommendations are made to help with policy-making and planning for the environment in the EU. Since the study demonstrates that environmental taxes significantly enhance the LCF, leading to better environmental outcomes, EU policy-makers should enhance and broaden environmental taxes-related policies. Investments in hydroelectric power should be increased, particularly in countries where potential remains unexplored, to promote renewable energy use and improve sustainability. Economic growth strategies should be evaluated to ensure that they do not compromise environmental sustainability, particularly because a higher GDP has been shown to reduce the LCF substantially. As the EU grows and trade policies are made, environmental standards should be added to ensure that globalization does not have too many harmful environmental effects. To help EU countries achieve economic success without hurting the environment, the EU needs a balanced approach that aligns fiscal and energy policy with environmental goals.

6. Conclusions

This study explored the impact of environmental taxes, hydroelectricity consumption, economic globalization, and GDP on the LCF in the 10 EU member countries from 1995 to 2020. Based on the results of the AMG model, we found that the LCF is positively correlated with environmental taxes and hydroelectricity consumption. Specifically, a 1.000% increase in hydroelectricity consumption improves the LCF by 0.048%, while a 1.000% increase in environmental taxes enhances the LCF by 0.175%. Promoting hydroelectricity consumption and implementing environmental taxes as a combined strategy to improve the LCF will pave the way for a cleaner and more sustainable energy future. Conversely, economic globalization and GDP have a negative impact on the LCF, leading to prospective challenges in global economic integration and environmental health. A 1.000% rise in economic globalization reduces the LCF by 0.368%, and a 1.000% increase in GDP lowers the LCF by 0.854%, pointing to a trade-off between economic expansion and environmental balance. The robustness check using the PMG-ARDL method validates the findings of the AMG model. Finally, this study provides empirical evidence about the environmental impacts of energy, fiscal, and economic variables. The result of this study highlights the importance of establishing sustainable development paths that integrate environmental objectives with economic growth, environmental legislation, globalization, and energy dynamics. The results also pave the way for studies that investigate the interplay of these variables in various geographical and institutional settings in the future.

Authorship contribution statement

Funda KAYA: conceptualization, investigation, and data curation; Badsha MIA: conceptualization, resources, and supervision; Most. Asikha AKTAR: project administration, resources, and funding acquisition; Md. Shaddam HOSSAIN: formal analysis, methodology, software, validation, and writing - original draft; Md Mahedi HASSAN: project administration, resources, and funding acquisition; Muhammad Abdur RAHAMAN: investigation and data curation; and Liton Chandra VOUMIK: writing - review & editing, visualization, and validation. All authors approved the manuscript.

Declaration of conflict of interest

The authors declare that they have no known competing financial interests or personal relationships that could have appeared to influence the work reported in this paper.

We are grateful to the World Bank and the Global Footprint Network (GFN) for providing the data for this research.

[1]
Adebayo, T.S., Agboola, M.O., Rjoub, H., et al., 2021. Linking economic growth, urbanization, and environmental degradation in China: What is the role of hydroelectricity consumption? Int. J. Environ. Res. Public Health. 18(13), 6975, doi: 10.3390/ijerph18136975.

[2]
Ahmed, Z., Zhang, B., Cary, M., 2021. Linking economic globalization, economic growth, financial development, and ecological footprint: Evidence from symmetric and asymmetric ARDL. Ecol. Indic. 121, 107060, doi: 10.1016/j.ecolind.2020.107060.

[3]
Alam, Q., Voumik, L.C., Rahman, M.H., et al., 2025. Impact of globalization, tourism, energy, and education on load capacity factors in selected 14 Indo-Pacific nations: An advanced econometric analysis. All Earth. 37(1), 1-16.

[4]
Al-Mulali, U., Weng-Wai, C., Sheau-Ting, L., et al., 2015. Investigating the environmental Kuznets curve (EKC) hypothesis by utilizing the ecological footprint as an indicator of environmental degradation. Ecol. Indic. 48, 315-323.

[5]
Alnour, M., Atik, H., 2021. The dynamic implications of globalization and renewable energy in Turkey: Are they vital for environmental sustainability? An SVAR analysis. Bilgi Sosyal Bilimler Dergisi. 23(2), 288-314.

[6]
Alnour, M., Ali, M., Abdalla, A., et al., 2022. How do urban population growth, hydropower consumption and natural resources rent shape environmental quality in Sudan? World Development Sustainability. 1(2022), 100029, doi: 10.1016/j.wds.2022.100029.

[7]
Aydin, C., Esen, Ö., 2018. Reducing CO2 emissions in the EU member states: Do environmental taxes work? J. Environ. Plan. Manag. 61(13), 2396-2420.

[8]
Azam, M., 2020. Energy and economic growth in developing Asian economies. J. Asia. Pac. Econ. 25(3), 447-471.

DOI

[9]
Bandyopadhyay, A., Rej, S., Abbasi, K.R., et al., 2022. Nexus between tourism, hydropower, and CO2 emissions in India: fresh insights from ARDL and cumulative Fourier frequency domain causality. Environ. Dev. Sustain. 25(10), 10903-10927.

[10]
Bashir, M.F., Ma, B.J., Shahbaz, M., et al., 2020. The nexus between environmental tax and carbon emissions with the roles of environmental technology and financial development. PLoS One. 15(11), e0242412, doi: 10.1371/journal.pone.0242412.

[11]
Bekun, F.V., Yalçiner, K., Etokakpan, M.U., et al., 2020. Renewed evidence of environmental sustainability from globalization and energy consumption over economic growth in China. Environ. Sci. Pollut. Res. 27, 29644-29658.

[12]
Bello, M.O., Solarin, S.A., Yen, Y.Y., 2018. The impact of electricity consumption on CO2 emission, carbon footprint, water footprint and ecological footprint: The role of hydropower in an emerging economy. J. Environ. Manage. 219, 218-230.

[13]
Bilgili, F., Lorente, D.B., Kuşkaya, S., et al., 2021. The role of hydropower energy in the level of CO2 emissions: An application of continuous wavelet transform. Renew. Energy. 178, 283-294.

[14]
Bilgili, F., Soykan, E., Dumrul, C., et al., 2023. Disaggregating the impact of natural resource rents on environmental sustainability in the MENA region: A quantile regression analysis. Resour. Policy. 85, 103825, doi: 10.1016/j.resourpol.2023.103825.

[15]
Borucke, M., Moore, D., Cranston, G., et al., 2013. Accounting for demand and supply of the biosphere’s regenerative capacity: The National Footprint Accounts’ underlying methodology and framework. Ecol. Indic. 24, 518-533.

[16]
British Petroleum, 2022. bp Statistical Review of World Energy. [2024-03-23]. https://www.bp.com/content/dam/bp/business-sites/en/global/corporate/pdfs/energy-economics/statistical-review/bp-stats-review-2022-full-report.pdf

[17]
Caglar, A.E., Daştan, M., Mehmood, U., et al., 2024. Assessing the connection between competitive industrial performance on load capacity factor within the LCC framework: Implications for sustainable policy in BRICS economies. Environ. Sci. Pollut. Res. 31(60), 67197-67214.

[18]
Chen, C.C., 2024. Comparative impacts of energy sources on environmental quality: A five-decade analysis of Germany’s Energiewende. Energy Rep. 11, 3550-3561.

[19]
Christmann, P., Taylor, G., 2001. Globalization and the environment: Determinants of firm self-regulation in China. J. Int. Bus. Stud. 32(3), 439-458.

[20]
Costanza, R., 2000. The dynamics of the ecological footprint concept. Ecol. Econ. 32(3), 341-345.

[21]
Destek, M.A., Aslan, A., 2020. Disaggregated renewable energy consumption and environmental pollution nexus in G-7 countries. Renew. Energy. 151, 1298-1306.

[22]
Doğan, B., Chu, L.K., Ghosh, S., et al., 2022. How environmental taxes and carbon emissions are related in the G 7 economies? Renew. Energy. 187, 645-656.

[23]
Emir, F., Karlilar, S., 2023. Application of RALS cointegration test assessing the role of natural resources and hydropower energy on ecological footprint in emerging economy. Energy Environ. 34(4), 764-779.

[24]
Erdoğan, S., Çakar, N.D., Ulucak, R., et al., 2021. The role of natural resources abundance and dependence in achieving environmental sustainability: Evidence from resource‐based economies. Sustain. Dev. 29(1), 143-154.

[25]
European Environment Agency, 2023. State of Europe’s Environment. [2024-04-01]. https://www.eea.europa.eu/en/topics/at-a-glance/state-of-europes-environment

[26]
Famulska, T., Kaczmarzyk, J., Grząba-Włoszek, M., 2022. Environmental taxes in the member states of the European Union—Trends in energy taxes. Energies. 15(22), 8718, doi: 10.3390/en15228718.

[27]
Gao, X.D., Fan, M.J., 2023. Environmental taxes, eco-innovation, and environmental sustainability in EU member countries. Environ. Sci. Pollut. Res. 30(45), 101637-101652.

[28]
Ghosh, S., 2010. Examining carbon emissions economic growth nexus for India: A multivariate cointegration approach. Energy Policy. 38(6), 3008-3014.

[29]
Global Footprint Network, 2023. Ecological Footprint. [2024-04-01]. https://www.footprintnetwork.org/our-work/ecological-footprint/

[30]
Hao, L.N., Umar, M., Khan, Z., et al., 2021. Green growth and low carbon emission in G 7 countries: How critical the network of environmental taxes, renewable energy and human capital is? Sci. Total Environ. 752, 141853, doi: 10.1016/j.scitotenv.2020.141853.

[31]
Ibrahim, S.S., Samour, A., Almassri, H., et al., 2024. Renewable energy, financial globalization and load capacity factor in the US: Ecological neutrality in the context of natural resources. Geol. J. 59(11), 3017-3032.

[32]
Işık, C., Dogru, T., Turk, E.S., 2018. A nexus of linear and non-linear relationships between tourism demand, renewable energy consumption, and economic growth: Theory and evidence. Int. J. Tour. Res. 20(1), 38-49.

[33]
Işık, C., Ongan, S., Özdemir, D., 2019. Testing the EKC hypothesis for ten US states: An application of heterogeneous panel estimation method. Environ. Sci. Pollut. Res. 26(11), 10846-10853.

[34]
Işık, C., Bulut, U., Ongan, S., et al., 2024. Exploring how economic growth, renewable energy, internet usage, and mineral rents influence CO2 emissions: A panel quantile regression analysis for 27 OECD countries. Resour. Policy. 92, 105025, doi: 10.1016/j.resourpol.2024.105025.

[35]
Jahanger, A., Usman, M., Balsalobre-Lorente, D., 2021. Autocracy, democracy, globalization, and environmental pollution in developing world: Fresh evidence from STIRPAT model. J. Public Aff. 22(4), e2753, doi: 10.1002/pa.2753.

[36]
Kalaycı, C., Hayaloğlu, P., 2019. The impact of economic globalization on CO2 emissions: The case of NAFTA countries. International Journal of Energy Economics and Policy. 9(1), 356-360.

[37]
Kocoglu, M., Awan, A., Tunc, A., et al., 2021. The nonlinear links between urbanization and CO2: Evidence from unconditional quantile and threshold regression. Research Square. 2021, doi: 10.21203/rs.3.rs-676290/v1.

[38]
KOF Swiss Economic Institute, 2022. KOF Index of Globalization. [2024-04-04]. https://kof.ethz.ch/en/forecasts-and-indicators/indicators/kof-globalisation-index.html

[39]
Le, H.P., Ozturk, I., 2020. The impacts of globalization, financial development, government expenditures, and institutional quality on CO2 emissions in the presence of environmental Kuznets curve. Environ. Sci. Pollut. Res. 27(18), 22680-22697.

[40]
Lenz, N.V., Fajdetić, B., 2021. Globalization and GHG emissions in the EU: Do we need a new development paradigm? Sustainability. 13(17), 9936, doi: 10.3390/su13179936.

[41]
Lin, D., Hanscom, L., Murthy, A., et al., 2018. Ecological footprint accounting for countries: Updates and results of the National Footprint Accounts, 2012-2018. Resources-Basel. 7(3), 58, doi: 10.3390/resources7030058.

[42]
Majeed, A., Wang, L.J., Zhang, X.H., et al., 2021. Modeling the dynamic links among natural resources, economic globalization, disaggregated energy consumption, and environmental quality: Fresh evidence from GCC economies. Resour. Policy. 73, 102204, doi: 10.1016/j.resourpol.2021.102204.

[43]
Mehboob, M.Y., Ma, B.J., Sadiq, M., et al., 2024. How do nuclear energy consumption, environmental taxes, and trade globalization impact ecological footprints? Novel policy insight from nuclear power countries. Energy. 313, 133661, doi: 10.1016/j.energy.2024.133661.

[44]
Mehmood, S., Kaewsaeng-on, R., 2024. Quantifying environmental degradation through renewable energy, financial development and economic sustainability: Insights from panel quantile regression analysis. Glob. Bus. Rev. 09721509241242530, doi: 10.1177/09721509241242530.

[45]
Mikayilov, J.I., Mukhtarov, S., Mammadov, J., et al., 2019. Re-evaluating the environmental impacts of tourism: Does EKC exist? Environ. Sci. Pollut. Res. 26(31), 32674, doi: 10.1007/s11356-019-05269-w.

[46]
Mohsin, M., Orynbassarov, D., Anser, M.K., et al., 2023. Does hydropower energy help to reduce CO2 emissions in European Union countries? Evidence from quantile estimation. Environ. Dev. 45, 100794, doi: 10.1016/j.envdev.2022.100794.

[47]
Murshed, M., Alam, R., Ansarin, A., 2021. The environmental Kuznets curve hypothesis for Bangladesh: the importance of natural gas, liquefied petroleum gas, and hydropower consumption. Environ. Sci. Pollut. Res. 28(14), 17208-17227.

[48]
Nica, E., Poliakova, A., Popescu, G.H., et al., 2023. The impact of financial development, health expenditure, CO2 emissions, institutional quality, and energy mix on life expectancy in Eastern Europe: CS-ARDL and quantile regression Approaches. Heliyon. 9(11), e21084, doi: 10.1016/ j.heliyon.2023.e21084.

[49]
OECD (Organisation for Economic Cooperation and Development), 2023. OECD Data Explorer. [2024-04-09]. https://stats.oecd.org/

[50]
Olabi, A.G., 2012. Developments in sustainable energy and environmental protection. Energy. 39(1), 2-5.

[51]
Ozcan, B., Depren, S.K., Kartal, M.T., 2024. Impact of nuclear energy and hydroelectricity consumption in achieving environmental quality: Evidence from load capacity factor by quantile based nonlinear approaches. Gondwana Res. 129, 412-424.

[52]
Ozturk, I., Al-Mulali, U., Saboori, B., 2016. Investigating the environmental Kuznets curve hypothesis: The role of tourism and ecological footprint. Environ. Sci. Pollut. Res. 23(2), 1916-1928.

[53]
Pata, U.K., 2018. Renewable energy consumption, urbanization, financial development, income and CO2 emissions in Turkey: Testing EKC hypothesis with structural breaks. J. Clean Prod. 187, 770-779.

[54]
Pata, U.K., Aydin, M., 2020. Testing the EKC hypothesis for the top six hydropower energy-consuming countries: Evidence from Fourier Bootstrap ARDL procedure. J. Clean Prod. 264, 121699, doi: 0.1016/j.jclepro.2020.121699.

[55]
Pata, U.K., 2021a. Linking renewable energy, globalization, agriculture, CO2 emissions and ecological footprint in BRIC countries: A sustainability perspective. Renew. Energy. 173, 197-208.

[56]
Pata, U.K., 2021b. Do renewable energy and health expenditures improve load capacity factor in the USA and Japan? A new approach to environmental issues. Eur. J. Health Econ. 22(9), 1427-1439.

[57]
Pata, U.K., Isik, C., 2021. Determinants of the load capacity factor in China: A novel dynamic ARDL approach for ecological footprint accounting. Resour. Policy. 74, 102313, doi: 10.1016/j.resourpol.2021.102313.

[58]
Pata, U.K., Kartal, M.T., 2023. Impact of nuclear and renewable energy sources on environment quality: Testing the EKC and LCC hypotheses for South Korea. Nucl. Eng. Technol. 55(2), 587-594.

[59]
Pesaran, M.H., Yamagata, T., 2008. Testing slope homogeneity in large panels. J. Econom. 142(1), 50-93.

[60]
Rafique, M.Z., Fareed, Z., Ferraz, D., et al., 2022. Exploring the heterogenous impacts of environmental taxes on environmental footprints: An empirical assessment from developed economies. Energy. 238(A), 121753, doi: 10.1016/j.energy.2021.121753.

[61]
Rees, W.E., 1992. Ecological footprints and appropriated carrying capacity:What urban economics leaves out. In: Tacoli, C., (ed.). The Earthscan Reader in Rural-Urban Linkages (1st ed.). London: Routledge, 121-130.

[62]
Rehman, A., Alam, M.M., Ozturk, I., et al., 2023. Globalization and renewable energy use: How are they contributing to upsurge the CO₂ emissions? A global perspective. Environ. Sci. Pollut. Res. 30(4), 9699-9712.

[63]
Samour, A., Radmehr, R., Ali, E.B., et al., 2024. The role of financial inclusion and technological innovation in stimulating environmental sustainability in the European countries: A new perspective based on load capacity factor. Heliyon. 10(22), e39970, doi: 10.1016/j.heliyon.2024.e39970.

[64]
Shahbaz, M., Mahalik, M.K., Shahzad, S.J.H., et al., 2019. Testing the globalization-driven carbon emissions hypothesis: International evidence. International Economics. 158, 25-38.

[65]
Shayanmehr, S., Radmehr, R., Ali, E.B., et al., 2023. How do environmental tax and renewable energy contribute to ecological sustainability? New evidence from top renewable energy countries. Int. J. Sustain. Dev. World Ecol. 30(6), 650-670.

[66]
Siche, R., Pereira, L., Agostinho, F., et al., 2010. Convergence of ecological footprint and emergy analysis as a sustainability indicator of countries: Peru as case study. Commun. Nonlinear Sci. Numer. Simul. 15(10), 3182-3192.

[67]
Solarin, S.A., Bello, M.O., 2018. Persistence of policy shocks to an environmental degradation index: the case of ecological footprint in 128 developed and developing countries. Ecol. Indic. 89, 35-44.

[68]
Steckel, J.C., Brecha, R.J., Jakob, M., et al., 2013. Development without energy? Assessing future scenarios of energy consumption in developing countries. Ecol. Econ. 90, 53-67.

[69]
Tiwari, A.K., Kocoglu, M., Banday, U.J., et al., 2022. Hydropower, human capital, urbanization and ecological footprints nexus in China and Brazil: Evidence from quantile ARDL. Environ. Sci. Pollut. Res. 29(45), 68923-68940.

[70]
Topcu, B.A., 2021. The impact of export, import, and renewable energy consumption on Turkey’s ecological footprint. J. Econ. Finance Account. 8(1), 31-38.

[71]
Ulucak, R., Danish, Kassouri, Y., 2020. An assessment of the environmental sustainability corridor: Investigating the nonlinear effects of environmental taxation on CO2 emissions. Sustain. Dev. 28(4), 1010-1018.

DOI

[72]
Ulussever, T., Kartal, M.T., Pata, U.K., 2024. Environmental role of technology, income, globalization, and political stability: Testing the LCC hypothesis for the GCC countries. J. Clean. Prod. 451, 142056, doi: 10.1016/j.jclepro.2024.142056.

[73]
Uzar, U., Eyuboglu, K., 2022. Does income inequality increase the ecological footprint in the US: Evidence from FARDL test? Environ. Sci. Pollut. Res. 30(4), 9514-9529.

[74]
Vlahinić Lenz, N., Fajdetić, B., 2021. Globalization and GHG emissions in the EU: Do we need a new development paradigm? Sustainability. 13(17), 9936, doi: 10.3390/su13179936.

[75]
Wang, Y., Zhou, T., Chen, H., et al., 2019. Environmental homogenization or heterogenization? The effects of globalization on carbon dioxide emissions, 1970-2014. Sustainability. 11(10), 2752, doi: 10.3390/su11102752.

[76]
Westerlund, J., 2007. Testing for error correction in panel data. Oxf. Bull. Econ. and Stat. 69(6), 709-748.

[77]
World Bank, 2023. World Development Indicators Database. [2024-04-06]. https://databank.worldbank.org/source/world-development-indicators

[78]
Xue, J., Rasool, Z., Nazar, R., et al., 2021. Revisiting natural resources—Globalization-environmental quality nexus: Fresh insights from South Asian countries. Sustainability. 13(8), 4224, doi: 10.3390/su13084224.

[79]
Yang, B., Jahanger, A., Khan, M.A., 2020. Does the inflow of remittances and energy consumption increase CO2 emissions in the era of globalization? A global perspective. Air Qual. Atmos. Health. 13(11), 1313-1328.

[80]
Yang, B., Jahanger, A., Usman, M., et al., 2021. The dynamic linkage between globalization, financial development, energy utilization, and environmental sustainability in GCC countries. Environ. Sci. Pollut. Res. 28 (13), 16568-16588.

[81]
Zaidi, S.A.H., Zafar, M.W., Shahbaz, M., et al., 2019. Dynamic linkages between globalization, financial development and carbon emissions: Evidence from Asia Pacific Economic Cooperation countries. J. Clean. Prod. 228, 533-543.

[82]
Zhang, X.S., Jiang, Q.Q., Iqbal, K.S., et al., 2021. Achieving sustainability and energy efficiency goals: assessing the impact of hydroelectric and renewable electricity generation on carbon dioxide emission in China. Energy Policy. 155, 112332, doi: 10.1016/j.enpol.2021.112332.

Outlines

/