Research article

Renewable energy and its impact on agricultural and economic development in the Netherlands and South Africa

  • Saul NGARAVA , a, b, * ,
  • Alois Aldridge MUGADZA c, d
Expand
  • aCopernicus Institute of Sustainable Development, Faculty of Geosciences, Utrecht University, Utrecht, 3584 CB, the Netherlands
  • bSchool of Natural Science, College of Health and Natural Science, University of Lincoln, Lincoln, LN6 7TS, the United Kingdom
  • cFaculty of Law, The University of the West Indies, Cave Hill Campus, Bridgetown, BB11000, Barbados
  • dGroningen Center for Energy Law, Faculty of Law, University of Groningen, Groningen, 9712 CP, the Netherlands
*E-mail address: (Saul NGARAVA).

Received date: 2024-10-03

  Revised date: 2025-01-08

  Accepted date: 2025-03-21

  Online published: 2025-05-21

Copyright

2666-660X/© 2025 Xinjiang Institute of Ecology and Geography, Chinese Academy of Sciences. Publishing services by Elsevier B.V. on behalf of KeAi Communications Co. Ltd. This is an open access article under the CC BY-NC-ND license (http://creativecommons.org/licenses/by-nc-nd/4.0/).

Abstract

The use of renewable energy is an important way to achieve sustainable agricultural and economic development. However, there are differences in access to renewable energy between the Global North and Global South. This study utilised an autoregressive distributed lag-error correction model and the data spanning from 1991 to 2021 to comparatively analyse the dynamic relationship among renewable energy consumption, the value of agricultural production, gross domestic product (GDP), economic diversification index, urban population, the total water extraction for agricultural withdrawal, and trade balance in the Netherlands and South Africa. In the short run, renewable energy consumption was increased by the value of agricultural production but decreased by GDP in South Africa. In the long run, renewable energy consumption and GDP increased the value of agricultural production, while the value of agricultural production also increased GDP in South Africa. However, in the Netherlands, there was no short- and long-run relationship between renewable energy consumption and agricultural and economic development. The results revealed that there was a short- and long-run relationship in South Africa. Moreover, in the Netherlands, the adjustment speed was -1.46 for renewable energy consumption with an error correction of 0.68 a (8.22 months). In South Africa, the adjustment speed was -1.28 for renewable energy consumption with an error correction of 0.78 a (9.38 months). Therefore, compared to South Africa, renewable energy consumption in the Netherlands takes less time to return to balance after a shock. These findings signify different trajectories on sectoral and economic transition initiatives spurred using renewable energy between the Netherlands and South Africa. Policy relating to initiatives such as “agro-energy communities” in Global South countries such as South Africa should be emphasised to promote the use of renewable energy in the agricultural sector.

Cite this article

Saul NGARAVA , Alois Aldridge MUGADZA . Renewable energy and its impact on agricultural and economic development in the Netherlands and South Africa[J]. Regional Sustainability, 2025 , 6(2) : 100209 . DOI: 10.1016/j.regsus.2025.100209

1. Introduction

The transitioning to renewable energy offers a sustainable consumption pathway into the reduction of greenhouse gas (GHG) emissions, which has been demonstrated to positively affect the ecological footprint (Lin et al., 2024) and ultimately slow down the rate of climate change. This has witnessed a sustained and gradual increase in the use of renewable energy in developed and developing countries. In 2022, global investment in renewable energy reached a record high of 4.95×10¹¹ USD, falling short of the target of over 12.00×10¹¹ USD (REN21, 2023). The Global Status Report on Renewable Energy Systems indicated that by 2022, 174 countries worldwide have established renewable power targets, one third of the total electricity generation was derived from renewable energy, and there was a 17.20% annual growth rate in renewable energy investment (REN21, 2023). This provides a foundation for the achievement of the 2030 Sustainable Development Goals (SDGs).
SDG 12 advocates for sustainable consumption and production patterns. Specifically, SDG 12a aims to bolster technological and scientific capabilities to transition towards sustainable patterns of production and consumption (UN, 2015a, 2023). SDG 7 promotes access to sustainable, modern, reliable, and affordable energy. Specifically, SDG 7.2 emphasizes the augmentation of renewable energy’s share in the total final energy consumption (UN, 2015b, 2023). The impact of this for economic development in developed and developing countries is both a bone of contention and a subject still undergoing evolution. One argument is that developed countries used unsustainable development pathways, as evidenced by the Industrial and Green Revolutions, which have contributed to the present climate crisis, yet now advocate for developing countries to avoid following suit. This is widely considered to be one of the major stumbling blocks in achieving global just energy transitions.
Much research has been done in the Global North on policies related to solar and wind energy (Akizu et al., 2017; Jolly, 2024). These policies have been complemented by a range of financial incentives, including tax exemptions, tax credits, subsidies, grants, and loans, as well as net metering and feed-in tariffs, which have collectively promoted the use of renewable energy. This has resulted in the expansion of green energy, including bioheat in Europe, solar water heating and renewable fuels in North America, etc. (REN21, 2023). The Netherlands serves as a prime example, with its policies such as the Offshore Wind Energy Roadmap, which aims to ensure that 70.00% of electricity is derived from solar and wind energy by 2030 (GoN, 2020). The Sustainable Energy Production and Climate Transition initiative proposes financial incentives for the generation of renewable energy (NLEA, 2023). The Green Deal approach aims to streamline sustainable schemes surrounding private sector (GoN, 2011). These policies have resulted in a 29.00% reduction in GHG emissions during 2005-2019 (European Parliament, 2021). In the Netherlands, 36.10% of the total energy and 50.00% of the electricity are from renewable energy (Statistics Netherlands, 2024). However, despite the global focus on green energy, the Global South did not experience similar levels of success (Apfel et al., 2021). This is because that the Global South bears the greatest burden of climate change and rapid population, which leads energy demand growth (Apfel et al., 2021).
The transitioning to green energy has been hindered by several factors in the Global South, such as financial constraints, the high cost of technologies, a lack of technological capabilities, and specific conditions including lifestyles and behaviours, cultural negligence, and insecure land tenure. This situation has been further exacerbated by threats to job security, the neglect of culture and knowledge systems, and regional differentiation (Apfel et al., 2021). Another hindrance is the productivity and green energy efficiency interface (Ali et al., 2023), which is compromised by dilapidated infrastructure in the Global South. This is despite the measures taken with regard to solar energy (Nfah et al., 2007; Fadare, 2009; Szabo et al., 2011; Komendantova et al., 2020), bioenergy (Mandal et al., 2002; Goldemberg et al., 2004; Hofsetz and Aparecida, 2012), wind energy (Saheb-koussa et al., 2009; Fadare, 2010; Bekele and Tadesse, 2012), and hydropower (Kaunda et al., 2012; Taliotis et al., 2014; Ahlborg and Sjöstedt, 2015) in the Global South. In 2022, the Latin America and Caribbean experienced the largest increase of renewable electricity globally (REN21, 2023). A notable example is South Africa, which allocated 10.47×10⁹ USD in 2020 towards energy subsidies, consequently resulting in renewable energy contributing to 7.30% of the total energy mix (IEA, 2021). The country has also embarked on renewable energy-promoting policies, including the White Paper on the promotion of renewable energy and clean energy development (DoME, 2002) that provides guidelines on how the renewable industry can operate and grow, the Renewable Energy Independent Power Producer Programme (REIPPP) (IEA, 2017) that enables the private sector to become a key player in energy provision, and the Integrated Resource Plan (IRP) that targets having 22.00% of the total energy in the country emanating from renewable energy by 2030 (Briel, 2024). The most important issue, however, is that while the transition to green energy has been widely recognized globally, the Global North and Global South have taken different approaches to the energy transition and achieved different results. Apfel et al. (2021) confirmed that there is no concrete conclusion on the impact of renewable energy consumption on economic growth.
The present study aims to make a comparative analysis of the relationship between renewable energy consumption and agricultural and economic development in the Netherlands and South Africa. The Netherlandish energy legal framework is regulated by various acts and policies. The agricultural sector is identified as one of the primary industrial consumers of energy in the Netherlands. It consumed 6.00% of energy, contributed to 8.00% of the country’s gross domestic product (GDP), and employed 7.50% of the population in 2021 (Wageningen Economic Research, 2023; Data Commons, 2024; StatLine, 2024). The Netherlandish legal system is characterised by a commitment to promoting sustainability and economic growth through a balanced consideration of socioeconomic and environmental factors. The Netherlands has also ratified the Paris Agreement and adopted the European Union (EU) Green Deal along with the Common Agricultural Policy (CAP). The EU Green Deal involves several industries, such as agriculture, energy, and transportation (European Commission, 2021). In addition, it has set ambitious targets for cross-sectoral initiatives, including its commitment to the circular economy. The overarching objective of the Green Deal is to transform the EU’s economy into a modern, resource-efficient, and competitive one, thus ensuring no GHG emissions by 2050. The Farm-to-Fork Strategy, a pivotal initiative within the EU Green Deal, aims to enhance the environmental sustainability of food systems (Boix-Fayos and de Vente, 2023). The EU Green Deal’s objective is twofold: (i) reducing emissions from the agricultural sector by using new technologies and scientific discoveries; and (ii) ensuring that agriculture sector is resilient to the impact of climate change. The overarching objective of the Farm-to-Fork Strategy is to expedite the transition to a sustainable food system, which will play a pivotal role in climate change mitigation and adaptation. This means that employing renewable energy such as solar and wind energy will be necessary to cut emissions in the agriculture sector. The EU Green Deal’s enactment has necessitated the implementation of numerous policies with the agricultural sector, particularly with the introduction of the Farm-to-Fork Strategy (Molek-Kozakowska, 2023). The CAP places a particular emphasis on the socio-ecological objectives of farming and agriculture (European Commission, 2023). It serves as the foundation for the CAP Strategic Plans of the EU member states and aims to reduce the reliance on fossil fuels in the agricultural sector (European Parliament and the Council of the European Union, 2021).
The agricultural sector also has a slight (4.00×10¹² USD; 2.40%) contribution to South Africa’s GDP (DALRD, 2022; WITS, 2024; World Bank, 2024). In South Africa, 2.00% of the total energy (1.30×10⁷ kW•h) is utilised by the agricultural sector, while 7.30% of the total energy is derived from renewable energy (DoMRE, 2021; IEA Bioenergy, 2021). Notably, 10.00% of all solar energy in South Africa is attributed to the agricultural sector (Western Cape Government, 2018). However, in programmes such as the REIPPP, the renewable energy in South Africa is dominated by onshore wind energy, solar photovoltaic, and concentrated solar energy (DoMRE, 2021). The South African legal frameworks on renewable energy describe the objective (transition to renewable energy) of the country (Sutherland et al., 2015). South Africa has also ratified the Paris Agreement; however, the country is confronted with challenges in aligning its legal framework with the evolving agricultural and economic landscapes, particularly within the context of the developing agricultural sector and the persistent reliance on fossil fuels (Uche and Ngepah, 2024). The concept of “Just Transition” recognises the role of the agriculture sector in addressing climate change. Specifically, it acknowledges the need for the agriculture sector to adapt to and mitigate the impact of climate change. The agriculture sector has been earmarked to undergo a transition from fossil fuels to renewable energy, a move that is crucial for ensuring food security in South Africa. South Africa’s National Development Plan aims to reduce poverty and inequality, promote an inclusive economy, and improve public services by 2030 (DoP, 2011). It emphasises environmental sustainability and resilience through investment in agricultural technologies and adaptation strategies (DoP, 2011). The plan also recognises the energy-intensive agricultural sector and encourages farmers to generate energy through agri-voltaics. In addition, the National Environmental Management Act 107 of 1998 has been amended to allow for more solar energy uptake on land, thereby encouraging the transition to renewable energy. The Climate Change Act 22 of 2024 aims to enable South Africa’s transition to a low-carbon, climate-resilient economy and society (GoSA, 2024). This requires cross-sectoral collaboration across sectors and a shift in public and private attitudes towards sustainability. Section 26(3) of the Climate Change Act 22 of 2024 also mandates a national data collection system for GHG emissions and carbon sinks in the agricultural sector (GoSA, 2024).

2. Literature review

Several studies have focused on the relationship between renewable energy consumption and its impact on economic development (El-karimi and El-houjjaji, 2022). The selected literature was limited to time-series evaluations. There are several methods for evaluating the relationship between renewable energy consumption and economic development, including linear regressions, vector autoregressive method, autoregressive conditional heteroscedasticity model, autoregressive moving average model, and autoregressive distributed lag (ARDL) model. Busu (2020), Smolovic et al. (2020), and Slusarczyk et al. (2022) claimed that renewable energy consumption has a positive impact on economic development in developed countries, while Deka et al. (2023) found the same situation in developing countries.
There is also an extensive literature on the impact of renewable energy consumption on economic development in the Netherlands and South Africa. In the Netherlands, there is strong evidence that renewable energy consumption has a positive impact on economic development (Omri et al., 2015; Šimelytė and Dudzevičiūtė, 2017). However, these studies used aggregate analysis focusing on the EU and/or the Organisation for Economic Co-operation and Development. In South Africa, the extensive literature has found no relationship between renewable energy consumption and economic development (Tugcu and Tiwari, 2016; Destek and Aslan, 2017; Nyoni and Phiri, 2020; Aziza et al., 2021; Eyuboglu and Uzar, 2022). Only a few studies, such as Shakouri and Khoshnevis Yzdi (2017) have found a bidirectional impact of renewable energy consumption on economic development.
The Netherlands and South Africa offer compelling and yet contrasting cases for advocating for a transition towards renewable energy. The Netherlands has actively promoted and implemented renewable energy and fossil fuel reduction strategies. However, Busu (2020) pointed out that most EU countries are still lagging their renewable energy consumption targets as set out in the now repealed Directive 2009/28/EC (The European Parliament, 2009). On the other hand, although South Africa actively promotes the use of renewable energy, this has not been translated into active implementation. This is because the country suffers from the energy shortages that characterise many Global South countries. The dilemma is whether to continue with the abundant fossil fuels or try the untested renewables. In the Global North, pro-energy transition advocates argue that economic development should be driven by renewable energy sources, while pro-growth advocates question the prospects for promoting non-fossil fuels, which have not contributed to economic development in the past. In addition, Apfel et al. (2021) argued that studies should also focus on the contextual conditions for effective renewable energy production and consumption.
The Global Status Report on Renewable Energy Systems highlights that some of the biggest challenges to renewable energy deployment are the lack of coordination between demand sectors such as agriculture (REN21, 2023). However, there are also opportunities in terms of integration and providing economies of scale (REN21, 2023). The agricultural sector has seen a significant increase in renewable energy consumption. In 2022, 15.50% of global agricultural energy consumption came from renewable energy, with the fastest annual adoption rate of over 7.00%. Renewable energy in the agricultural sector has mainly been used for self-reliance and income generation, while in Africa it has been used to increase access to energy (REN21, 2023). There is room to expand the use of renewable energy in agriculture, as only 14 countries have targets and policies in the sector, while 7 countries have financial incentives for the use of renewable energy in irrigation. This is despite a doubling of biogas use between 2010 and 2020 (REN21, 2023). This raises fundamental questions about the potential of renewable energy use for agricultural production.
Therefore, this study aims to examine the short- and long-run relationship between renewable energy consumption and agricultural and economic development in the Netherlands and South Africa. We hypothesize that there are no comparative differences in this relationship between these two countries. Furthermore, each country will exhibit either the growth, feedback, or neutral hypothesis. In the growth hypothesis, an increase in renewable energy consumption will lead to agricultural and economic development. The feedback hypothesis emphasizes a two-way causal relationship between renewable energy consumption and agricultural and economic development. The neutral hypothesis exhibits no relationship among renewable energy consumption and agricultural and economic development (El-karimi and El-houjjaji, 2022). The motivation for this study is the lack of comparative studies on renewable energy consumption in countries of the Global North and Global South. Furthermore, the studies of renewable energy have also considered countries in the Global South, particularly in Africa, as homogenous (Apfel et al., 2021). There are sectoral and contextual differences in the subsystems of renewable energy production and consumption subsystems that require in-depth and nuanced analysis. In addition, renewable energy consumption policies in the Netherlands and South Africa have not been informed by the empirical impact of agricultural and economic development. Slusarczyk et al. (2022) confirmed that energy policy cannot be separated from macroeconomic determinants. Furthermore, this study included other economic and agricultural variables such as economic diversification index, GDP, urban population, trade balance, total water extraction for agricultural withdrawal, and the value of agricultural production, which have not been extensively used in assessing the relationship between renewable energy consumption and agricultural and economic development. This study can inform structural reforms needed to sustainably reduce emissions while promoting agricultural and economic development.

3. Materials and methods

3.1. Study area

The study compared the relationship of renewable energy consumption with agricultural and economic development between the Netherlands and South Africa. South Africa, located in the southern tip of Africa, has a population of 61.36×10⁶ compared to the population of 17.81×10⁶ in the Netherlands (Statista Inc., 2024a, b). Yet, the Netherlands, which is in the EU, has a GDP of 1.15×10¹² USD compared to the GDP of 3.81×10¹¹ USD in South Africa. South Africa has the highest global level of income inequality, with a Gini co-efficient of 63.00 compared to the value of 26.40 in the Netherlands (Statista Inc., 2023). Thus, there are higher poverty levels in South Africa compared to the Netherlands. The Netherlands, the second largest global agricultural exporter, is renowned for its high-tech farming and leadership in greenhouse production, with a strong focus on sustainable agricultural practices (DoA, 2023). On the other hand, South Africa is the largest economy in Africa and has one of the better developed agricultural sectors on the continent (Statista Inc., 2025a). However, the contribution of agriculture to GDP is minimal in both countries, i.e., 7.00% in the Netherlands and 2.62% in South Africa (Wageningen Economic Research, 2023; Statista Inc., 2025b, c). There has been a big drive in promoting sustainable production systems in both countries as evidenced by their vast policies, including the Green Deal, Offshore Wind Energy Roadmap, Sustainable Energy Production and Climate Transition, and CAP in the Netherlands and the REIPPP, IRP, National Development Plan, Climate Change Act, and National Environmental Management Act in South Africa. However, it is still not apparent how such policies can affect the agricultural sector and the wider economy.

3.2. Data availability

Table 1 shows the data sources and descriptive statistics of renewable energy consumption, the value of agricultural production, GDP, economic diversification index, urban population, the total water extraction for agricultural withdrawal, and trade balance in the Netherlands and South Africa. These variables have been shown to be related. Renewable energy can be used directly in the agricultural sector to provide the energy needed to increase productivity, which in turn puts pressure on the total water extraction for agricultural withdrawal.
Table 1 Descriptive statistics of the selected variables in the Netherlands and South Africa.
Variable Abbreviation Data source Levene’s test for equality of variance t-test for equality of mean
F-statistic Significance t-statistic Significance Mean difference Standard
error difference
Renewable energy consumption (kW•h) RE FAOSTAT (2024) 52.41 0.00 -2.52 0.00 -3.12×10¹⁰ 1.24×10¹⁰
Economic diversification index EDI Harvard Kennedy School (2024) 5.70 0.02 20.58 0.00 32.60 1.58
Gross domestic product (USD) GDP World Bank (2024) 31.14 0.00 -8.88 0.00 -4.02×10¹¹ 0.45×10¹¹
Urban population (persons) URB World Bank (2024) 35.25 0.00 16.15 0.00 1.68×10⁷ 0.10×10⁷
Trade balance (USD) TB WITS (2024) 42.00 0.00 -9.72 0.00 -4.22×10⁶ 0.43×10⁶
Total water extraction for agricultural withdrawal (m3) WE FAOSTAT (2024) 36.30 0.00 36.02 0.00 9.16×10⁹ 0.25×10⁹
Value of agricultural production (USD) AP FAOSTAT (2024) 0.35 0.56 -13.11 0.00 -6.50×10⁹ 0.48×10⁹

Note: FAOSTAT, Food and Agriculture Organization of the United Nations; WITS, World Integrated Trade Solution.

3.3. Research methods

The autoregressive distributed lag-error correction model (ARDL-ECM) introduced by Pesaran and Shin (1997) and Pesaran et al. (2001) was used in this study to estimate the long-run relationship of renewable energy consumption with the value of agricultural production, GDP, economic diversification index, urban population, the total water extraction for agricultural withdrawal, and trade balance:
REt=f(APt, GDPt, EDIt, URBt, WEt, TBt),
where RE means the renewable energy consumption (kW•h); t is the current time; f is the function; AP is the value of agricultural production (USD); GDP is the gross domestic product (USD); EDI is the economic diversification index; URB is the urban population (persons); WE is the total water extraction for agricultural withdrawal (m3); and TB is the trade balance (USD). To avoid multicollinearity, we took the natural logarithm of the variables and subsequently reorganized the Equation 1 as follows:
lnREt01lnAPt2lnGDPt3lnEDIt4lnURBt5lnWEt6lnTBtt,
where β0 is the constant; β1, β2, β3, β4, β5, and β6 are the coefficients of variables; and εt is the error term.
The ARDL model is ideal because it can be applied to variables that are cointegrated and/or at different orders, i.e., at the level and/or at the first difference, distinguish between exogenous and endogenous variables, and fit data that have small samples (Chandio et al., 2021; Ngarava, 2021).
Y t = ω + i = 1 p α i Y t i + i = 1 q θ i X t i + ε i t ,
where Y is a vector of dependent variable; X is the independent variables; α and θ are the coefficients of dependent and independent variables, respectively; ω is the constant; p and q are the optimal lags of dependent and independent variables, respectively; and i is the lag time. The bound cointegration equations of the ARDL model are shown as follows:
Δ lnRE t = φ 0 + i = 1 n φ 1 i Δ lnRE t 1 + i = 1 n φ 2 i Δ lnAP t 1 + i = 1 n φ 3 i Δ lnGDP t 1 + i = 1 n φ 4 i Δ lnEDI t 1 + i = 1 n φ 5 i Δ lnURB t 1 + i = 1 n φ 6 i Δ lnWE t 1 + i = 1 n φ 7 i Δ lnTB t 1 + β 1 lnRE t 1 + β 2 lnAP t 1 + β 3 lnGDP t 1 + β 4 lnEDI t 1 + β 5 lnURB t 1 + β 6 lnWE t 1 + β 7 lnTB t 1 + ε t ,
Δ lnAP t = φ 0 + i = 1 n φ 1 i Δ lnAP t 1 + i = 1 n φ 2 i Δ lnRE t 1 + i = 1 n φ 3 i Δ lnGDP t 1 + i = 1 n φ 4 i Δ lnEDI t 1 + i = 1 n φ 5 i Δ lnURB t 1 + i = 1 n φ 6 i Δ lnWE t 1 + i = 1 n φ 7 i Δ lnTB t 1 + β 1 lnAP t 1 + β 2 lnRE t 1 + β 3 lnGDP t 1 + β 4 lnEDI t 1 + β 5 lnURB t 1 + β 6 lnWE t 1 + β 7 lnTB t 1 + ε t ,
Δ lnGDP t = φ 0 + i = 1 n φ 1 i Δ lnGDP t 1 + i = 1 n φ 2 i Δ lnRE t 1 + i = 1 n φ 3 i Δ lnAP t 1 + i = 1 n φ 4 i Δ lnEDI t 1 + i = 1 n φ 5 i Δ lnURB t 1 + i = 1 n φ 6 i Δ lnWE t 1 + i = 1 n φ 7 i Δ lnTB t 1 + β 1 lnGDP t 1 + β 2 lnRE t 1 + β 3 lnAP t 1 + β 4 lnEDI t 1 + β 5 lnURB t 1 + β 6 lnWE t 1 + β 7 lnTB t 1 + ε t ,
Δ lnEDI t = φ 0 + i = 1 n φ 1 i Δ lnEDI t 1 + i = 1 n φ 2 i Δ lnRE t 1 + i = 1 n φ 3 i Δ lnAP t 1 + i = 1 n φ 4 i Δ lnGDP t 1 + i = 1 n φ 5 i Δ lnURB t 1 + i = 1 n φ 6 i Δ lnWE t 1 + i = 1 n φ 7 i Δ lnTB t 1 + β 1 lnEDI t 1 + β 2 lnRE t 1 + β 3 lnAP t 1 + β 4 lnGDP t 1 + β 5 lnURB t 1 + β 6 lnWE t 1 + β 7 lnTB t 1 + ε t ,
Δ lnURB t = φ 0 + i = 1 n φ 1 i Δ lnURB t 1 + i = 1 n φ 2 i Δ lnRE t 1 + i = 1 n φ 3 i Δ lnAP t 1 + i = 1 n φ 4 i Δ lnGDP t 1 + i = 1 n φ 5 i Δ lnEDI t 1 + i = 1 n φ 6 i Δ lnWE t 1 + i = 1 n φ 7 i Δ lnTB t 1 + β 1 lnURB t 1 + β 2 lnRE t 1 + β 3 lnAP t 1 + β 4 lnGDP t 1 + β 5 lnEDI t 1 + β 6 lnWE t 1 + β 7 lnTB t 1 + ε t ,
Δ lnWE t = φ 0 + i = 1 n φ 1 i Δ lnWE t 1 + i = 1 n φ 2 i Δ lnRE t 1 + i = 1 n φ 3 i Δ lnAP t 1 + i = 1 n φ 4 i Δ lnGDP t 1 + i = 1 n φ 5 i Δ lnEDI t 1 + i = 1 n φ 6 i Δ lnURB t 1 + i = 1 n φ 7 i Δ lnTB t 1 + β 1 lnWE t 1 + β 2 lnRE t 1 + β 3 lnAP t 1 + β 4 lnGDP t 1 + β 5 lnURB t 1 + β 6 lnEDI t 1 + β 7 lnTB t 1 + ε t ,
Δ lnTB t = φ 0 + i = 1 n φ 1 i Δ lnTB t 1 + i = 1 n φ 2 i Δ lnRE t 1 + i = 1 n φ 3 i Δ lnAP t 1 + i = 1 n φ 4 i Δ lnGDP t 1 + i = 1 n φ 5 i Δ lnEDI t 1 + i = 1 n φ 6 i Δ lnURB t 1 + i = 1 n φ 7 i Δ lnWE t 1 + β 1 lnTNB t 1 + β 2 lnRE t 1 + β 3 lnAP t 1 + β 4 lnGDP t 1 + β 5 lnEDI t 1 + β 6 lnURB t 1 + β 7 lnWE t 1 + ε t ,
where φ0 is the constant; is the mean operator of the first difference; n is the total number of lags; φ1φ7 are the short-run coefficients of the variables; and β1β7 are the long-run coefficients of the variables.
In the bounds test of the ARDL model, the null hypothesis of no cointegration among the dependent and independent variables is rejected when the F-statistic value is above the upper bound. If the F-statistic value is below the lower bound, then the null hypothesis is not rejected. When the F-statistic value falls between the upper and lower bounds, the cointegration between the variables is inconclusive. If there was cointegration established between the variables, then the ARDL model was used to model the short-run relationship between the variables. The ARDL-ECM was then employed to estimate the long-run cointegration between the variables, as follows:
Δ lnRE t = φ 0 + i = 1 n φ 1 i Δ lnRE t 1 + i = 1 n φ 2 i Δ lnAP t 1 + i = 1 n φ 3 i Δ lnGDP t 1 + i = 1 n φ 4 i Δ lnEDI t 1 + i = 1 n φ 5 i Δ lnURB t 1 + i = 1 n φ 6 i Δ lnWE t 1 + i = 1 n φ 7 i Δ lnTB t 1 + η ECT t 1 + ε t ,
Δ lnAP t = φ 0 + i = 1 n φ 1 i Δ lnAP t 1 + i = 1 n φ 2 i Δ lnRE t 1 + i = 1 n φ 3 i Δ lnGDP t 1 + i = 1 n φ 4 i Δ lnEDI t 1 + i = 1 n φ 5 i Δ lnURB t 1 + i = 1 n φ 6 i Δ lnWE t 1 + i = 1 n φ 7 i Δ lnTB t 1 + η ECT t 1 + ε t ,
Δ lnGDP t = φ 0 + i = 1 n φ 1 i Δ lnGDP t 1 + i = 1 n φ 2 i Δ lnRE t 1 + i = 1 n φ 3 i Δ lnAP t 1 + i = 1 n φ 4 i Δ lnEDI t 1 + i = 1 n φ 5 i Δ lnURB t 1 + i = 1 n φ 6 i Δ lnWE t 1 + i = 1 n φ 7 i Δ lnTB t 1 + η ECT t 1 + ε t ,
Δ lnEDI t = φ 0 + i = 1 n φ 1 i Δ lnEDI t 1 + i = 1 n φ 2 i Δ lnRE t 1 + i = 1 n φ 3 i Δ lnAP t 1 + i = 1 n φ 4 i Δ lnGDP t 1 + i = 1 n φ 5 i Δ lnURB t 1 + i = 1 n φ 6 i Δ lnWE t 1 + i = 1 n φ 7 i Δ lnTB t 1 + η ECT t 1 + ε t ,
Δ lnURB t = φ 0 + i = 1 n φ 1 i Δ lnURB t 1 + i = 1 n φ 2 i Δ lnRE t 1 + i = 1 n φ 3 i Δ lnAP t 1 + i = 1 n φ 4 i Δ lnGDP t 1 + i = 1 n φ 5 i Δ lnEDI t 1 + i = 1 n φ 6 i Δ lnWE t 1 + i = 1 n φ 7 i Δ lnTB t 1 + η ECT t 1 + ε t ,
Δ lnWE t = φ 0 + i = 1 n φ 1 i Δ lnWE t 1 + i = 1 n φ 2 i Δ lnRE t 1 + i = 1 n φ 3 i Δ lnAP t 1 + i = 1 n φ 4 i Δ lnGDP t 1 + i = 1 n φ 5 i Δ lnEDI t 1 + i = 1 n φ 6 i Δ lnURB t 1 + i = 1 n φ 7 i Δ lnTB t 1 + η ECT t 1 + ε t ,
Δ lnTB t = φ 0 + i = 1 n φ 1 i Δ lnTNB t 1 + i = 1 n φ 2 i Δ lnRE t 1 + i = 1 n φ 3 i Δ lnAP t 1 + i = 1 n φ 4 i Δ lnGDP t 1 + i = 1 n φ 5 i Δ lnEDI t 1 + i = 1 n φ 6 i Δ lnURB t 1 + i = 1 n φ 7 i Δ lnWE t 1 + η ECT t 1 + ε t ,
where ECTt−1 is the lagged error correction term, which must be significant and negative, indicating that the term maintains an equilibrium association; and η is the coefficient of the lagged error correction term (Chandio et al., 2021).
The ARDL-ECM is ideal because it simultaneously estimates the short- and long-run relationship (Ngarava, 2021). The Durbin-Watson Serial Correlation, Breusch-Godfrey Lagrange Multiplier test, White’s test for heteroscedasticity, and Cumulative sum (CUSUM) of squares tests were used to ascertain the existence of serial correlation and heteroscedasticity in the data set as well as the structural stability of the models. Moreover, the serial correlation test was used to examine whether the residuals are independent, while the heteroscedasticity test was used to examine the equality of variance spread. The data were analysed using STATA 13 (StataCorp, Texas, the USA).

4. Results and discussion

4.1. Descriptive statistics

Figure 1 shows that South Africa had lower renewable energy consumption, economic diversification index, GDP, and trade balance than the Netherlands. However, South Africa had a higher urban population and total water extraction for agricultural withdrawal than the Netherlands. This is peculiar given the abundance of water in the Netherlands relative to South Africa. The value of agricultural production was higher in the Netherlands compared to South Africa before 2009, with a reversal from thereafter. The total water extraction for agricultural withdrawal was actually very high in South Africa compared to the Netherlands, which is due to the limited water available in South Africa (Ngarava et al., 2019).
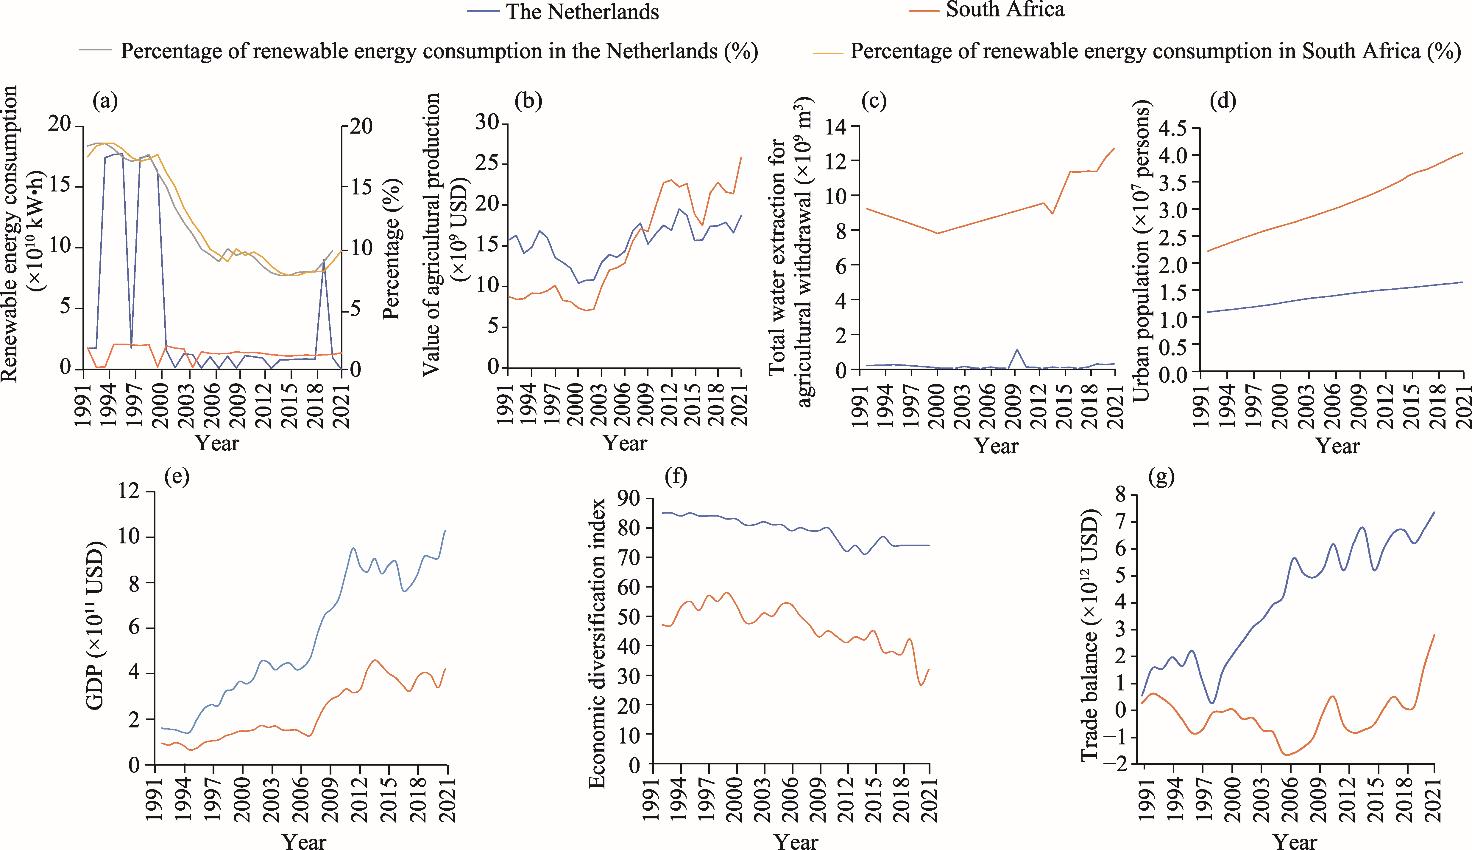
Fig. 1. Variation trends of renewable energy consumption (a), the value of agricultural production (b), the total water extraction for agricultural withdrawal (c), urban population (d), gross domestic product (GDP; e), economic diversification index (f), and trade balance (g) in the Netherlands and South Africa during 1991-2021.
Even though the percentage of renewable energy consumption in the Netherlands and South Africa appeared similar (Fig. 1a), the absolute consumption was different, reflecting the capacities of the renewable energy consumption in the two countries. The Netherlands had the peak renewable energy consumption of 17.70×10¹⁰ kW•h in 1996, while South Africa achieved the peak value of 2.10×10¹⁰ kW•h in 1995. The value of agricultural production in South Africa was lower than that in the Netherlands before 2009, at less than 16.00×10⁹ USD, gradually increasing thereafter and surpassing Netherlands (Fig. 1b). The total water extraction for agricultural withdrawal has remained relatively low in the Netherlands compared to South Africa, which ranged between 8.00×10⁹ and 12.00×10⁹ m3 (Fig. 1c). This is due to the abundance of water in the Netherlands relative to South Africa. Urban population was higher in South Africa than the Netherlands (Fig. 1d). From Figure 1e we can see that GDP changed from 4.00×10¹¹ to 10.00×10¹¹ USD in the Netherlands during 2000-2020. During the same period, GDP in South Africa ranged between 1.50×10¹¹ and 4.40×10¹¹ USD. During 1991-2021, the Netherlands had higher economic diversification index (Fig. 1f) even though the index was decreasing in both countries. The Netherlands experienced positive trade balance and South Africa had intermittent periods of negative trade balance during 1991-2021 (Fig. 1g). Moreover, Table 1 shows the mean differences of the variables between South Africa and the Netherlands. There were significant differences between the means of the variables at the 1% significant level in the Netherlands and South Africa. The mean differences were -3.10×10¹⁰ kW•h, 32.60, -4.02×10¹¹ USD, 1.68×10⁷ persons, -4.22×10¹² USD, 9.16×10⁹ m3, and -6.50×10⁹ USD for renewable energy consumption, economic diversification index, GDP, urban population, trade balance, total water extraction for agricultural withdrawal, and the value of agricultural production between South Africa and the Netherlands, respectively.

4.2. Empirical analysis

A stationarity test was initially performed using the Augmented Dickey-Fuller (ADF) unit root test and thereafter selecting the order of integration. Tables 2-5 show that variables were integrated at the different orders. All variables except for economic diversification index and GDP in the Netherlands, as well as GDP and the total water extraction for agricultural withdrawal in South Africa, were not stationary at the level. In the Netherlands and South Africa, GDP was stationary at the first difference level, whereas stationarity was not obtained for economic diversification index in the Netherlands and the total water extraction for agricultural withdrawal in South Africa. The lag selection criteria in Tables 3 and 5 indicate that there were mixed lags based on the Akaike Information Criterion (AIC) and the Hanna-Quinn Information Criterion (HQIC). There existed the minimum lag of 0 and the maximum lag of 4 in the Netherlands and South Africa.
Table 2 Augmented Dickey-Fuller (ADF) unit root test results in the Netherlands.
lnAP lnEDI lnGDP lnRE
t-statistic Probability t-statistic Probability t-statistic Probability t-statistic Probability
At the level -1.44 0.08 -1.17 0.13 -0.99 0.17 -3.20 0.00
At the first difference level - - -1.00 0.16 -1.29 0.10 - -
lnTB lnURB lnWE
t-statistic Probability t-statistic Probability t-statistic Probability
At the level -2.38 0.01 -6.74 0.00 -3.73 0.00
At the first difference level - - - - - -

Note: -, no value.

Table 3 Optimal lag structure in the Netherlands.
lnAP lnEDI lnGDP lnRE lnTB lnURB lnWE
AIC HQIC AIC HQIC AIC HQIC AIC HQIC AIC HQIC AIC HQIC AIC HQIC
Lag 0 -0.80 -0.79 -3.01 -3.00 0.54 0.55 3.85 3.86 2.32 2.34 -1.62 -1.61 2.11* 2.12*
Lag 1 -2.01* -1.98* -4.58* -4.55* -2.07* -2.04* 3.76 3.79 1.41* 1.44* -9.28 -9.25 2.15 2.17
Lag 2 -1.94 -1.90 -4.55 -4.51 -2.03 -1.99 3.70* 3.74* 1.48 1.52 -9.93 -9.89 2.22 1.27
Lag 3 -1.88 -1.82 -4.51 -4.45 -2.03 -1.97 3.78 3.84 1.50 1.52 -10.19* -10.14* 2.30 2.36
Lag 4 -1.86 -1.79 -4.45 -4.38 -2.05 -1.98 3.78 3.85 1.57 1.64 10.14 -10.08 2.38 2.45

Note: *, significance at the P<0.10 level; AIC, Akaike Information Criterion; HQIC, Hanna-Quinn Information Criterion.

Table 4 ADF unit root test results in South Africa.
lnAP lnEDI lnGDP lnRE
t-statistic Probability t-statistic Probability t-statistic Probability t-statistic Probability
At the level -1.32 0.10 -1.35 0.10 -0.89 0.19 -5.19 0.00
At the first difference level - - - - -1.32 0.10 - -
lnTB lnURB lnWE
t-statistic Probability t-statistic Probability t-statistic Probability
At the level -20.43 0.00 -2.01 0.02 1.18 0.87
At the first difference level - - - - 0.70 0.75

Note: -, no value.

Table 5 Optimal lag structure in South Africa.
lnAP lnEDI lnGDP lnRE lnTB lnURB lnWE
AIC HQIC AIC HQIC AIC HQIC AIC HQIC AIC HQIC AIC HQIC AIC HQIC
Lag 0 0.46 0.47 -0.54 -0.52 1.14 1.16 1.82* 1.83 -3.91 -3.90 -0.88 -0.87 -0.97 -0.95
Lag 1 -1.30 -1.30 -1.42 -1.40 -1.06* -1.04* 1.88 1.90 -4.45* -4.43* -8.66 -8.63 -3.50* -3.47*
Lag 2 -1.26 -1.22 -1.64* -1.60* -1.06 -1.01 1.90 1.94 -4.38 -4.34 -8.77 -8.73 -3.43 -3.39
Lag 3 -1.24 -1.18 -1.57 -1.51 -1.04 0.98 1.85 1.90 -4.31 -4.35 -8.79 -8.74 -3.41 -3.36
Lag 4 -1.38* -1.32* -1.57 -1.50 -0.97 -0.90 1.92 1.99 -4.25 -4.18 -8.85* -8.78* -3.34 -3.27

Note: *, significance at the P<0.10 level.

In the short-run relationship, a 1.00% increase in renewable energy consumption reduced renewable energy consumption by 0.46% in the Netherlands and 0.59% in South Africa during the lagged period (Table 6). A 1.00% increase in the total water extraction for agricultural withdrawal increased renewable energy consumption by 1.18% in the Netherlands during the lagged period. In South Africa, a 1.00% increase in renewable energy consumption led to a 0.05% increase in the value of agricultural production during the lagged period. A 1.00% increase in the value of agricultural production and economic diversification index during the current period increased renewable energy consumption by 8.61% and 0.15%, respectively. However, a 1.00% increase in GDP and urban population during the current period reduced renewable energy consumption by 9.98% and 22.03% in South Africa, respectively. Furthermore, a 1.00% increase in the value of agricultural production, economic diversification index, GDP, and the total water extraction for agricultural withdrawal during the lagged period reduced renewable energy consumption by 8.10%, 10.67%, 6.83%, and 13.93% in South Africa, respectively.
Table 6 ARDL model of short-run relationship among variables in the Netherlands and South Africa.
The Netherlands South Africa
lnRE lnAP lnGDP lnEDI lnWE lnURB lnTB lnRE lnAP lnGDP lnEDI lnWE lnURB lnTB
lnAP 2.89 - 0.87*** −1.12 −0.16 −0.02*** 3.16*** 8.61** - 0.85*** −1.07*** −0.02 −0.02 −0.11
lnAP−1 0.84 0.25 0.38 −0.25 3.11* - - −8.10** 0.38* −0.02 0.02 −0.01 - -
lnAP−2 -4.44 0.25 -0.41 0.05 - - - 6.92** -0.53*** 0.21 -0.41 - - -
lnEDI -12.85 -0.10 0.89 - 5.24 0.02 1.37 0.15* -0.64*** 0.67*** - -0.09 -0.01 -0.15*
lnEDI-1 8.58 0.37 - 0.33 - - - -10.67** 0.33 -0.01 -0.31 0.19 -0.02 -0.13
lnEDI-2 - - - -0.08 - - - -12.37** 0.93*** -0.98*** 0.79* 0.33 - -0.05
lnGDP -6.21 0.83*** - 0.15 -0.30 0.01 -0.41 -9.98** 0.99*** - 0.99*** 0.12 0.01 0.05
lnGDP-1 - -0.66** 0.47 -0.08 - -0.00 - 6.83** -0.33 0.38** -0.12 -0.10 0.01 -
lnGDP-2 - 0.10 0.22 - - 0.00 - 0.53 - - - -0.15 - -
lnRE - 0.00 0.01 -0.00 0.06 0.00 -0.13*** - 0.05** -0.01 0.02 0.02 -0.00 -0.00
lnRE-1 -0.46* 0.01 - 0.00 - - - -0.59** 0.05*** - 0.03 - 0.00 -0.00
lnRE-2 - - - - - - - 0.31 - - 0.01 - - 0.01
lnTB -1.30 0.07** -0.06* 0.02 0.10 0.00 - -15.66 0.37 0.85 -1.03 -0.63 -0.03 0.08
lnTB-1 - -0.02 -0.03 0.03 - - -0.01 0.26 -0.47 - -1.16 0.43 -0.01 -0.03
lnTB-2 - -0.00 -0.03 0.04** - - 0.41** -9.14*** 0.43* - - 0.17 0.00 -
lnURB 311.85 -21.79* -8.86 13.23* - - 5.76** -222.03* 15.44** -21.58** 15.71 12.60** - -0.43
lnURB-1 -718.11 20.91* 37.10 -25.52 - 1.28*** - 25.70 -2.83 12.55 -4.74 -5.49 1.14*** 1.45
lnURB-2 415.80 - -26.84 11.65 - -0.29 - 175.57 12.43** 9.18 -12.01 -6.02* -0.30 -1.24
lnWE -0.57 -0.00 -0.02 0.01 - -0.00 0.01 2.71 0.15 0.30 0.12 - 0.03 -0.15
lnWE-1 1.18** 0.00 -0.04 0.02 - - - 13.93* -0.67 -0.23 -0.26 0.36 - 0.24
lnWE-2 0.68 -0.04 -0.00 0.00 -0.01 - - -19.82** 1.51*** -1.22** 1.51* 0.50 - -0.00
Constant 77.22 17.20 -36.21 17.64 -80.85* 0.42 -140.06 496.47** -9.17 -2.10 26.11* -15.24 1.03 9.62
Probability 0.02 0.00 0.00 0.00 0.43 0.00 0.00 0.07 0.00 0.00 0.00 0.00 0.00 0.06
R2 0.79 0.97 0.99 0.96 0.28 0.99 0.86 0.92 0.99 0.99 0.97 0.99 0.99 0.81
Adjusted R2 0.55 0.91 0.98 0.87 0.01 0.99 0.79 0.64 0.99 0.99 0.89 0.96 0.00 0.50
RMSE 1.15 0.05 0.04 0.02 0.68 0.00 0.34 0.41 0.03 0.05 0.06 0.03 0.00 0.02
F-statistic 5.71 1.43 1.05 2.15 2.38 1.52 4.46 15.40 7.23 4.24 2.10 3.82 0.84 1.63

Note: RMSE, Root Mean Square Error; -, no value. The subscripts -1 and -2 represent lag 1 and lag 2, respectively. *, significance at the P<0.10 level; **, significance at the P<0.05 level; ***, significance at the P<0.01 level.

Table 6 also shows that an increase in GDP and trade balance during the current period and urban population during the lagged period led to the significant increase of the value of agricultural production in the Netherlands. Further, a 1.00% increase in GDP during the lagged period led to a 0.66% reduction in the value of agricultural production, and a 1.00% increase in urban population during the current period resulted in a 21.79% reduction in the value of agricultural production. GDP was increased by the value of agricultural production and decreased by trade balance during the current period in the Netherlands. Comparatively, in South Africa, GDP, renewable energy consumption, and urban population increased by 1.00%, resulting in a decrease in the value of agricultural production by 0.99%, 0.05%, and 15.44%, respectively. Moreover, a 1.00% increase in the value of agricultural production and renewable energy consumption during the lagged period increased the value of agricultural production by 0.38% and 0.05%, respectively. The value of agricultural production and economic diversification index during the current period, and GDP during the lagged period also led to the increase of GDP in South Africa.
There was long-run equilibrium cointegration for renewable energy consumption in the Netherlands and South Africa (Tables 6 and 7). In addition, long-run equilibrium cointegration existed in the total water extraction for agricultural withdrawal, economic diversification index, and trade balance in the Netherlands, while this was also the case for the value of agricultural production, GDP, economic diversification index, and the total water extraction for agricultural withdrawal in South Africa. However, they showed non-stationarity in the unit root test. The ARDL-ECM was therefore necessary to specify the long-run relationship.
Table 7 Autoregressive distributed lag-error correction model (ARDL-ECM) results of long-run relationship among variables in the Netherlands and South Africa.
Variable The Netherlands South Africa
lnRE lnAP lnGDP lnEDI lnWE lnURB lnTB lnRE lnAP lnGDP lnEDI lnWE lnURB lnTB
lnRE - - - - 0.06 - -0.10** - 0.09** -0.01 - -0.12 - -
lnEDI -2.93 - - - 2.13 - 0.96 -14.14* 0.53 -0.52 - 3.07 - -
lnTB -0.90 - - 0.12 -0.06 - -19.24 0.27 1.37 - -0.25 - -
lnGDP -4.26 - - 4.82 -0.19 - -0.29 -2.05 0.57*** - - -1.00 - -
lnURB 6.55 - - -0.84* - - 4.05** -16.29 0.15 0.25 - 7.97 - -
lnAP -0.49 - - -0.42 - - 2.23*** 5.83 1.73*** - -0.27 - -
lnWE 1.67** - - 0.04 2.15 - 0.01 -2.49 0.86*** -1.85*** - - -
Adjustment speed -1.46*** - - -0.75** -0.92*** - -1.28*** -1.15*** -0.62*** - -0.14 - -
R2 0.82 - - 0.79 0.41 - 0.65 0.96 0.97 0.94 - 0.84 - -
Adjusted R2 0.60 - - 0.33 0.22 - 0.83 0.92 0.87 0.87 - 0.55 - -
Root Mean Square Error 1.15 - - 0.02 0.71 - 0.41 0.03 0.04 0.04 - 0.03 - -
Durbin-Watson Serial Correlation test 2.39 2.23 2.56 2.01 2.35 2.19 2.45 2.45 2.03 1.95 1.72 2.58 2.14 2.59
Breusch-Godfrey Lagrange Multiplier test 13.01*** 4.58 6.85** 0.05 16.54*** 3.17 4.98* 16.95*** 17.47*** 12.70** 8.42** 11.28*** 5.33* 13.01***
White’s test for heteroscedasticity 27.00 27.00 27.00 27.00 27.00 27.00 27.00 27.00 27.00 27.00 0.41 27.00 27.00 27.00

Note: -, no value. *, significance at the P<0.10 level; **, significance at the P<0.05 level; ***, significance at the P<0.01 level.

The F-statistic indicated the presence of long-run causal relationships among variables in the Netherlands and South Africa (Table 6). In the long-run relationship, a 1.00% increase in the total water extraction for agricultural withdrawal increased renewable energy consumption by 1.67% in the Netherlands, while it led to the increase of the value of agricultural production by 0.86% and the decrease of GDP by 1.85% in South Africa (Table 7). A surprising relationship was observed between the total water extraction for agricultural withdrawal and renewable energy consumption in the Netherlands, especially considering that renewable energy consumption mainly stems from wind, biomass, solar, and nuclear energy. This relationship appears to be spurious, especially given the abundance of water in the Netherlands that can be used for agricultural extraction. This is also compounded by the low water table due to the terrain, which makes hydroelectricity production virtually negligible. A plausible explanation is the increased use of biomass for renewable energy production. The total water extraction for agricultural withdrawal was used to food, oil, and energy crop production, while livestock waste was converted to energy (GoN, 2016). Zhang et al. (2024) found that renewable energy consumption has a positive impact on water productivity in the USA. The total water extraction for agricultural withdrawal increased the value of agricultural production due to its use as an input in production. However, the negative impact of the total water extraction for agricultural withdrawal on GDP can be explained by the economic building blocks in South Africa (CSIR, 2021). The economy of South African was mainly driven by services, industry, and agriculture and the value of agricultural production accounted for only 2.00% of the country’s GDP. The diversion of water from other key economic sectors to agricultural sector will have a negative impact on the GDP (ADB, 2024; CSIR, 2021).
In South Africa, a 1.00% increase in economic diversification index induced a 14.14% decrease in renewable energy consumption in the long run. However, a 1.00% increase in renewable energy consumption, GDP, and the total water extraction for agricultural withdrawal induced 0.09%, 0.57%, and 0.86% increases in the value of agricultural production, respectively. Jebli and Youssef (2015), Tan et al. (2022), and Nendissa et al. (2023) also found that renewable energy consumption has a positive impact on the value of agricultural production. In fact, a report by Western Cape Government (2018) actually confirmed that 10.00% of all solar energy in South Africa was used in the agricultural sector. This is significant in South Africa’s agricultural sector given the intermittent power outages due to load shedding that the country is currently experiencing (Cloete et al., 2023). Renewable energy consumption fills this gap and has a profound impact on productivity (Hlomendlini, 2025). The use of renewable energy is encouraged by globalisation and can be actively exploited in the value of agricultural production. This is due to its environmental sustainability coupled with low cost and productivity (Tan et al., 2022). Nendissa et al.(2023) claimed that the continued use of renewable energy in agro-value chains inevitably puts pressure on public and private demand. This has a reinforcing effect, especially when agricultural products are cheap inputs for renewable energy production (Nendissa et al., 2023).
The results are consistent with the growth hypothesis proposed by El-karimi and El-houjjaji (2022), where there is a unitary causation between renewable energy consumption and the value of agricultural production in South Africa. In addition, a feedback hypothesis of bidirectional causation was also satisfied between GDP and the value of agricultural production in South Africa. There was a neutrality hypothesis of no causal relationship among renewable energy consumption, GDP, and the value of agricultural production in the Netherlands (El-karimi and El-houjjaji, 2022). He et al. (2024) found that there is a positive association of food production with renewable energy consumption and GDP in the G20 countries.
In the Netherlands, the adjustment speed of renewable energy consumption was -1.46 with an error correction of 0.68 a (8.22 months). In South Africa, the adjustment speeds of renewable energy consumption, the value of agricultural production, and GDP was -1.28, -1.15, and -0.62, respectively. The time to restore equilibrium was therefore 0.78 a (9.38 months), 0.87 a (10.43 months), and 1.61 a (19.35 months), respectively. Thus, the Netherlands needs less time to return to renewable energy consumption equilibrium due to shocks. The Durbin-Watson Serial Correlation test showed that there is no correlation among variables in the Netherlands and South Africa, while the White’s test for heteroscedasticity indicated no heteroscedasticity among variables. The CUSUM of square tests showed that there is stability in the renewable energy consumption, the value of agricultural production, and the total water extraction for agricultural withdrawal in the Netherlands, while the value of agricultural production and GDP appears stable in South Africa.

5. Conclusions and recommendations

This study used the ARDL-ECM to analyse the relationship among renewable energy consumption, the value of agricultural production, GDP, economic diversification index, urban population, the total water extraction for agricultural withdrawal, and trade balance in the Netherlands and South Africa during 1991-2021. In the short run, renewable energy consumption was increased by agricultural development but decreased by economic development in South Africa. However, in the Netherlands, there was no short run relationship among renewable energy consumption and agricultural and economic development. In the long run, renewable energy consumption and GDP increased the value of agricultural production, while the value of agricultural production also increased GDP in South Africa. However, compared to South Africa, renewable energy consumption in the Netherlands took less time to return to balance after a shock.
In conclusion, there indeed exist two different stories in the interaction of renewable energy consumption and agricultural and economic development in the Netherlands and South Africa. The hypothesis of no differences between two countries was rejected. The hypothesis was demonstrated by the increasing renewable energy consumption driven by agricultural development in South Africa. This is quite promising in a country that heavily relies on fossil fuel used to fuel the manufacturing and mining sectors, which are the backbone of that country. Agricultural sector can successfully contribute to sustainable development of the country by using renewable energy. In the same vein, the feedback hypothesis is also exhibited in the reinforcing increase between agricultural and economic development. The Netherlands exhibited the neutrality hypothesis, showing no relationship among renewable energy consumption and agricultural and economic development. On the one hand, this is concerning especially due to the advocacy towards sustainability in first world countries such as the Netherlands. On the other hand, it indicates that renewable energy is being used in sectors other than agriculture. Renewable energy consumption increases agricultural and economic development in South Africa. However, this is not the case in Global North countries such as the Netherlands. This may indeed be due to different economic models, a debate that can be pursued in further studies. Any sustainability stimulus in the future will need to reconsider the contribution of sectors such as agriculture in the Global South, a very contentious issue at the Azerbaijan Conference of the Parties (COP) 29 of the United Nations Framework Convention on Climate Change (UNFCCC) meeting.
This study recommends the promotion of renewable energy in South Africa’s agricultural sector. This can be enhanced by promoting clean energy and agricultural value chains to create multiplier effects. Subsidies such as those used in Europe can be used to promote the production, distribution, and consumption of renewable energy in South Africa. One effective way is the promotion of agro-energy communities, where renewable energy is produced and self-governed for agricultural production purposes. Further studies can focus on identifying which renewable energy is more important in promoting agricultural and economic development. Another limitation is that agricultural and economic development, as measured by the value of agricultural production and GDP, tends to neglect non-market transactions, inflation, and mask inequalities. Further studies should also include the non-market values of agricultural and economic activities, as well as inflation and inequalities. In order to improve the external validity of the results and to draw broad comparative between the Global North and Global South, further studies can cover more countries and longer period. Moreover, the limitations of internal validity of the results can also be overcome by the inclusion of more variables, such as efficiency, energy prices, and government regulation.

Authorship contribution statement

Saul NGARAVA: conceptualization, formal analysis, methodology, and writing - review & editing; and Alois Aldridge MUGADZA: conceptualization and writing - original draft. All authors approved the manuscript.

Ethics statement

Ethics approval was obtained from the North West University in South Africa (Ethical Clearance No: NWU-01216-21-S3 Law). All participants provided their consent to participate in this study.

Declaration of conflict of interest

The authors declare that they have no known competing financial interests or personal relationships that could have appeared to influence the work reported in this paper.

This work is based on the research supported wholly by the National Research Foundation (NRF) of South Africa and the Dutch Research Council (NWO) Project (UID 129352). The NRF and NWO are thanked for their financial contribution. Any opinion, finding, conclusion or recommendation expressed in this manuscript is that of the authors and the NRF and NWO do not accept any liability in this regard. Further acknowledgement is targeted towards the Environmental Rural Solution (ERS), Vaalharts Water User Association, and World Wildlife Fund (WWF)-South Africa in assistance with the data collection process.

[1]
ADB (African Development Bank), 2024. African Economic Outlook 2024: Driving Africa’s Transformation: The Reform of the Global Financial Architecture. [2025-01-04]. https://www.afdb.org/sites/default/files/2024/06/06/aeo_2024_-_country_notes.pdf

[2]
Ahlborg, H., Sjöstedt, M., 2015. Small-scale hydropower in Africa: Socio-technical designs for renewable energy in Tanzanian villages. Energy Res. Soc. Sci. 5, 20-33.

[3]
Akizu, O., Urkidi, L., Bueno, G., et al., 2017. Tracing the emerging energy transitions in the Global North and the Global South. Int. J. Hydrog. Energy. 42(28), 18045-18063.

[4]
Ali, Q., Anwar, S., Tariq, M., et al., 2023. Estimation of economic, environmental, and social efficiency for sustainable development in G-8 and SAARC countries: A data envelopment analysis. Environ. Sci. Pollut. Res. 30, 26819-26842.

[5]
Apfel, D., Haag, S., Herbes, C., 2021. Research agendas on renewable energies in the Global South: A systematic literature review. Renew. Sust. Energ. Rev. 148, 111228, doi: 10.1016/j.rser.2021.111228.

[6]
Aziza, S., Aktolkin, A., Erdal, B.F., et al., 2021. Analysis of the relationship between renewable energy and economic growth in selected developing countries. International Journal of Energy Economics and Policy. 11(1), 110-116.

[7]
Bekele, G., Tadesse, G., 2012. Feasibility study of small Hydro/PV/Wind hybrid system for off-grid rural electrification in Ethiopia. Appl. Energy. 97, 5-15.

[8]
Boix-Fayos, C., de Vente, J., 2023. Challenges and potential pathways towards sustainable agriculture within the European Green Deal. Agric. Syst. 207, 103634, doi: 10.1016/j.agsy.2023.103634.

[9]
Briel, G., 2024. South Africa’s Draft Integrated Resource Plan Undermines its Climate Ambitions. [2024-08-24]. https://www.tralac.org/documents/blogs/5184-tralac-blog-briel-south-africa-s-draft-integrated-resource-plan-16012024/file.html

[10]
Busu, M., 2020. Analyzing the impact of the renewable energy sources on economic growth at the EU level using an ARDL model. Mathematics. 8(8), 1636, doi: 10.3390/math8081367.

[11]
Chandio, A.A., Akram, W., Ozturk, I., et al., 2021. Towards long-term sustainable environment: Does agriculture and renewable energy consumption matter? Environ. Sci. Pollut. Res. 28, 53141-53160.

[12]
Cloete, K., Pienaar, L., van der Merwe, M., 2023. Is persistent “loadshedding” pulling the plug on agriculture in the Western Cape, South Africa? Agrekon. 62, 228-240.

[13]
CSIR (Council for Scientific and Industrial Research), 2021. Decoupling South Africa’s Development from Water Demand through a Circular Economy. [2025-01-04]. https://www.circulareconomy.co.za/wp-content/uploads/2021/11/8.-Water_CE-Briefing-Note.pdf

[14]
DALRD (Department of Agriculture, Land Reform and Rural Development), 2022. Economic Review of the South African Agriculture. [2024-08-01]. http://www.dalrrd.gov.za/phocadownloadpap/Statistics_and_Economic_Analysis/Statistical_Information/Economic%20Review%202021-22.pdf

[15]
Data Commons, 2024. Netherlands. [2024-08-01]. https://datacommons.org/place/country/NLD?utm_medium=explore&mprop=amount&popt=EconomicActivity&cpv=activitySource,GrossDomesticProduction&hl=en

[16]
Deka, A., Ozdeser, H., Seraj, M., et al., 2023. Does energy efficiency, renewable energy and effective capital promote economic growth in the emerging 7 economies? New evidence from CS-ARDL model. Futur. Bus. J. 9, 52, doi: 10.1186/s43093-023-00235-y.

[17]
Destek, A.M., Aslan, A., 2017. Renewable and non-renewable energy consumption and economic growth in emerging economies: Evidence from bootstrap panel causality. Renew. Energy. 111, 757-763.

[18]
DoA (Department of Agriculture), 2023. The Netherlands: A Model of Success in Agriculture. [2024-08-01]. https://hdoa.hawaii.gov/add/files/2024/06/Dutch-Ag-Success_03R2.pdf

[19]
DoME (Department of Minerals and Energy), 2002. White Paper on the Promotion of Renewable Energy and Clean Energy Development: Part One-Promotion of Renewable Energy. [2024-08-01]. https://www.gov.za/sites/default/files/gcis_document/201409/rewp2208022.pdf

[20]
DoMRE (Department of Mineral Resources), 2021. The South African Energy Sector Report. [2024-08-01]. https://www.dmre.gov.za/Portals/0/Energy_Website/files /media/explained/2021-South-African-Energy-Sector-Report.pdf

[21]
DoP (Department of the Presidency), 2011. National Development Plan. [2024-08-01]. https://www.nationalplanningcommission.org.za/National_Development_Plan

[22]
El-karimi, M., El-houjjaji, H., 2022. Economic growth and renewable energy consumption nexus in G 7 countries: Symmetric and asymmetric causality analysis in frequency domain. J. Clean. Prod. 342, 130618, doi: 10.1016/j.jclepro.2022.130618.

[23]
European Commission, 2021. European Green Deal: Research & Innovation Call. [2024-08-01]. https://cinea.ec.europa.eu/funding-opportunities/calls-proposals/european-green-deal-research-innovation-call_en

[24]
European Commission, 2023. Common Agricultural Policy: 2023-27. [2024-08-19]. https://agriculture.ec.europa.eu/common-agricultural-policy/cap-overview/cap-2023-27_en#:-:text=It%20seeks%20to%20ensure%20a,adapt%20measures%20to%20local%20conditions

[25]
European Parliament, 2021. Climate Action in the Netherlands: Latest State of Play. [2024-08-01]. https://www.europarl.europa.eu/thinktank/en/document/EPRS_BRI(2021)696184

[26]
European Parliament and the Council of the European Union, 2021. Regulation (EU) 2021/ 2115 of the European Partliament and of the Council. [2024-08-01]. https://eur-lex.europa.eu/eli/reg/2021/2115/oj/eng

[27]
Eyuboglu, K., Uzar, U., 2022. Asymmetric causality between renewable energy consumption and economic growth: Fresh evidence from some emerging countries. Environ. Sci. Pollut. Res. 29, 21899-21911.

[28]
Fadare, D.A., 2009. Modelling of solar energy potential in Nigeria using an artificial neural network model. Appl. Energy. 86(9), 1410-1422.

[29]
Fadare, D.A., 2010. The application of artificial neural networks to mapping of wind speed profile for energy application in Nigeria. Appl. Energy. 87(3), 934-942.

[30]
FAOSTAT (Food and Agriculture Organization of the United Nations), 2024. Agricultural Production. [2024-08-22]. https://www.fao.org/faostat/en/#data

[31]
Goldemberg, G., Coelho, S.T., Nastari, P.M., et al., 2004. Ethanol learning curve—the Brazilian experience. Biomass Bioenerg. 26(3), 301-304.

[32]
GoN (Government of the Netherlands), 2011. Grean Deal. [2024-08-05]. https://www.iea.org/policies/5333-green-deals

[33]
GoN, 2016. Government Stimulates Biomass Energy. [2024-08-13]. https://www.government.nl/topics/renewable-energy/government-stimulates- biomass-energy

[34]
GoN, 2020. North Sea Energy Outlook Establishes Framework Conditions for Future Growth of Offshore Wind Energy. [2024-08-05]. https://www.government.nl/latest/news/2020/12/04/north-sea-energy-outlook-establishes-framework-conditions-for-future-growth-of-offshore-wind-energy

[35]
GoSA (Government of South Africa), 2024. Climate Change Act No. 22 of 2024. Pretoria, South Africa. [2024-08-05]. https://www.gov.za/sites/default/files/gcis_document/202407/50966climatechangeact222024.pdf

[36]
Harvard Kennedy School, 2024. Country and Product Complexity Rankings. [2024-08-01]. https://atlas.hks.harvard.edu/rankings

[37]
He, K., Shahzadi, I., Khan, S., et al., 2024. The dilemma of water, food, and greener energy nexus: A novel context of COP 27 for G20 economies. Land Degrad. Dev. 35(9), 2993-3006.

[38]
Hlomendlini, H., 2025. It’s Time for Agriculture to Build Resilience-by Investing in Alternative Energy Sources. [2024-08-09]. https://hdl.handle.net/10520/ejc-farmweek_v2023_n23005_a5

[39]
Hofsetz, K., Aparecida, M., 2012. Brazilian sugarcane bagasse: Energy and non-energy consumption. Biomass Bioenerg. 46, 564-573.

[40]
IEA (International Energy Agency), 2017. Renewable Energy Independent Power Producer Programme (REIPPP). [2024-08-05]. https://www.iea.org/policies/5393-renewable-energy-independent-power-producer-programme-reippp

[41]
IEA, 2021. Energy Systems of South Africa. [2024-08-05]. https://www.iea.org/countries/south-africa

[42]
IEA Bioenergy, 2021. Country Reports: Implementation of Bioenergy in South Africa- 2021 Update. [2024-08-05]. https://www.ieabioenergy.com/wp-content/uploads/2021/11/CountryReport2021_SouthAfrica_final.pdf

[43]
Jebli, B., Youssef, B., 2015. Renewable Energy Consumption and Agriculture: Evidence for Cointegration and Granger Causality for Tunisian Economy. [2024-08-01]. https://mpra.ub.uni-muenchen.de/68018/

[44]
Jolly, S., 2024. Conflicting actor narratives and institutional challenges for just energy transitions in the Global North and the Global South:Case of offshore wind energy in Norway and India. In: 5th Indian Public Policy Network Conference. Bombay: Indian Institute of Technology Bombay (IITB) India.

[45]
Kaunda, C.S., Kimambo, C.Z., Nielsen, T.K., 2012. Potential of small-scale hydropower for electricity generation in Sub-Saharan Africa. Renew. Energy. 2012, 132606, doi: 10.5402/2012/132606.

[46]
Komendantova, N., Patt, A., Barras, L., et al., 2020. Perception of risks in renewable energy projects: The case of concentrated solar power in North Africa. Energy Policy. 40, 103-109.

[47]
Lin, Y., Mahmood, A.M., Meng, W.T., et al., 2024. Green economy transition in Asia Pacific: A holistic assessment of renewable energy production. J. Clean. Prod. 437, 140648, doi: 10.1016/j.jclepro.2024.140648.

[48]
Mandal, K.G., Saha, K.P., Ghosh, P.K., et al., 2002. Bioenergy and economic analysis of soybean-based crop production systems in central India. Biomass Bioenerg. 23(5), 337-345.

[49]
Molek-Kozakowska, K., 2023. The hybrid discourse of the ‘European Green Deal’: Road-mapping economic transition to environmental sustainability (almost) seamlessly. Crit. Discourse Stud. 21(2), 182-199.

[50]
Nendissa, D.R., Iriany, A., Sui, J.M., et al., 2023. The role of renewable and nonrenewable energy on agricultural economics in Indonesia. International Journal of Energy Economics and Policy. 12(3), 352-360.

[51]
Nfah, E.M., Ngundam, J.M., Tchinda, R., 2007. Modelling of solar/diesel/battery hybrid power systems for far-north Cameroon. Renew. Energy. 32(5), 832-844.

[52]
Ngarava, S., Zhou, L., Monde, N., 2019. Gendered water insecurity: A structural equation approach for female headed households in South Africa. Water. 11(12), 2491, doi: 10.3390/w11122491.

[53]
Ngarava, S., 2021. Relationship between economic diversification and CO2emissions: ARDL-EC modeling in South Africa ARDL-EC modeling in South Africa. Dev. Stud. Res. 8, 264-279.

[54]
NLEA (Netherlands Enterprise Agency), 2023. Stimulation of Sustainable Energy Production and Climate Transition (SDE++). [2024-08-05]. https://english.rvo.nl/subsidies-financiering/sde

[55]
Nyoni, B., Phiri, A., 2020. Renewable energy: Economic growth nexus in South Africa: Linear, nonlinear or non-existent? Int. J. Energy Econ. Policy. 10, 635-644.

[56]
Omri, A., Ben, N., Sassi-tmar, A., 2015. Modeling the causal linkages between nuclear energy, renewable energy and economic growth in developed and developing countries. Renew. Sust. Energ. Rev. 42, 1012-1022.

[57]
Pesaran, M.M., Shin, Y., 1997. An autoregressive distributed lag modelling approach to cointegration analysis. In: Strom, S., (ed.). Econometrics and Economic Theory in 20th Century: The Ragnar Frisch Centennial Symposium. Cambridge: Cambridge University Press, 371-413.

[58]
Pesaran, M.H., Shin, Y., Smith, R.J., 2001. Bounds testing approaches to the analysis of level relationships. J. Appl. Econom. 16(3), 289-326.

[59]
REN21 (Renewable Energy Policy Network for the 21st Century), 2023. Renewables 2023 Global Status Report: Global Overview. [2024-08-12]. https://www.ren21.net/gsr-2023/modules/global_overview/

[60]
Saheb-koussa, D., Haddadi, M., Belhamel, M., 2009. Economic and technical study of a hybrid system (wind-photovoltaic-diesel) for rural electrification in Algeria. Appl. Energy. 86(7-8), 1024-1030.

[61]
Shakouri, B., Khoshnevis Yzdi, S., 2017. Causality between renewable energy, energy consumption, and economic growth. Energy Sources, Part B Econ. Plan. Policy. 12, 838-845.

[62]
Šimelytė, A., Dudzevičiūtė, G., 2017. Consumption of renewable energy and economic growth. In:5th International Scientific Conference on Contemporary Issues in Business, Management and Education. Vilnius, Lithuania, 11-12.

[63]
Slusarczyk, B., Zegle, P., Kluczek, A., et al., 2022. The impact of renewable energy sources on the economic growth of Poland and Sweden considering COVID-19 times. Energies. 15(1), 332, doi: 10.3390/en15010332.

[64]
Smolovic, J.C., Muhadinovi, M., Radonji, M., et al., 2020. How does renewable energy consumption affect economic growth in the traditional and new member states of the European Union? Energy Rep. 6(6), 505-513.

[65]
Statista, Inc., 2023. 20 Countries with the Biggest Inequality in Income Distribution Worldwide in 2023, Based on the Gini Index. [2024-08-09]. https://www.statista.com/statistics/264627/ranking-of-the-20-countries-with-the-biggest-inequality-in-income-distribution/

[66]
Statista Inc., 2024a. Netherlands—Statistics and Facts. [2024-08-09]. https://www.statista.com/topics/2697/the-netherlands/

[67]
Statista Inc., 2024b. South Africa—Statistics and Facts. [2024-08-09]. https://www.statista.com/topics/3921/south-africa/

[68]
Statista Inc., 2025a. African Countries with the Highest Gross Domestic Product (GDP) in 2024. [2025-02-21]. https://www.statista.com/statistics/1120999/gdp-of-african-countries-by-country/#:-:text=South%20Africa's%20GDP%20was%20estimated,a%20high%20GDP%20per%20capita

[69]
Statista Inc., 2025b. Netherlands:Distribution of Gross Domestic Product (GDP) across Economic Sectors from 2013 to 2023. [2025-02-21]. https://www.statista.com/statistics/276713/distribution-of-gross-domestic-product-gdp-across-economic-sectors-in-the-netherlands/

[70]
Statista Inc., 2025c. South Africa:Distribution of Gross Domestic Product (GDP) Across Economic Sectors from 2013 to 2023. [2025-02-21] https://www.statista.com/statistics/371233/south-africa-gdp-distribution-across-economic-sectors/#:-:text=In%202023%2C%20agriculture%20had%20contributed,the%20total%20value%20added%2C%20respectively

[71]
Statistics Netherlands, 2024. Nearly Half the Electricity Produced in the Netherlands is Now Renewable. [2024-08-05]. https://www.cbs.nl/en-gb/news/2024/10/nearly-half-the-electricity-produced-in-the-netherlands-is-now-renewable

[72]
StatLine, 2024. Agriculture; Income and Labour Volume Structure, National Accounts. Statistical Netherlands. [2024-08-20]. https://opendata.cbs.nl/statline/#/CBS/nl/dataset/85933NED/table?ts=1741539162927

[73]
Sutherland, L.A., Peter, S., Zagata, L., 2015. Conceptualising multi-regime interactions: The role of the agriculture sector in renewable energy transitions. Res. Policy. 44(8), 1543-1554.

[74]
Szabo, S., Bodis, K., Huld, T., et al., 2011. Energy solutions in rural Africa: Mapping electrification costs of distributed solar and diesel generation versus grid extension. Environ. Res. Lett. 6(3), 034002, doi: 10.1088/1748-9326/6/3/034002.

[75]
Taliotis, C., Bazilian, M., Welsch, M., et al., 2014. Grand Inga to power Africa: Hydropower development scenarios to 2035. Energy Strateg. Rev. 4, 1-10.

[76]
Tan, D.J., Alvarado, F.F., Alvarado, F., et al., 2022. The effects of environmental degradation on agriculture: Evidence from European countries. Gondwana Res. 106, 92-104.

[77]
The European Parliament, 2009. Directive 2009/28/EC of the European Parliament and of the Council. [2024-08-05]. https://eur-lex.europa.eu/eli/dir/2009/28/oj/eng

[78]
Tugcu, T.C., Tiwari, K.A., 2016. Does renewable and/or non-renewable energy consumption matter for total factor productivity (TFP) growth? Evidence from the BRICS. Renew. Sust. Energ. Rev. 65, 610-616.

[79]
Uche, E., Ngepah, N., 2024. How green-technology, energy-transition and resource rents influence load capacity factor in South Africa. Int. J. Sustain. Energy. 43, 1-19.

[80]
UN (United Nations), 2015a. SDG 7: Ensure Access to Affordable, Reliable, Sustainable and Modern Energy for All: Targets and Indicators. [2024-08-08]. https://sdgs.un.org/goals/goal7

[81]
UN, 2015b. Sustainable Development Goal (SDG) 12: Ensure Sustainable Consumption and Production Patterns. [2024-08-08]. https://sdgs.un.org/goals/goal12#targets_and_indicators

[82]
UN, 2023. The Sustainable Development Goals Extended Report 2023. [2024-08-05]. https://sdgs.un.org/sites/default/files/2023-07/The-Sustainable-Development-Goals-Report-2023_0.pdf

[83]
Wageningen Economic Research, 2023. State of Agriculture, Nature and Food: Agricultural Businesses Increasingly Finding Additional Sources of Income. [2024-08-13]. https://www.wur.nl/en/research-results/research-institutes/social-economic-research/show-ser/state-of-agriculture-nature-and-food-agricultural-businesses-increasingly-finding-additional-sources-of-income.htm

[84]
Western Cape Government, 2018. Solar Energy in Agriculture. [2024-08-13]. https://www.westerncape.gov.za/110green/projects/green-agriportal-agriculture-launched

[85]
WITS (World Integrated Trade Solution), 2024. Trade Stats-Country at a Glance. [2024-08-05]. https://wits.worldbank.org/datadownload.aspx?lang=en

[86]
World Bank, 2024. World Development Indicators. [2024-08-05]. ttps://databank.worldbank.org/source/world-development-indicators

[87]
Zhang, X.L., Wang, X.L., Si, D.W., et al., 2024. Natural resources, food, energy and water: Structural shocks, food production and clean energy for USA in the view of COP27. Land Degrad. Dev. 35(7), 2602-2613.

Outlines

/