
Distribution characteristics and sources of heavy metals in soil around Wucaiwan mining area in Zhundong
Received date: 2024-12-10
Revised date: 2025-02-09
Online published: 2026-03-12
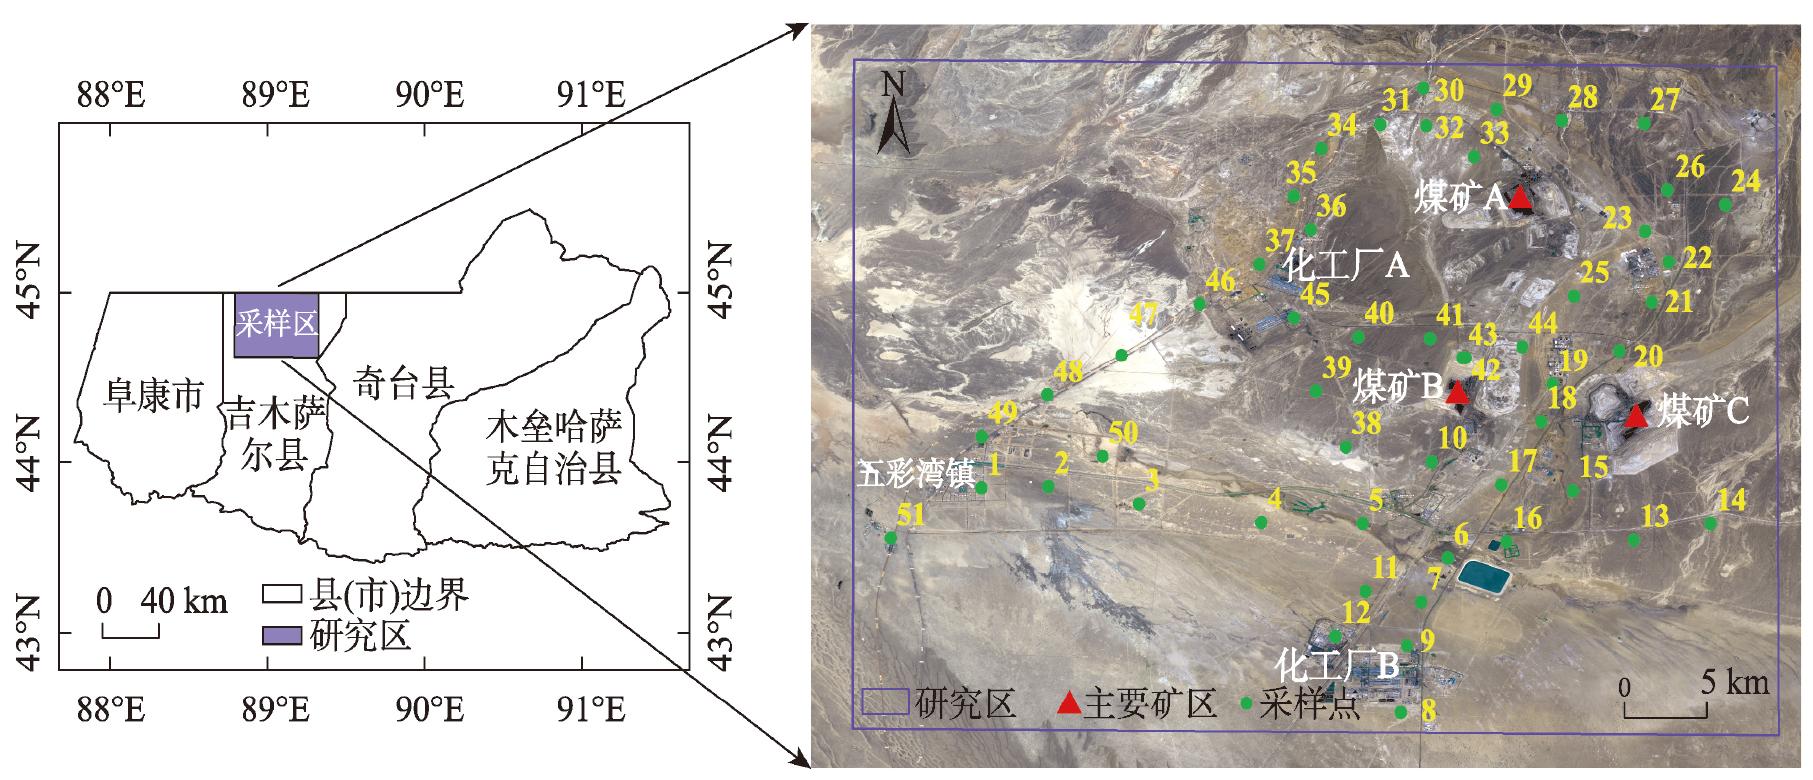
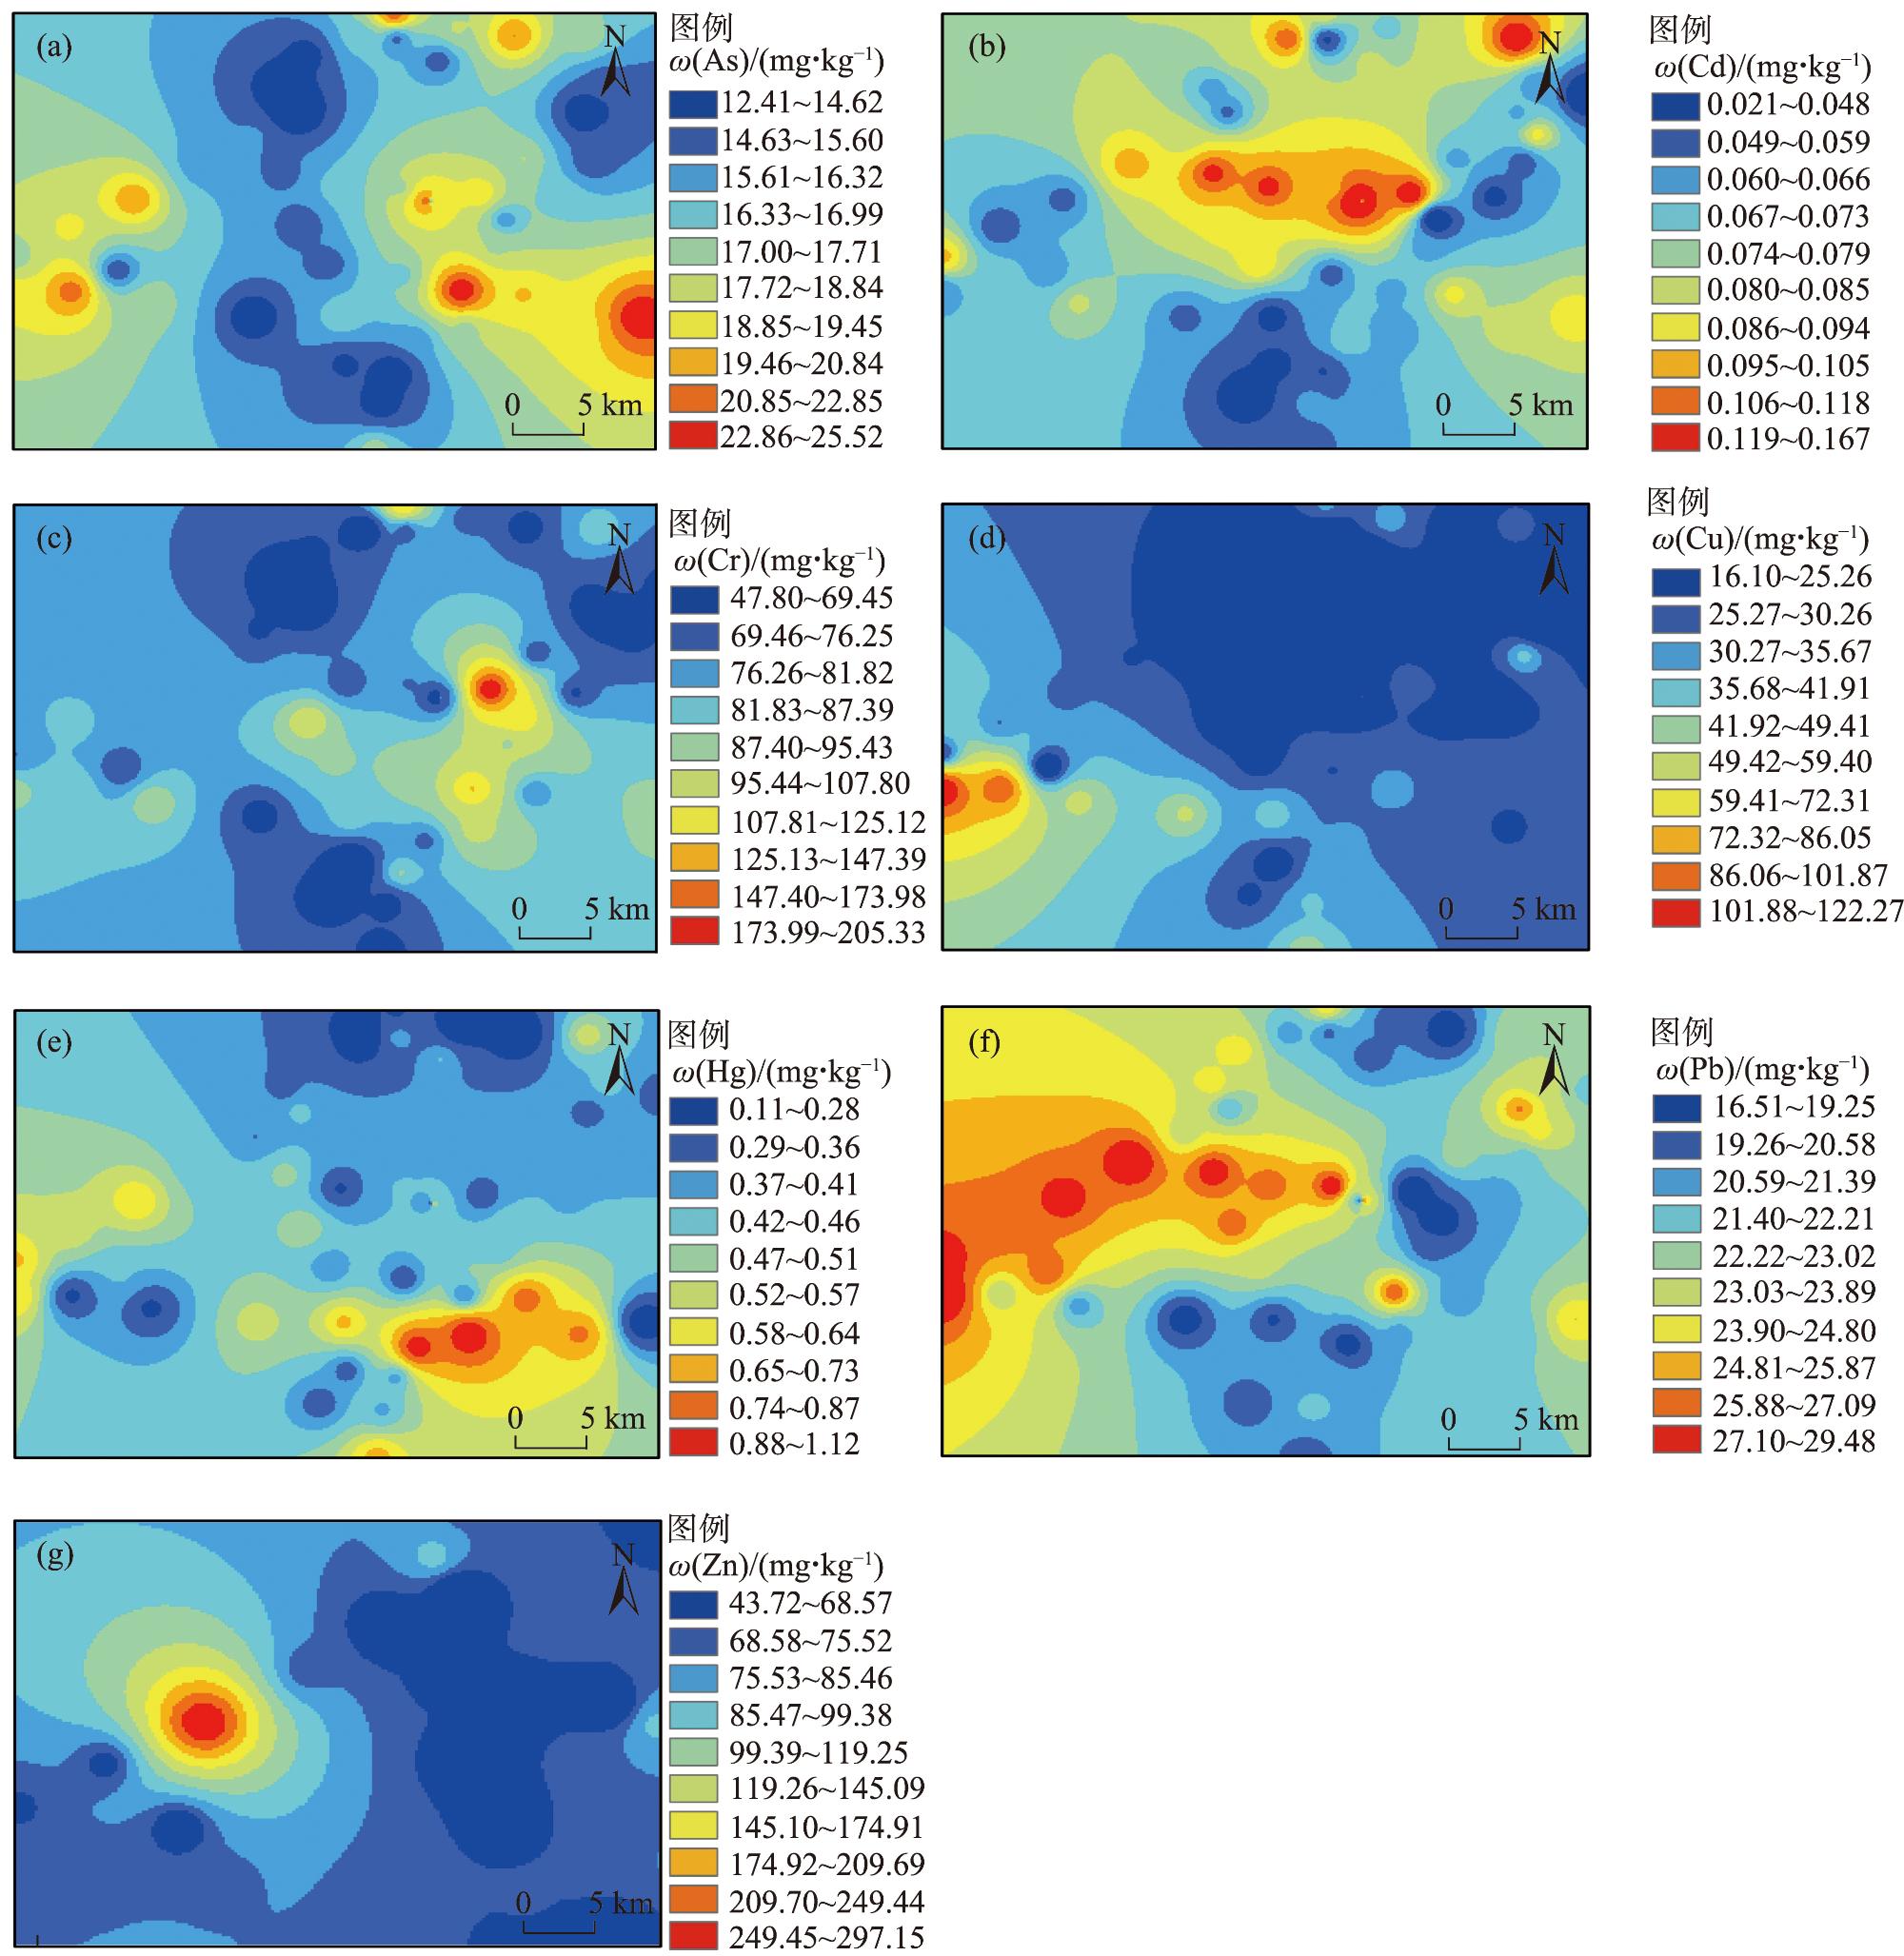
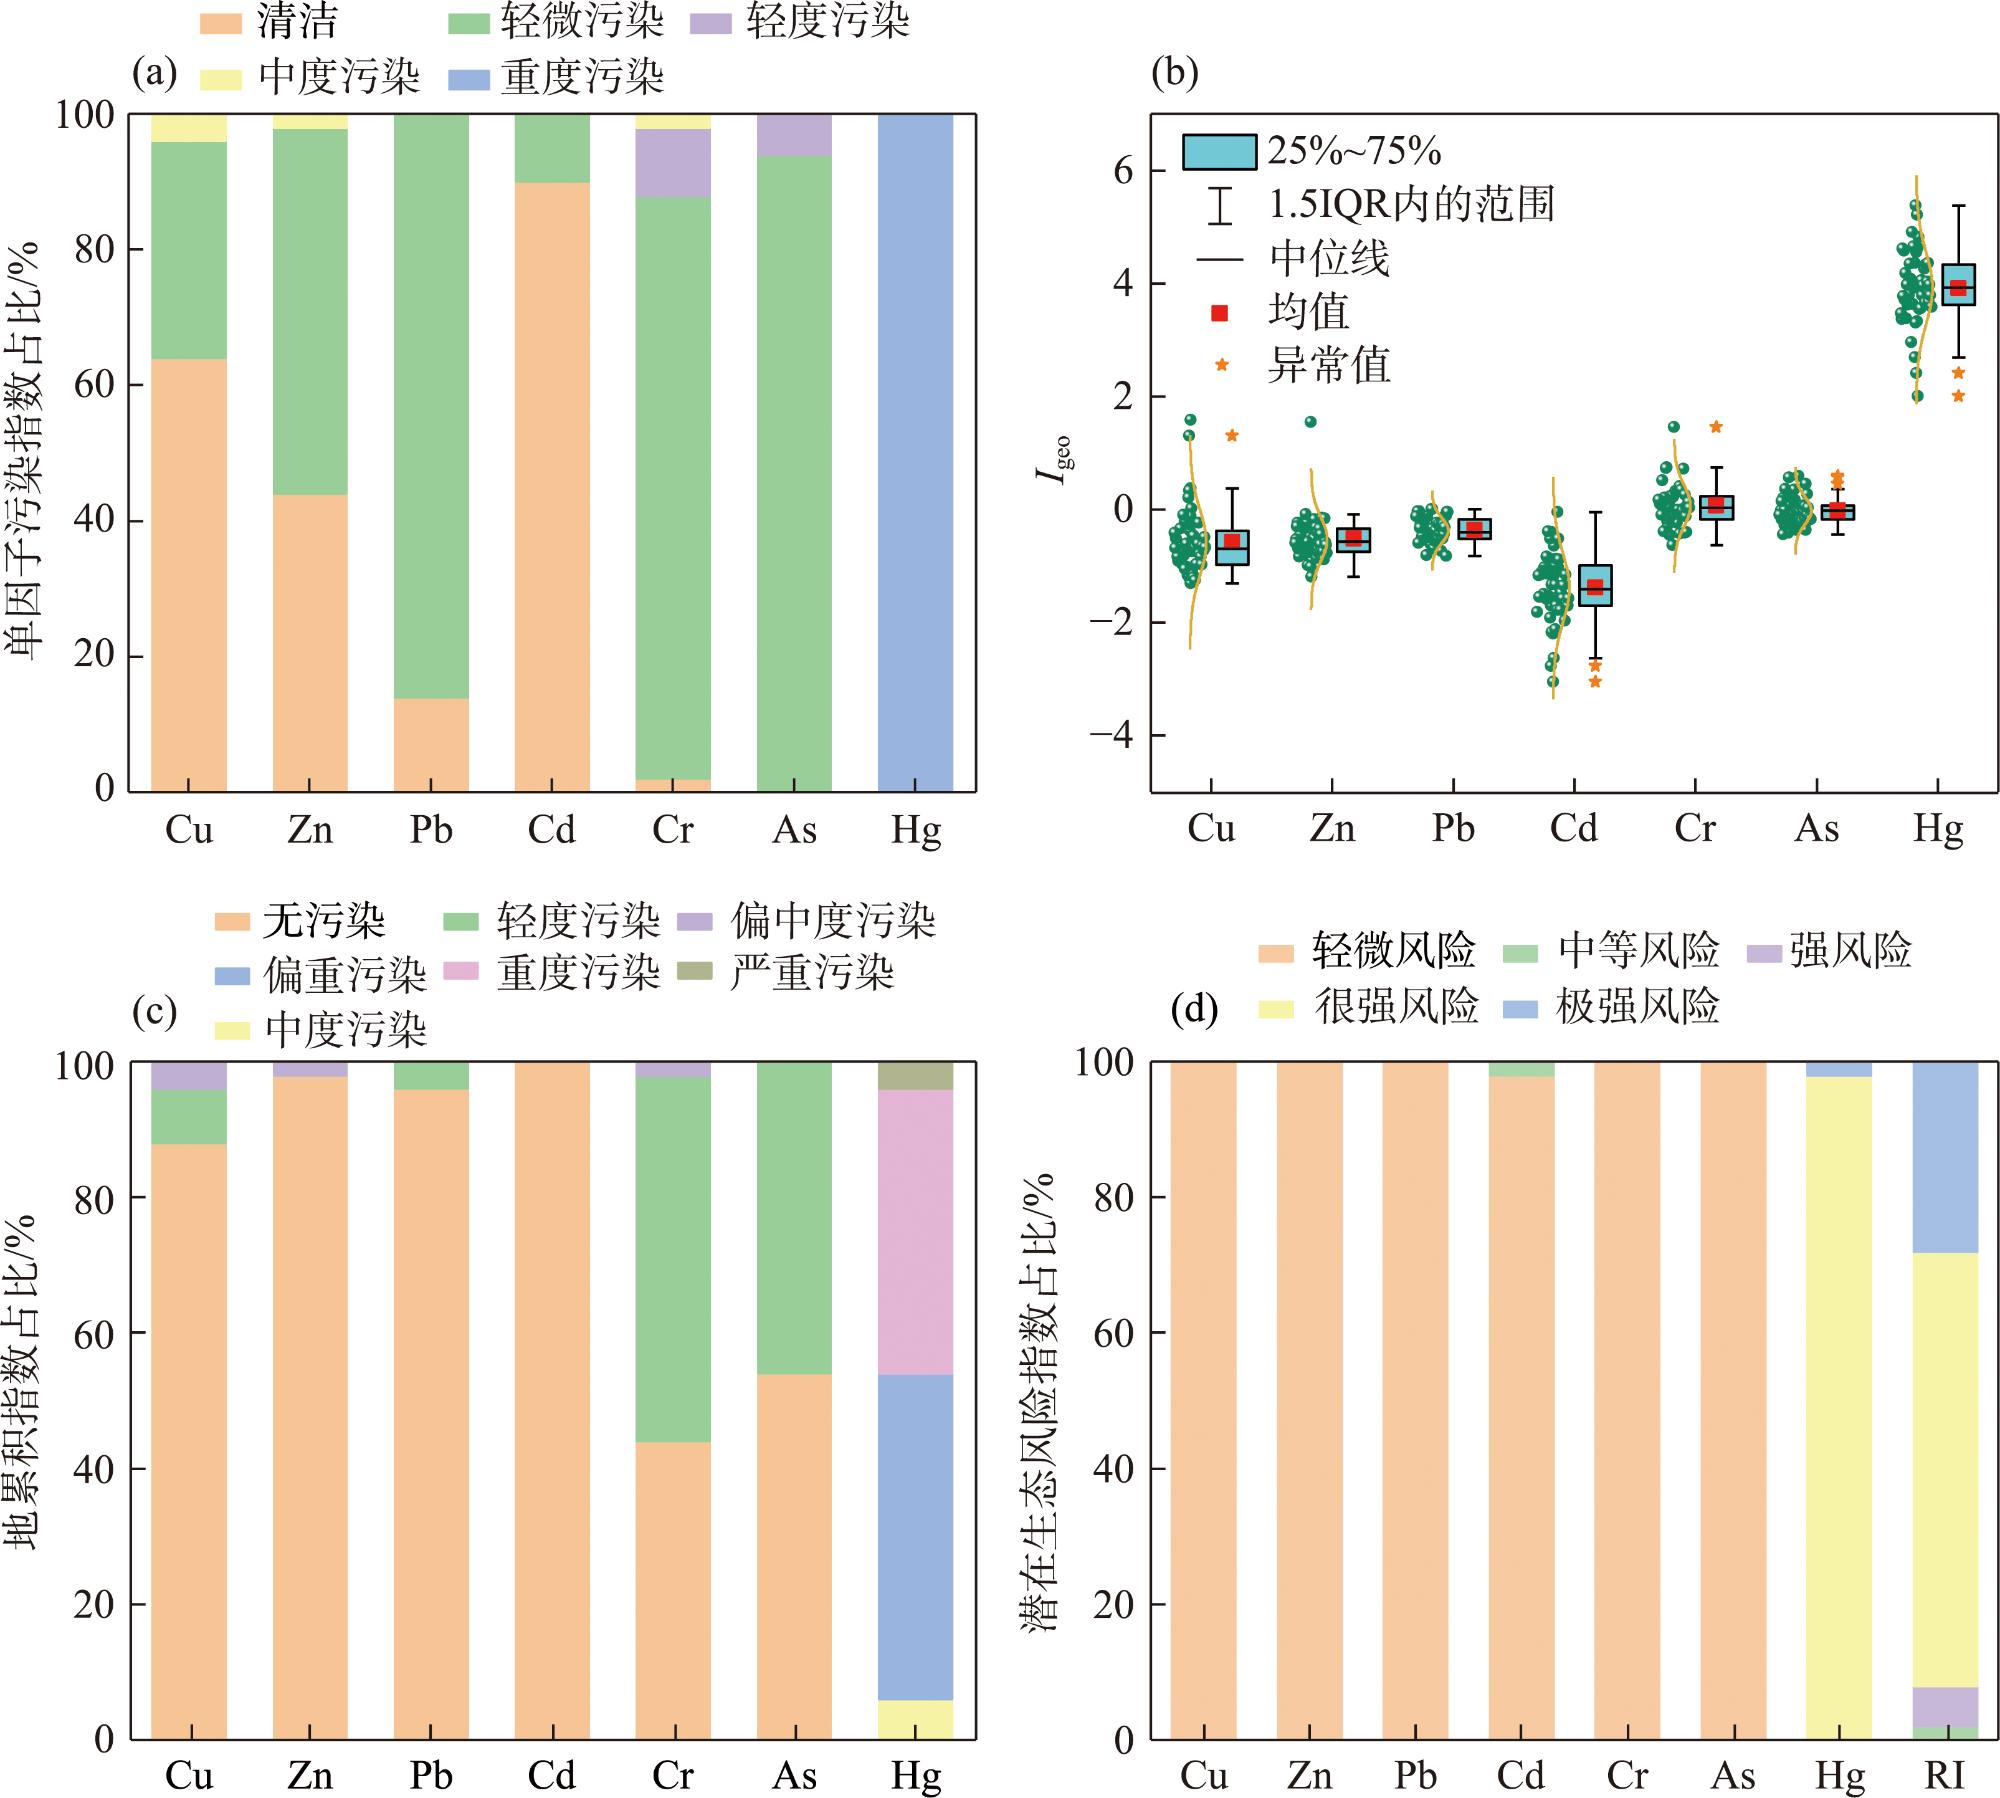
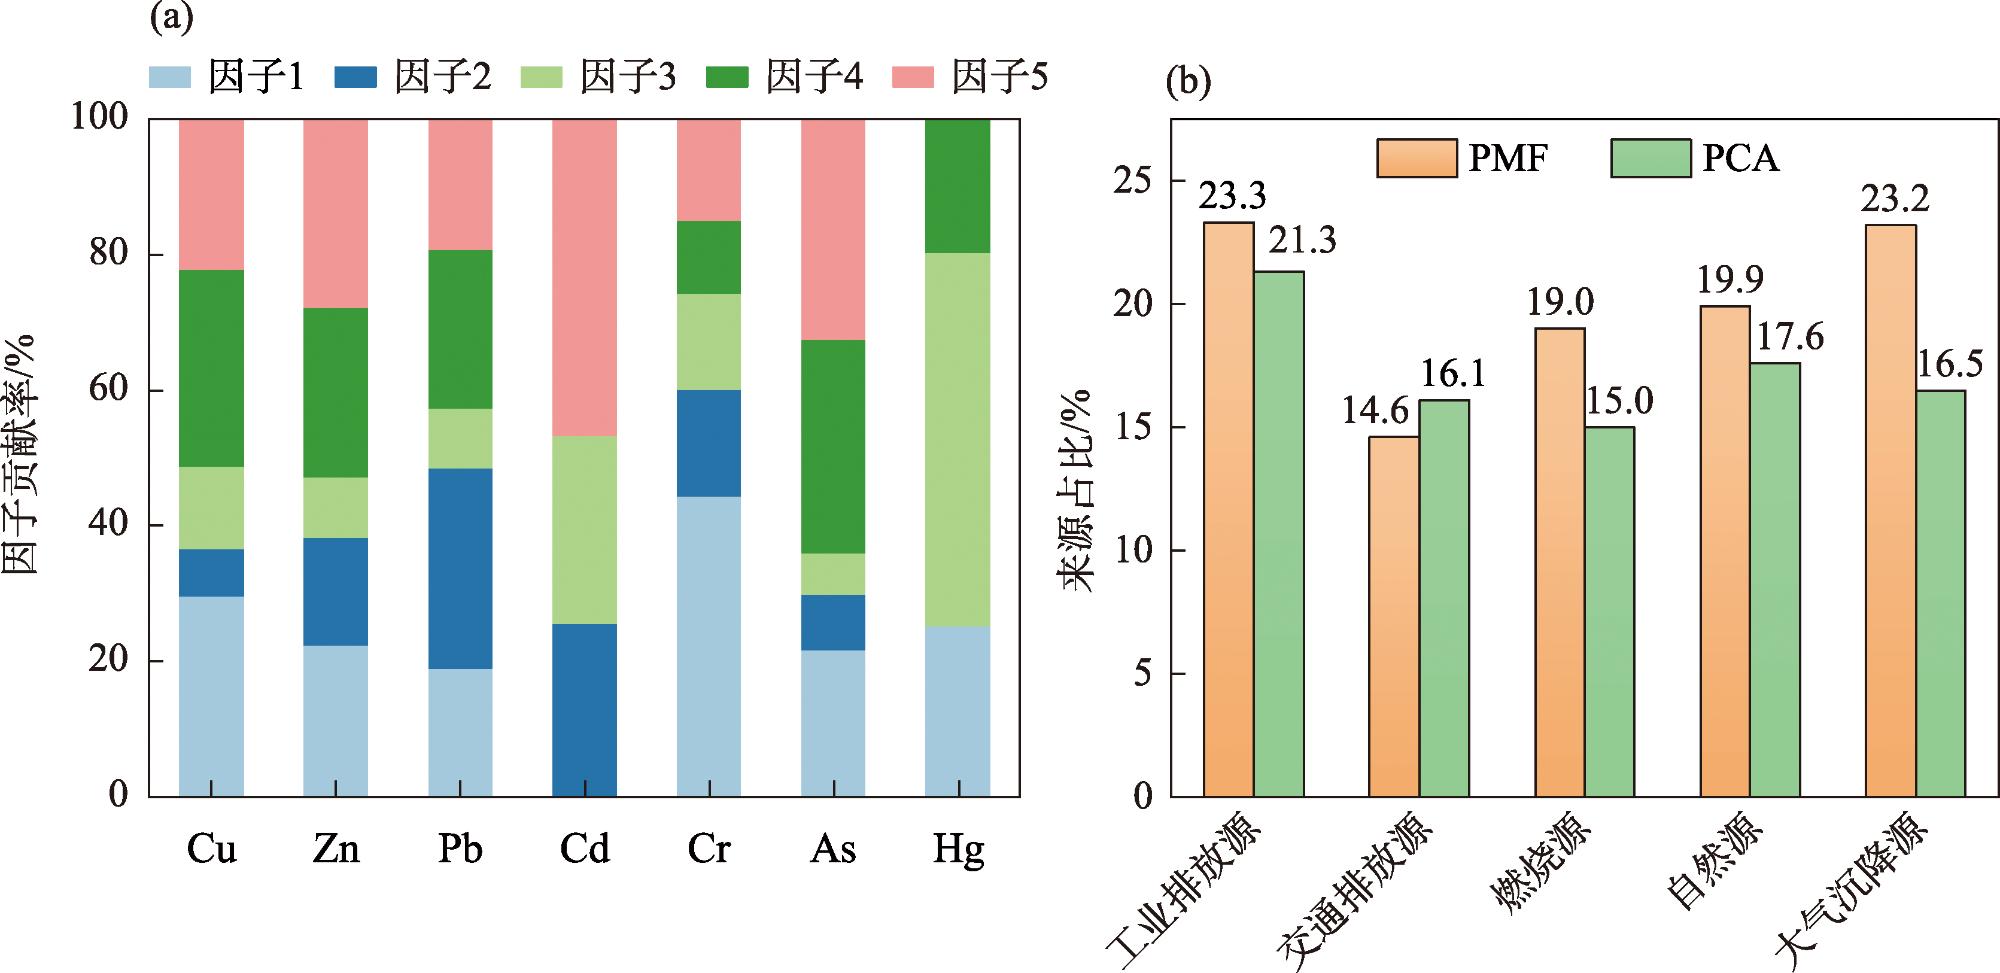
This study focuses on the surface soils around the Wucaiwan mining Area in Zhundong, Xinjiang, Chian. By integrating multiple methods, including Kriging interpolation, the Nemerow comprehensive pollution index method, the potential ecological risk index method, and the Positive Matrix Factorization model, the spatial distribution, pollution levels, ecological risks, and sources of seven heavy metals (Hg, Cr, As, Pb, Cu, Zn, and Cd) in the study area were systematically analyzed. The results indicate that the pollution levels of the heavy metals, in descending order, are Hg>Cr>As>Pb>Cu>Zn>Cd. Notably, 100% of the sampling points for Hg, As, 98% for Cr, and 86% for Pb exceed the regional soil background values of Xinjiang, highlighting significant potential pollution risks. Source apportionment reveals that the primary sources of heavy metals in the surface soil of the study area are industrial emissions (23.3%), traffic emissions (14.6%), combustion sources (19.0%), natural sources (19.9%), and atmospheric deposition (23.2%). These findings provide a robust scientific basis and significant guidance for the remediation and management of heavy metal-contaminated soils in coal mining areas of Xinjiang.
YANG Yanyan , CHEN Xing , WANG Ze , KE Yihao , LI Qinglin , HAO Xiangxue , WANG Ruoxin , SUN Can . Distribution characteristics and sources of heavy metals in soil around Wucaiwan mining area in Zhundong[J]. Arid Zone Research, 2025 , 42(5) : 944 -956 . DOI: 10.13866/j.azr.2025.05.16
表1 土壤重金属污染水平和生态风险评价等级Tab. 1 Soil heavy metal pollution levels and ecological risk assessment grades |
| 单因子指数 | 内梅罗综合污染指数 | 地累积指数 | 潜在生态风险指数 | ||||||||
|---|---|---|---|---|---|---|---|---|---|---|---|
| Pi | 污染水平 | PN | 污染水平 | Igeo | 污染程度 | | RI | 风险等级 | |||
| Pi<1 | 清洁 | PN≤0.7 | 安全 | Igeo≤0 | 无污染 | | RI<150 | 轻微风险 | |||
| 1≤Pi<2 | 轻微污染 | 0.7<PN≤1 | 警戒 | 0<Igeo≤1 | 轻度污染 | 40≤ | 150≤RI<300 | 中等风险 | |||
| 2≤Pi<3 | 轻度污染 | 1<PN≤2 | 轻污染 | 1<Igeo≤2 | 偏中度污染 | 80≤ | 300≤RI<600 | 强风险 | |||
| 3≤Pi<5 | 中度污染 | 2<PN≤3 | 中污染 | 2<Igeo≤3 | 中度污染 | 160≤ | 600≤RI<1200 | 很强风险 | |||
| Pi≥5 | 重污染 | PN>3 | 重污染 | 3<Igeo≤4 | 偏重污染 | | RI≥1200 | 极强风险 | |||
| 4<Igeo≤5 | 重度污染 | ||||||||||
| Igeo>5 | 严重污染 | ||||||||||
表2 土壤重金属含量描述性统计Tab. 2 Descriptive statistics of soil heavy metal content |
| 元素 | 土壤重金属浓度ω/(mg·kg-1) | 标准偏差 | Cv/% | 背景值 超标率/% | 筛选值 超标率/% | |||||
|---|---|---|---|---|---|---|---|---|---|---|
| 最小值 | 最大值 | 平均值 | 中值 | 背景值 | 筛选值 | |||||
| Cu | 16.10 | 122.27 | 29.73 | 24.65 | 26.70 | 100 | 18.96 | 63.75 | 36 | 2 |
| Zn | 43.72 | 297.26 | 73.37 | 67.73 | 66.80 | 300 | 34.35 | 46.81 | 54 | 0 |
| Pb | 16.49 | 29.49 | 22.86 | 22.16 | 19.40 | 170 | 3.50 | 15.32 | 86 | 0 |
| Cd | 0.02 | 0.18 | 0.08 | 0.07 | 0.12 | 0.6 | 0.03 | 41.36 | 10 | 0 |
| Cr | 47.68 | 205.94 | 80.77 | 75.96 | 49.30 | 250 | 25.14 | 31.12 | 98 | 0 |
| As | 12.40 | 25.53 | 16.93 | 16.60 | 11.20 | 25 | 3.00 | 17.69 | 100 | 4 |
| Hg | 0.11 | 1.12 | 0.44 | 0.40 | 0.017 | 3.4 | 0.20 | 44.52 | 100 | 0 |
注:筛选值参考《土壤环境质量 农用地土壤污染风险管控标准(试行)》(GB 15618—2018)中农用地土壤污染风险筛选值,选取pH>7.5,土地类型为其他。 |
表3 土壤重金属的单因子污染指数(Pi)和内梅罗综合污染指数(PN)Tab. 3 Single factor pollution index (Pi) and Nemerow comprehensive pollution index (PN) of heavy metals in soil |
| 元素 | 最小值 | 最大值 | 均值 | 方差 | 标准差 | Cv/% | 峰度 | 偏度 | |
|---|---|---|---|---|---|---|---|---|---|
| Pi | Cu | 0.60 | 4.58 | 1.11 | 0.50 | 0.71 | 63.79 | 14.57 | 3.60 |
| Zn | 0.65 | 4.45 | 1.10 | 0.27 | 0.51 | 46.81 | 38.44 | 5.84 | |
| Pb | 0.85 | 1.52 | 1.18 | 0.03 | 0.18 | 15.28 | -0.86 | 0.26 | |
| Cd | 0.18 | 1.46 | 0.62 | 0.06 | 0.26 | 41.45 | 1.40 | 0.97 | |
| Cr | 0.97 | 4.18 | 1.64 | 0.26 | 0.51 | 31.12 | 11.98 | 2.78 | |
| As | 1.11 | 2.28 | 1.51 | 0.07 | 0.27 | 17.67 | 1.15 | 1.06 | |
| Hg | 6.17 | 65.72 | 25.83 | 132.30 | 11.50 | 44.52 | 2.76 | 1.36 | |
| PN | 4.55 | 47.06 | 18.57 | 67.41 | 8.21 | 44.21 | 2.76 | 1.36 | |
表4 土壤重金属潜在生态风险指数( |
| 元素 | 最小值 | 最大值 | 均值 | 方差 | 标准差 | Cv/% | 峰度 | 偏度 |
|---|---|---|---|---|---|---|---|---|
| Cu | 3.02 | 22.90 | 5.57 | 12.60 | 3.55 | 63.76 | 14.59 | 3.60 |
| Zn | 0.65 | 4.45 | 1.10 | 0.26 | 0.51 | 46.81 | 38.50 | 5.85 |
| Pb | 4.25 | 7.60 | 5.89 | 0.82 | 0.90 | 15.32 | -0.84 | 0.26 |
| Cd | 5.00 | 45.00 | 18.55 | 62.27 | 7.89 | 42.54 | 1.68 | 1.11 |
| Cr | 1.93 | 8.36 | 3.28 | 1.04 | 1.02 | 31.12 | 11.89 | 2.79 |
| As | 11.07 | 22.79 | 15.11 | 7.15 | 2.67 | 17.69 | 1.13 | 1.05 |
| Hg | 235.29 | 2635.29 | 1032.94 | 211064.19 | 459.42 | 44.48 | 2.82 | 1.36 |
| RI | 290.73 | 2681.96 | 1082.44 | 210545.59 | 458.85 | 42.39 | 2.81 | 1.37 |
表5 研究区重金属元素主成分旋转载荷Tab. 5 Rotational loads of principal components of heavy metals in the study area |
| 元素 | PC1 | PC2 | PC3 | PC4 | PC5 |
|---|---|---|---|---|---|
| Cu | 0.39 | 0.79 | -0.17 | 0.08 | 0.19 |
| Zn | 0.15 | 0.01 | 0.91 | 0.17 | -0.01 |
| Pb | 0.32 | -0.77 | -0.22 | 0.28 | 0.11 |
| Cd | -0.05 | -0.12 | 0.19 | 0.93 | -0.07 |
| Cr | 0.89 | -0.01 | 0.09 | -0.15 | 0.10 |
| As | 0.64 | 0.10 | 0.46 | 0.36 | -0.12 |
| Hg | 0.05 | 0.05 | -0.03 | -0.07 | 0.99 |
| 特征值 | 1.49 | 1.23 | 1.16 | 1.13 | 1.05 |
| 方差贡献率/% | 21.30 | 17.63 | 16.51 | 16.07 | 14.95 |
| 累计方差贡献率/% | 21.30 | 38.93 | 55.44 | 71.51 | 86.46 |
注:表中加粗数据为对某种主成分贡献较大的重金属元素。 |
| [1] |
李军, 吴小飞, 乔中鹏. 国内外煤炭经济形势分析[J]. 国际商务财会, 2024(21): 22-27.
[
|
| [2] |
|
| [3] |
|
| [4] |
|
| [5] |
|
| [6] |
李瑞明, 周梓欣, 张伟, 等. “十四五”以来新疆煤炭地质工作进展及发展方向[J]. 新疆地质, 2024, 42(1): 7-13.
[
|
| [7] |
|
| [8] |
袁婷婷, 王志强, 汪溪远, 等. 准东红沙泉矿区重金属生态风险缓冲区分析[J]. 土壤通报, 2020, 51(1): 227-233.
[
|
| [9] |
许紫峻, 汪溪远, 师庆东, 等. 准东煤矿区土壤镉污染风险评价及敏感性分析[J]. 生态毒理学报, 2018, 13(2): 159-170.
[
|
| [10] |
李晓航, 张飞, 夏楠, 等. 新疆准东煤矿土壤重金属污染方法评价与分析[J]. 中国矿业, 2016, 25(10): 74-80.
[
|
| [11] |
刘巍, 杨建军, 汪君, 等. 准东煤田露天矿区土壤重金属污染现状评价及来源分析[J]. 环境科学, 2016, 37(5): 1938-1945.
[
|
| [12] |
比拉力·依明, 阿不都艾尼·阿不里, 师庆东, 等. 基于PMF模型的准东煤矿周围土壤重金属污染及来源解析[J]. 农业工程学报, 2019, 35(9): 185-192.
[
|
| [13] |
叶盼青, 阿不都艾尼·阿不里, 孙小丽, 等. 天山北坡经济带土壤重金属来源及污染评价[J]. 中国环境科学, 2022, 42(10): 4704-4712.
[
|
| [14] |
于昊辰. 新疆荒漠矿区土地生态系统退化评价及调控策略研究[D]. 徐州: 中国矿业大学, 2022.
[
|
| [15] |
张少彬, 冯钟钟. 重铬酸钾容量法测定广东省部分地区土壤中有机质含量的研究[J]. 广东化工, 2023, 50(4): 189-191, 213.
[
|
| [16] |
中国环境监测总站. 中国土壤元素背景值[M]. 北京: 中国环境科学出版社, 1990.
[China National Environmental Monitoring Centre. Background Value of Soil Elements in China[M]. Beijing: China Environmental Science Press, 1990.]
|
| [17] |
贾晗, 刘军省, 王晓光, 等. 安徽典型硫铁矿集中开采区土壤重金属污染特征及来源解析[J]. 环境科学, 2023, 44(9): 5275-5287.
[
|
| [18] |
|
| [19] |
|
| [20] |
|
| [21] |
王海洋, 韩玲, 谢丹妮, 等. 矿区周边农田土壤重金属分布特征及污染评价[J]. 环境科学, 2022, 43(4): 2104-2114.
[
|
| [22] |
|
| [23] |
|
| [24] |
|
| [25] |
夏子书, 白一茹, 王幼奇, 等. 基于PMF模型的宁南山区小流域土壤重金属空间分布及来源解析[J]. 环境科学, 2022, 43(1): 432-441.
[
|
| [26] |
赵晓光, 张亦扬, 杜华栋. 陕北矿区不同土地类型下土壤重金属污染评价[J]. 环境工程, 2019, 37(9): 188-193.
[
|
| [27] |
张宏泽, 崔文刚, 黄月美, 等. 黔中喀斯特地区临近矿区耕地土壤重金属污染评价及其源解析[J]. 环境科学学报, 2022, 42(4): 412-421.
[
|
| [28] |
王哲, 宓展盛, 郑春丽, 等. 生物炭对矿区土壤重金属有效性及形态的影响[J]. 化工进展, 2019, 38(6): 2977-2985.
[
|
| [29] |
蔡奎, 段亚敏, 栾文楼, 等. 河北平原农田土壤重金属元素Pb、Hg地球化学行为的影响因素[J]. 中国地质, 2016, 43(4): 1420-1428.
[
|
| [30] |
|
| [31] |
廖泽源, 李杰芹, 沈智杰, 等. 重庆某铁矿区周边耕地土壤重金属污染评价及来源解析[J]. 环境科学, 2024, 45(4): 2450-2460.
[
|
| [32] |
逯雨, 李琴, 张越, 等. 磷化工厂及周边农田土壤重金属污染与来源解析[J]. 环境污染与防治, 2022, 44(11): 1514-1518, 1525.
[
|
| [33] |
王乔林, 宋云涛, 王成文, 等. 滇西地区土壤重金属来源解析及空间分布[J]. 中国环境科学, 2021, 41(8): 3693-3703.
[
|
| [34] |
|
| [35] |
张罡, 叶芝祥, 杨怀金, 等. 高速公路大气细颗粒物污染特征研究[J]. 环境科学与技术, 2017, 40(2): 158-162, 167.
[
|
| [36] |
陈其永, 郜允兵, 倪润祥, 等. 2000—2018年我国大气重金属沉降通量时空变化特征[J]. 环境科学, 2022, 43(9): 4413-4424.
[
|
/
| 〈 |
|
〉 |