
Evaluation of water resources carrying capacity and development threshold in provincial capitals and typical cities of Northwest China from 2010 to 2022
Received date: 2025-03-17
Revised date: 2025-04-23
Online published: 2026-03-12
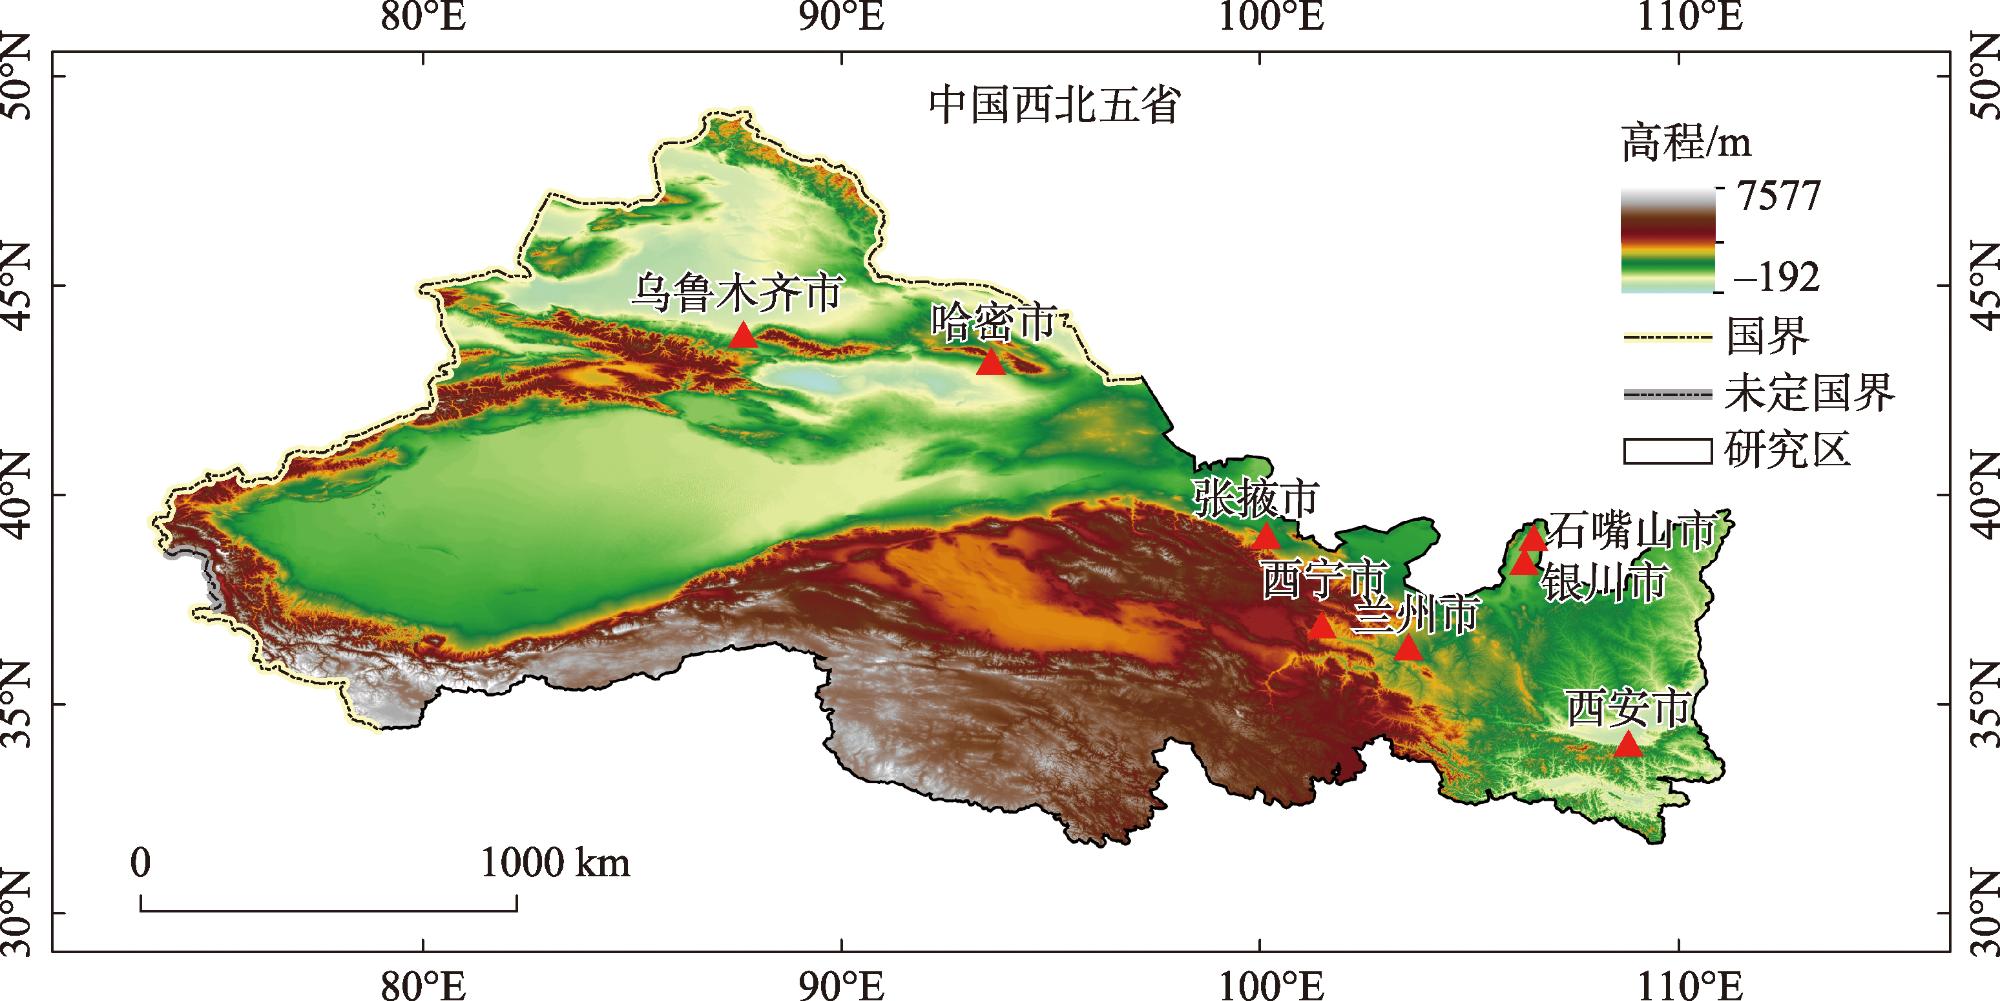
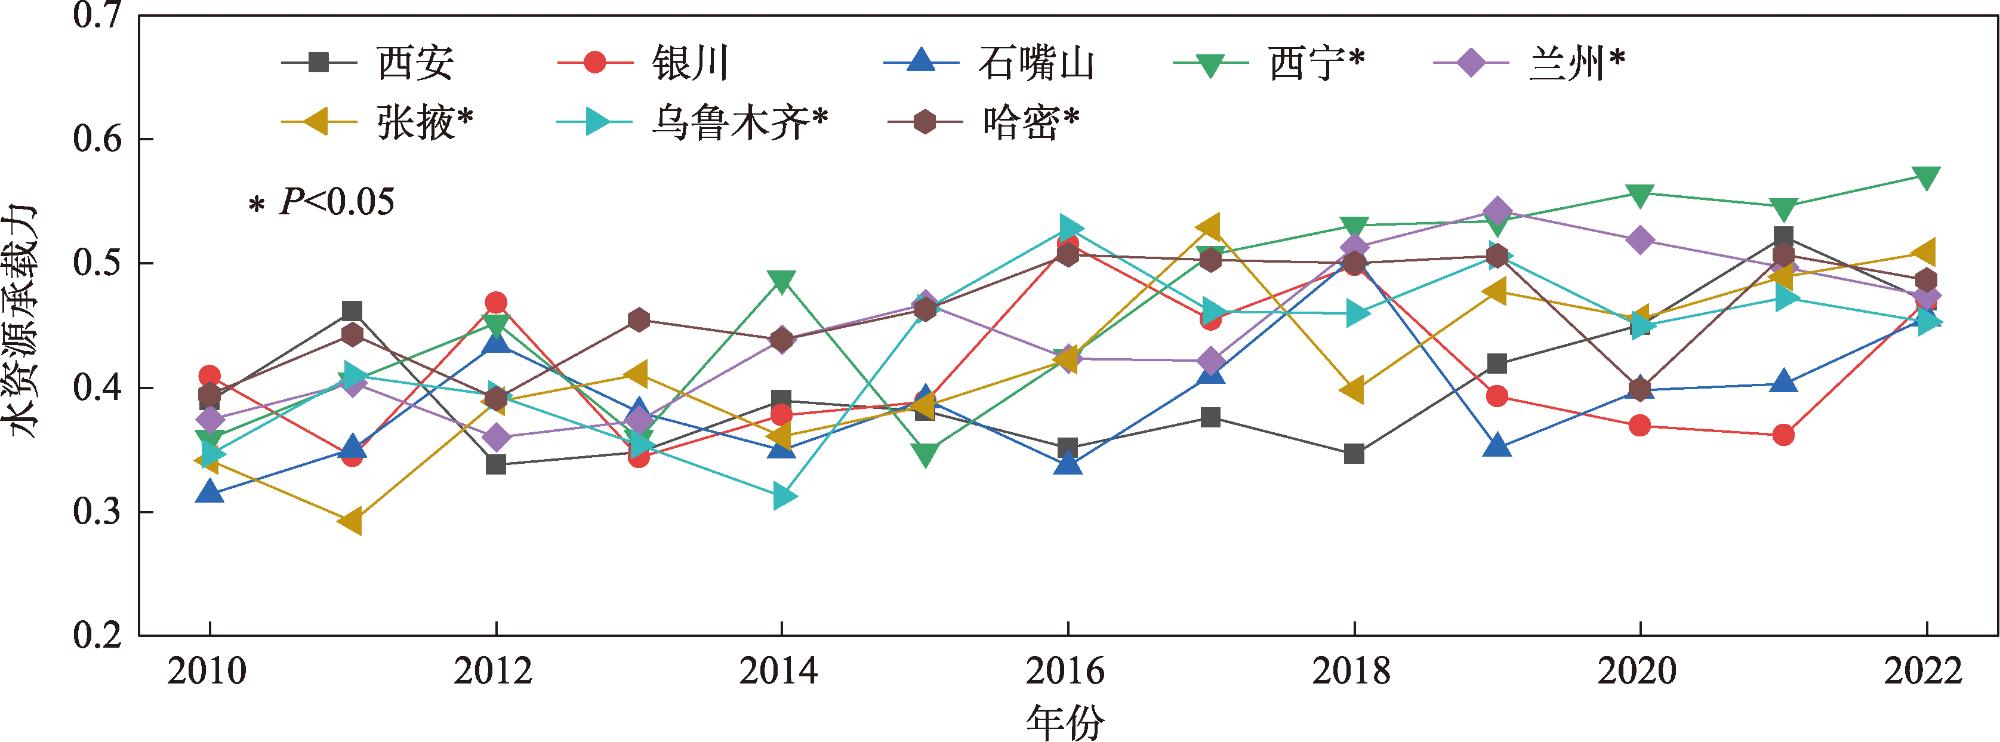
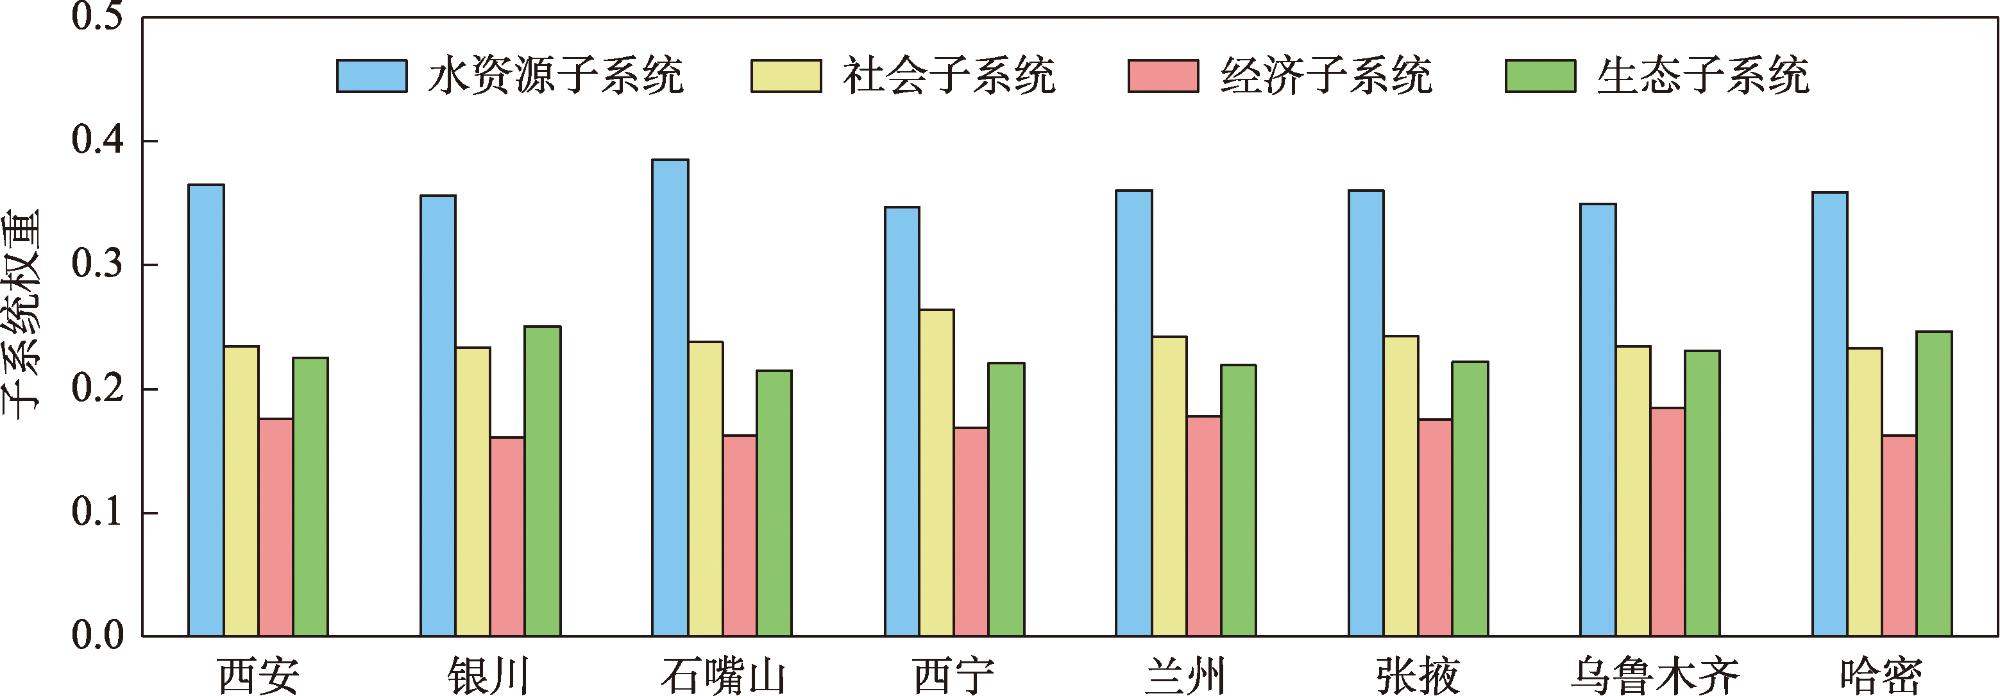
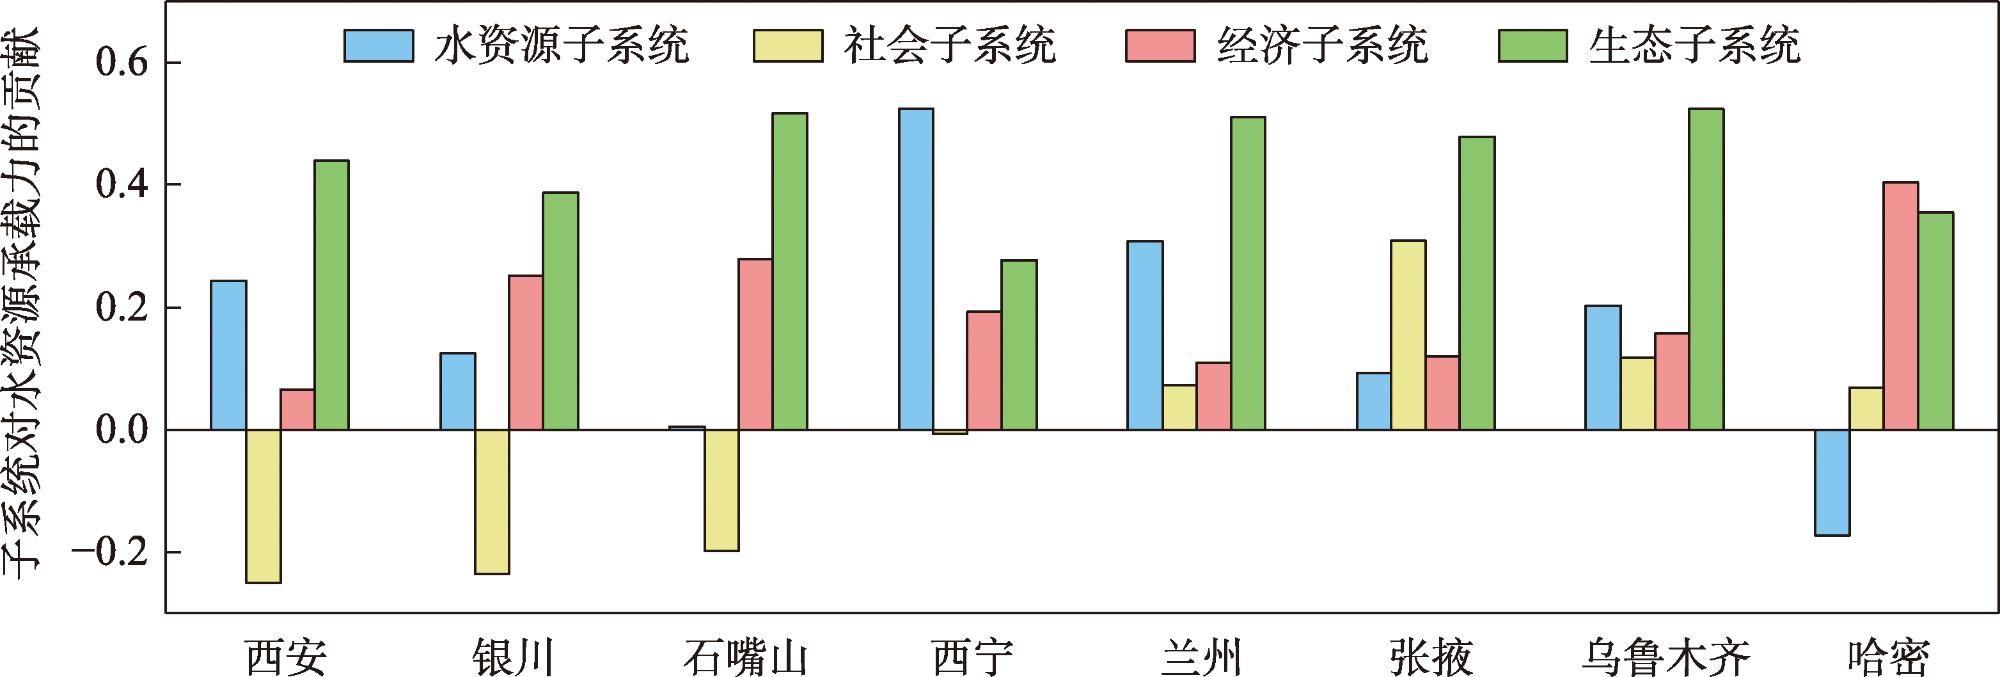
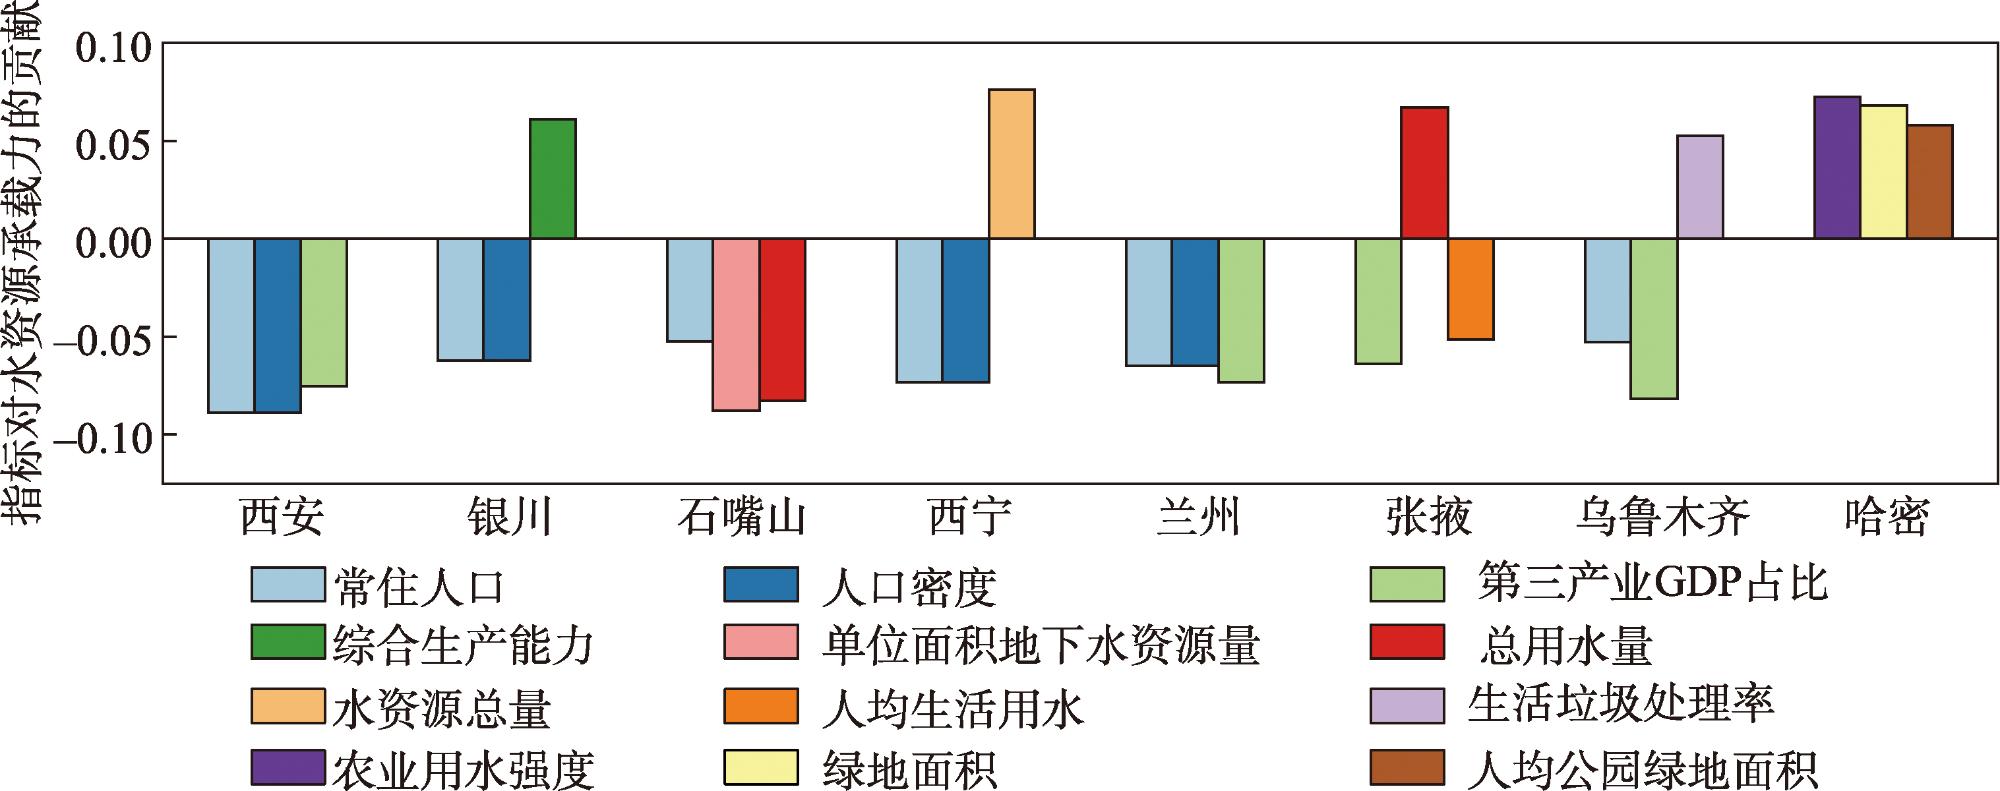
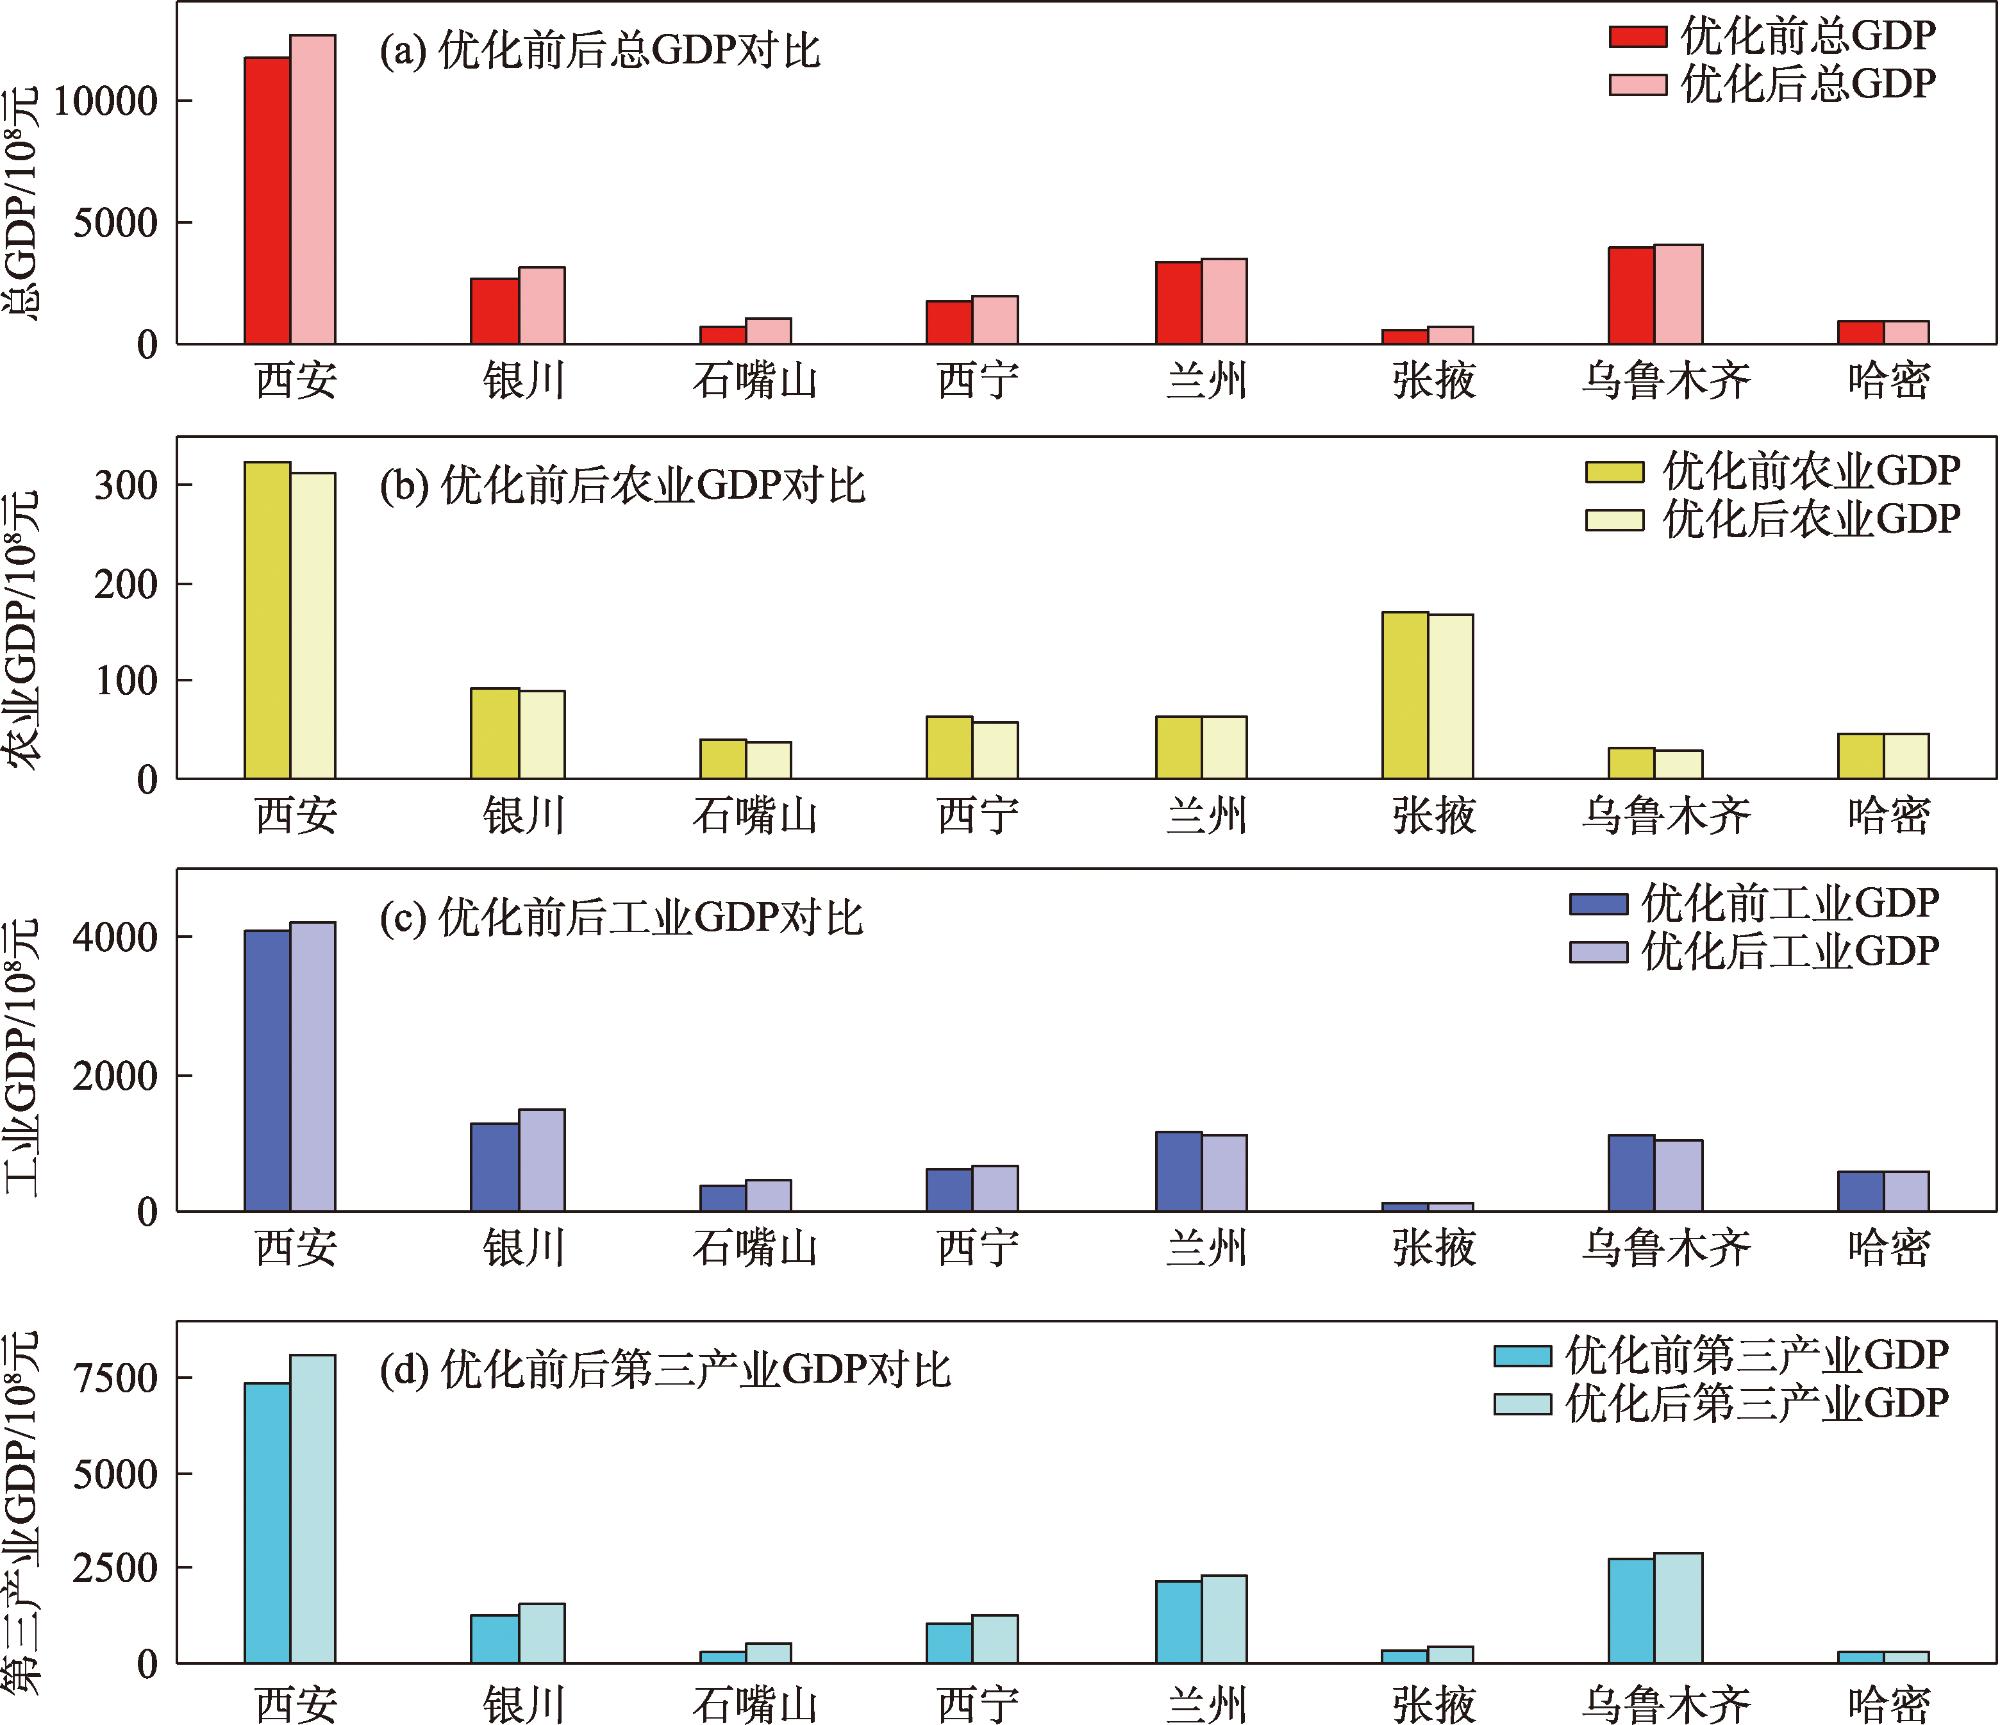
Based on the four dimensions of water resources, society, economy, and ecology, this study constructs an evaluation system for water resources carrying capacity. It uses the improved Technique for Order Preference by Similarity to an Ideal Solution (TOPSIS) model to evaluate the water resources carrying capacity of capital cities and typical cities in Northwest China from 2010 to 2022. The Bayesian optimization algorithm is introduced for the first time to optimize the allocation of water resources, and the threshold of water resources supportable development for each industry is calculated accordingly. The results show that: (1) The average water resources carrying capacity of provincial capitals and typical cities in Northwest China from 2010 to 2022 falls between 0.3 and 0.5, indicating a medium level. With the exception of Shizuishan, Xi’an, and Yinchuan, the water resources carrying capacity of other cities shows a significant upward trend (P<0.05). (2) The water resources dimension has the greatest impact on the water resources carrying capacity, followed by the social and ecological dimensions, while the economic dimension has the least impact. (3) The optimal allocation results based on 2022 data show a decrease in agricultural and ecological water consumption, while industrial and domestic water consumption have significantly increased. The estimated comprehensive benefits and total GDP of each city under the optimal water allocation are better than the current situation. Among them, the optimization effect of Shizuishan City is the most significant, with a 41.49% increase in comprehensive benefit score. This study provides a scientific basis for the sustainable development, utilization, and rational optimal allocation of water resources in capital cities and typical cities in Northwest China.
LIU Lajun , YUAN Xiuliang , JING Changqing , PAN Changxiang . Evaluation of water resources carrying capacity and development threshold in provincial capitals and typical cities of Northwest China from 2010 to 2022[J]. Arid Zone Research, 2025 , 42(5) : 907 -921 . DOI: 10.13866/j.azr.2025.05.13
表1 数据来源与时间范围Tab. 1 Data sources and time range |
| 类别 | 主要指标 | 数据来源 | 时间范围 |
|---|---|---|---|
| 水资源 | 单位面积降水量、水资源总量、单位面积地表水资源量、单位面积地下水资源量、人均水资源量、综合生产能力、产水模数 | 水资源公报、统计年鉴 | 2010—2022年 |
| 社会 | 总用水量、人均生活用水、农业用水强度、工业用水强度、人口密度、自然增长率、常住人口、供水管密度 | 水资源公报、统计年鉴 | 2010—2022年 |
| 经济 | GDP、农业GDP、工业GDP、人均GDP、GDP增长率、第一产业GDP占比、第三产业GDP占比、单位GDP水耗 | 统计年鉴、国民经济和社会发展统计公报 | 2010—2022年 |
| 生态 | 绿地面积、人均公园绿地面积、建成区绿化覆盖率、城市环境用水强度、污水处理率、生活垃圾处理率、SO2排放强度、工业氮氧化物排放强度、工业烟尘排放强度 | 统计年鉴、中国城市建设统计年鉴 | 2010—2022年 |
| 过程指标 | 农业用水量、行政区面积、工业用水量、生活用水量、生态用水量、第三产业GDP、SO2排放量、工业氮氧化物排放量、工业烟尘排放量 | 统计年鉴、水资源公报、中国城市建设统计年鉴 | 2010—2022年 |
| 其他指标 | 生活用水排污系数、工业用水排污系数、再生水利用率、工业用水重复利用率 | 政府网站公告 | 2022年 |
表2 水资源承载力评价指标体系Tab. 2 Evaluation index system of water resources carrying capacity |
| 子系统 | 序号 | 指标 | 单位 | 方向 |
|---|---|---|---|---|
| 水资源子系统 | X1 | 单位面积降水量 | mm | 正向 |
| X2 | 水资源总量 | 104 m3 | 正向 | |
| X3 | 单位面积地表水资源量 | m3·km-2 | 正向 | |
| X4 | 单位面积地下水资源量 | m3·km-2 | 正向 | |
| X5 | 人均水资源量 | m3·人-1 | 正向 | |
| X6 | 综合生产能力 | 104 m3·d-1 | 正向 | |
| X7 | 产水模数 | 104 m3·km-2 | 正向 | |
| 社会子系统 | X8 | 总用水量 | 104 m3 | 负向 |
| X9 | 人均生活用水 | L·d-1 | 负向 | |
| X10 | 农业用水强度 | m3·元-1 | 负向 | |
| X11 | 工业用水强度 | m3·元-1 | 负向 | |
| X12 | 人口密度 | 人·km2 | 负向 | |
| X13 | 自然增长率 | ‰ | 负向 | |
| X14 | 常住人口 | 104人 | 负向 | |
| X15 | 供水管密度 | km·km-2 | 正向 | |
| 经济子系统 | X16 | GDP | 108元 | 正向 |
| X17 | 农业GDP | 108元 | 正向 | |
| X18 | 工业GDP | 108元 | 正向 | |
| X19 | 人均GDP | 元·人-1 | 正向 | |
| X20 | GDP增长率 | % | 负向 | |
| X21 | 第一产业GDP占比 | % | 负向 | |
| X22 | 第三产业GDP占比 | % | 负向 | |
| X23 | 单位GDP水耗 | m3·(104元)-1 | 负向 | |
| 生态子系统 | X24 | 绿地面积 | hm2 | 正向 |
| X25 | 人均公园绿地面积 | m2 | 正向 | |
| X26 | 建成区绿化覆盖率 | % | 正向 | |
| X27 | 城市环境用水强度 | m3·元-1 | 负向 | |
| X28 | 污水处理率 | % | 正向 | |
| X29 | 生活垃圾处理率 | % | 正向 | |
| X30 | SO2排放强度 | t·(108元)-1 | 负向 | |
| X31 | 工业氮氧化物排放强度 | t·(108元)-1 | 负向 | |
| X32 | 工业烟尘排放强度 | t·(108元)-1 | 负向 |
表3 水资源承载力等级划分Tab. 3 Classification of water resources carrying capacity levels |
| 等级 | 接近度 | 评价等级 |
|---|---|---|
| Ⅰ | [0.7~1.0] | 优秀 |
| Ⅱ | [0.5~0.7) | 良好 |
| Ⅲ | [0.3~0.5) | 中等 |
| Ⅳ | [0.2~0.3) | 较差 |
| Ⅴ | [0.0~0.2) | 很差 |
表4 优化结果Tab. 4 Optimization result |
| 城市 | 农业用水/104 m3 | 工业用水/104 m3 | 生活用水/104 m3 | 生态用水/104 m3 | 人口/104人 | 综合得分 |
|---|---|---|---|---|---|---|
| 西安 | 65471.62 | 20763.97 | 91341.63 | 33766.70 | 1307.47 | 126018164.92 |
| 银川 | 146771.28 | 8024.69 | 21802.89 | 19470.00 | 311.05 | 31528906.09 |
| 石嘴山 | 90436.70 | 8882.70 | 7205.19 | 9363.33 | 75.30 | 10100873.02 |
| 西宁 | 24527.00 | 5852.52 | 16871.20 | 5676.23 | 247.56 | 19714216.58 |
| 兰州 | 47533.15 | 14209.66 | 27262.34 | 19656.33 | 438.50 | 35126256.78 |
| 张掖 | 181005.02 | 1843.04 | 8018.83 | 3093.33 | 112.42 | 7277489.45 |
| 乌鲁木齐 | 40682.93 | 21688.18 | 30930.01 | 15083.33 | 456.80 | 40071565.61 |
| 哈密 | 66230.58 | 8247.49 | 6651.65 | 8333.33 | 67.00 | 9336897.85 |
表5 优化前后增减比例Tab. 5 Increase and decrease ratio before and after optimization |
| 城市 | 农业用水/% | 工业用水/% | 生活用水/% | 生态用水/% | 人口/% | 综合得分/% |
|---|---|---|---|---|---|---|
| 西安 | -3.29 | 3.30 | 10.32 | -17.84 | 0.61 | 7.51 |
| 银川 | -1.03 | 18.01 | 21.87 | -18.54 | 7.38 | 19.25 |
| 石嘴山 | -6.19 | 13.88 | 84.75 | -21.97 | 0.16 | 41.49 |
| 西宁 | -6.09 | 3.71 | 23.29 | -27.53 | -0.18 | 15.15 |
| 兰州 | -3.97 | -3.34 | 10.05 | -3.34 | -0.69 | 5.17 |
| 张掖 | -1.12 | 7.65 | 44.90 | -21.87 | 0.36 | 24.03 |
| 乌鲁木齐 | -5.17 | -8.10 | 6.29 | -3.93 | 11.89 | 2.05 |
| 哈密 | -0.55 | 3.09 | 6.77 | -7.41 | 0.00 | 4.04 |
++致 谢++ 本研究得以顺利完成,要衷心感谢中国科学院新疆生态与地理研究所提供的优良科研条件,使论文研究工作得以深入开展。同时,诚挚感谢新疆农业大学资源与环境学院、草业学院在研究过程中给予的大力支持。
| [1] |
张建港, 赖苹, 王江婷. 贵州省水资源生态足迹时空演变与可持续利用研究[J]. 环境污染与防治, 2024, 46(10): 1521-1528, 1537.
[
|
| [2] |
李洋. 沈阳市水资源承载力适度水平研究[J]. 水利技术监督, 2024(11): 203-207.
[
|
| [3] |
|
| [4] |
|
| [5] |
伍巧, 贺秀斌, 鲍玉海, 等. 四川省水资源承载力时空变化格局及驱动因素[J]. 水文, 2024, 44(6): 85-92.
[
|
| [6] |
王昆漩, 陈威. 基于改进模糊综合评价的十堰市水资源承载力评价[J]. 水电能源科学, 2024, 42(2): 14-17.
[
|
| [7] |
|
| [8] |
俞阳, 牟琴, 闵雪峰, 等. 基于熵权TOPSIS-SD的超大城市水资源承载力研究[J]. 人民长江, 2024, 55(12): 148-156, 175.
[
|
| [9] |
魏建涛, 李治军, 王海庆, 等. 河南省水资源空间匹配及承载力现状分析[J]. 人民黄河, 2024, 46(12): 78-84.
[
|
| [10] |
|
| [11] |
|
| [12] |
|
| [13] |
董远恒, 徐斌, 张雨薇, 等. 跨流域调水多水源多目标水量调度模拟-优化双层耦合算法[J]. 南水北调与水利科技, 2025, 23(1): 36-46.
[
|
| [14] |
卢娜, 张佳明, 苏承国, 等. 考虑水土互馈关系的区域水土资源联合优化配置[J]. 水科学进展, 2024, 35(2): 208-219.
[
|
| [15] |
邓毛颖, 邓策方. 动态规划法在水资源分配中的实践[J]. 给水排水, 2021, 57(S2): 253-256, 271.
[
|
| [16] |
唐晓宇, 刘铁, 黄粤, 等. 开都河流域水-能源-生态综合收益下的水资源优化配置[J]. 南水北调与水利科技, 2025, 23(1): 90-98.
[
|
| [17] |
|
| [18] |
|
| [19] |
王晓宇, 袁汝华, 王维. 新形势下黄河流域水资源配置SD模型构建与仿真[J]. 生态经济, 2024, 40(2): 181-190.
[
|
| [20] |
刘欣, 赵雪花, 武雯昱, 等. 基于NSGA-Ⅱ+ARSBX算法的太原市水资源优化配置[J]. 水利水电科技进展, 2025, 45(1): 79-86, 103.
[
|
| [21] |
史利杰, 苏律文, 杨侃. 基于改进多目标蝙蝠算法的洛河流域水库优化调度[J]. 水电能源科学, 2020, 38(8): 55-58, 82.
[
|
| [22] |
赵燕, 武鹏林, 祝雪萍. 基于改进萤火虫算法的水资源优化配置[J]. 人民黄河, 2019, 41(5): 62-66.
[
|
| [23] |
|
| [24] |
|
| [25] |
杜佰林, 张建丰, 高泽海, 等. 基于模拟退火粒子群算法的水资源优化配置[J]. 排灌机械工程学报, 2021, 39(3): 292-299.
[
|
| [26] |
|
| [27] |
|
| [28] |
|
| [29] |
|
| [30] |
|
| [31] |
|
| [32] |
刘欢, 宋孝玉, 李磊, 等. 中国31省(市、自治区)水资源承载力评价及预测研究[J]. 干旱地区农业研究, 2023, 41(4): 226-237.
[
|
| [33] |
姜德娟, 余灏哲, 李丽娟. 基于综合赋权和TOPSIS模型的山东省水资源承载力动态评价[J]. 资源科学, 2024, 46(3): 538-548.
[
|
| [34] |
吴明艳, 曾晓春, 刘兴德, 等. 基于熵权TOPSIS模型的西北五省区水资源承载力评价研究[J]. 中国农村水利水电, 2022, 64(12): 78-85, 92.
[
|
| [35] |
莫崇勋, 刘奇忠, 唐玲玲, 等. 基于模糊-博弈-障碍综合评价模型的玉林市水资源承载力评价[J]. 水电能源科学, 2024, 42(12): 50-53, 161.
[
|
| [36] |
|
| [37] |
向扬, 李治军. 基于改进TOPSIS模型的山西省水资源承载力与协调发展分析[J]. 水利水电技术, 2024, 55(4): 48-58.
[
|
| [38] |
李洪波, 王成文, 吴瑞, 等. 基于博弈论法的银川市地下水资源承载力评价[J]. 人民黄河, 2023, 45(S1): 42-43.
[
|
| [39] |
|
| [40] |
|
| [41] |
王西琴, 刘昌明, 张远. 基于二元水循环的河流生态需水水量与水质综合评价方法——以辽河流域为例[J]. 地理学报, 2006, 61(11): 1132-1140.
[
|
| [42] |
|
/
| 〈 |
|
〉 |

