
Ideal numerical tests of topographic precipitation around the Helan Mountain under different wind field structures
Received date: 2024-01-19
Revised date: 2024-04-16
Online published: 2025-08-14
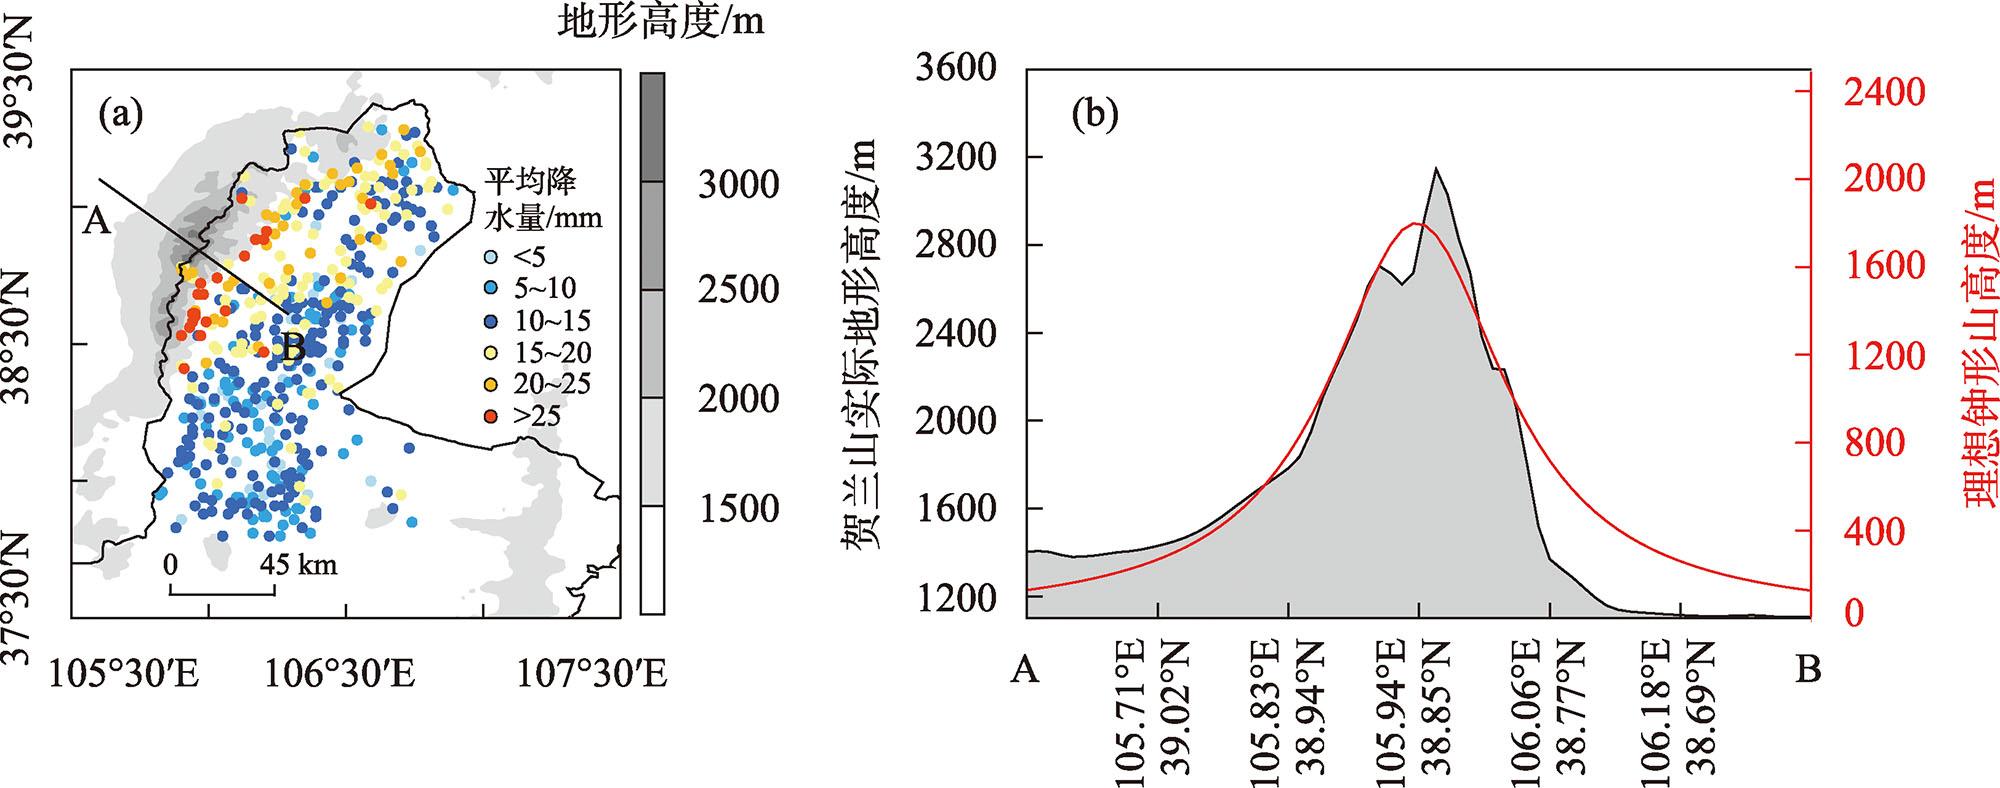
Topographic precipitation is one of the main types of precipitation in northwest China. It is therefore of great significance to achieve a deeper understanding of the mechanism of topographic precipitation formation to improve forecasting ability. In this study, the vertical distribution structure of different types of wind fields was constructed based on the high-altitude environmental parameters during 20 heavy rains around the eastern foothills of Helan Mountain, and the em_hill2d_x module of WRF model was used to conduct ideal numerical experiments on the influence of different types of wind field on precipitation distribution. The results show that: (1) The dry air flow of two different types of wind fields (with/without wind shear) on the windward slope of the mountain range has an uplift effect of terrain on the windward slope air flow. The leeward slope fluctuation showed different characteristics; under the condition of single layer uniform flow, the leeward slope is mainly represented by a mountain wave propagating in the vertical direction. Under the wind field with low-level wind shear, the leeward side mainly reflects the characteristics of the dorsal wave, and the gravity wave has the characteristics of coexisting horizontal and vertical propagation. With the increase in low-level wind shear, the characteristics of the horizontal propagation of the dorsal wave become increasingly obvious. (2) The simulated precipitation under the condition of a single layer of uniform wet airflow is mainly located on the windward side, and the precipitation intensity is relatively weak on the leeward side under the influence of strong downhill wind. When the wind speed increases to more than 10 m·s-1, the large cloud water content area on the windward side converges to the top of the mountain, and the precipitation intensity increases significantly. In the presence of low-level wind shear flow moving over the mountains, the test result shows that both the windward and leeward side there is a strong rainfall center, with a deep convective system on the leeward slope, and the precipitation on both sides increases with the increase in wind speed. (3) The simulation results under the condition of low-altitude east wind and high-altitude west wind show that the appearance of high-altitude west wind strengthens the updraft on the windward slope and is not conducive to the transport of water vapor downstream; the precipitation on the leeward side is significantly weakened; the precipitation is more concentrated near the upper reaches of the mountain peak; and the intensity also increases to a certain extent. This is one of the main reasons for the significant difference in precipitation characteristics between the two sides of the Helan Mountain.
LI Chao , LONG Xiao , CAO Yiqing , HAN Zifei , WANG Hao , ZHENG Jingyuan . Ideal numerical tests of topographic precipitation around the Helan Mountain under different wind field structures[J]. Arid Zone Research, 2024 , 41(8) : 1272 -1287 . DOI: 10.13866/j.azr.2024.08.02
表1 暴雨过程Tab. 1 Precipitation process information |
| 暴雨时段(北京时) | 持续时间/h | 最大雨量/mm |
|---|---|---|
| 2009年7月7日8:00—8日7:00 | 24 | 汝箕沟107.6 |
| 2012年7月29日20:00—30日11:00 | 16 | 滚钟口174.3 |
| 2015年9月3日4:00—4日1:00 | 21 | 小口子65.9 |
| 2015年9月8日1:00—8日20:00 | 20 | 八顷村69.6 |
| 2016年7月24日5:00—12:00 | 8 | 灵武煤矿89.5 |
| 2016年8月13日15:00—14日14:00 | 24 | 王老滩110.2 |
| 2016年8月21日19:00—22日8:00 | 14 | 滑雪场241.7 |
| 2016年8月22日22:00—23日6:00 | 9 | 路家营子村57 |
| 2017年6月4日15:00—5日10:00 | 20 | 黄旗口沟116.5 |
| 2017年7月25日20:00—26日2:00 | 6 | 窑子圈64.4 |
| 2017年7月5日3:00—18:00 | 16 | 滑雪场114.4 |
| 2018年7月19日3:00—10:00 | 8 | 明长城136.2 |
| 2018年7月1日9:00—2日1:00 | 17 | 牛首山84.3 |
| 2018年7月22日19:00—23日7:00 | 13 | 滑雪场277.6 |
| 2018年7月23日12:00—20:00 | 9 | 红翔新村89.3 |
| 2018年8月31日19:00—9月1日17:00 | 23 | 苦水沟136.9 |
| 2018年8月6日12:00—7日16:00 | 29 | 马莲口119.1 |
| 2018年8月9日12:00—10日13:00 | 26 | 临河镇71.4 |
| 2019年8月2日18:00—3日0:00 | 7 | 暖泉农场71 |
| 2020年8月11日7:00—12日8:00 | 26 | 五渠村142.5 |
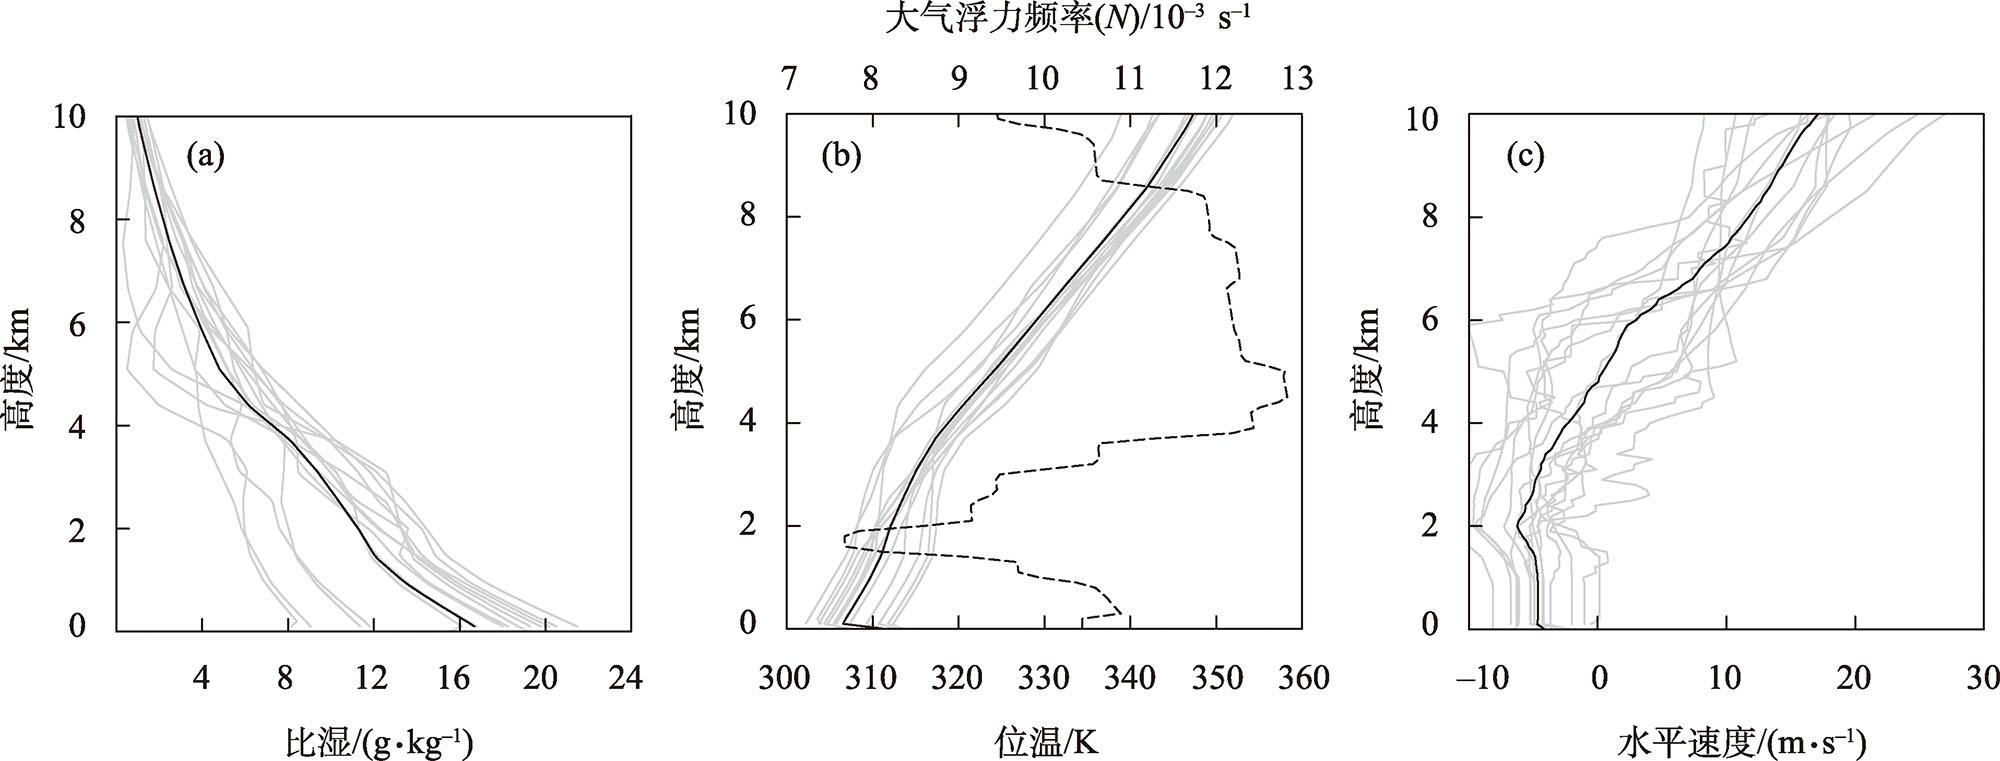
图2 贺兰山东麓20次暴雨个例降水期间比湿(a,单位:g·kg-1)、位温(b,单位:K)、风速(c,单位:m·s-1)垂直分布(灰色实线)及各气象要素的平均分布(黑色实线)注:(b)中黑色虚线为由平均位温廓线计算的大气浮力频率(N)的垂直分布。 Fig. 2 Vertical distribution (gray solid line) of specific humidity (a, unit: g·kg-1), potential temperature (b, unit: K), wind speed (c, unit: m·s-1) and average distribution of meteorological elements (black solid line) during individual precipitation of 20 rainstorms at the eastern foot of Helan Mountain |
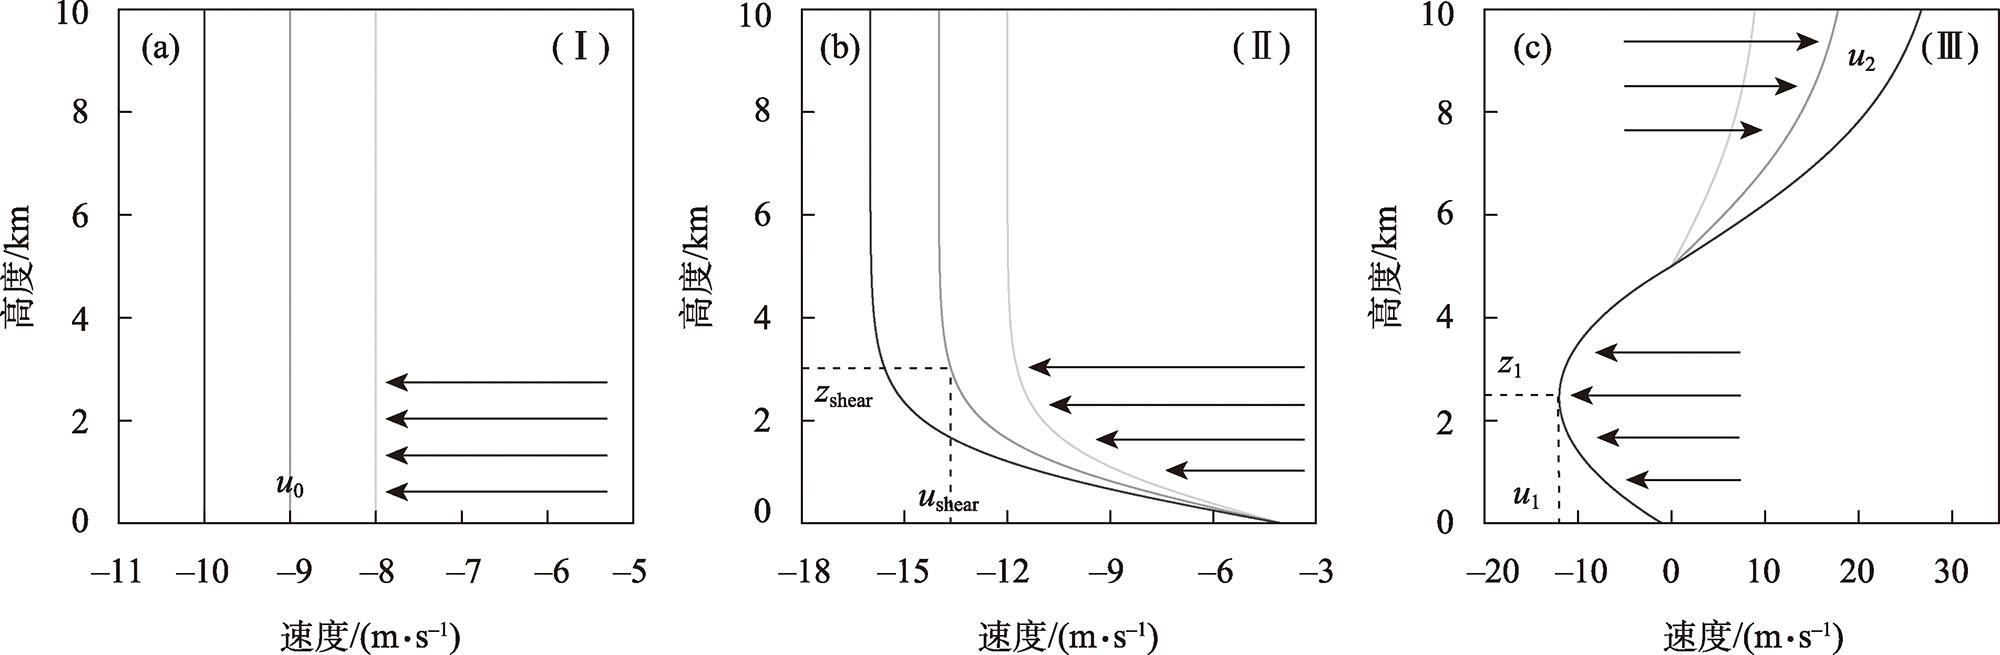
图3 数值试验中采用的三种风场垂直分布结构:单层均一东风(a)、低空存在风切变东风(b)和低空与(Ⅱ)类似但高空为西风(c)Fig. 3 Distribution of three type vertical wind field structures were used in the numerical tests: a single layer of uniform east wind (a), low level with wind shear east wind (b), and low level similar to (Ⅱ) but high level with west wind (c) |
表2 试验设计Tab. 2 Design of experiments |
| 试验名称 | N/s-1 | 比湿/(g·g-1) | 风场结构 | 东风/(m·s-1) | 西风/(m·s-1) | 试验目的 | |
|---|---|---|---|---|---|---|---|
| 干过程 (WRF-dry) | D1 | N = 0.007 | 0 | (Ⅰ) | u0:-4、-6、-8、-10、-13、-15 | - | 重力波特征 |
| D2 | (Ⅱ) | ushear:-8、-10、-12、-15 | - | ||||
| 湿过程 (WRF-moist) | M1 | 以20次降水过程的平均位温阔线 作为初始场 | 以20次降水过程 的平均比湿阔线 作为初始场 | (Ⅰ) | u0:-4、-5、-6、-7、-8、-9、-10、-11、 -12、-13、-14 | - | 重力波特征、 降水分布 特征 |
| M2 | (Ⅱ) | ushear:-8、-9、-10、-11、-12、-13、-14、 -15、-16、-17、-18、-19、-20、-22 | - | ||||
| M3 | (Ⅲ) | u1:-14 | u2:5、10、20、 30、40 |
注:取西风为正值,-代表无。 |
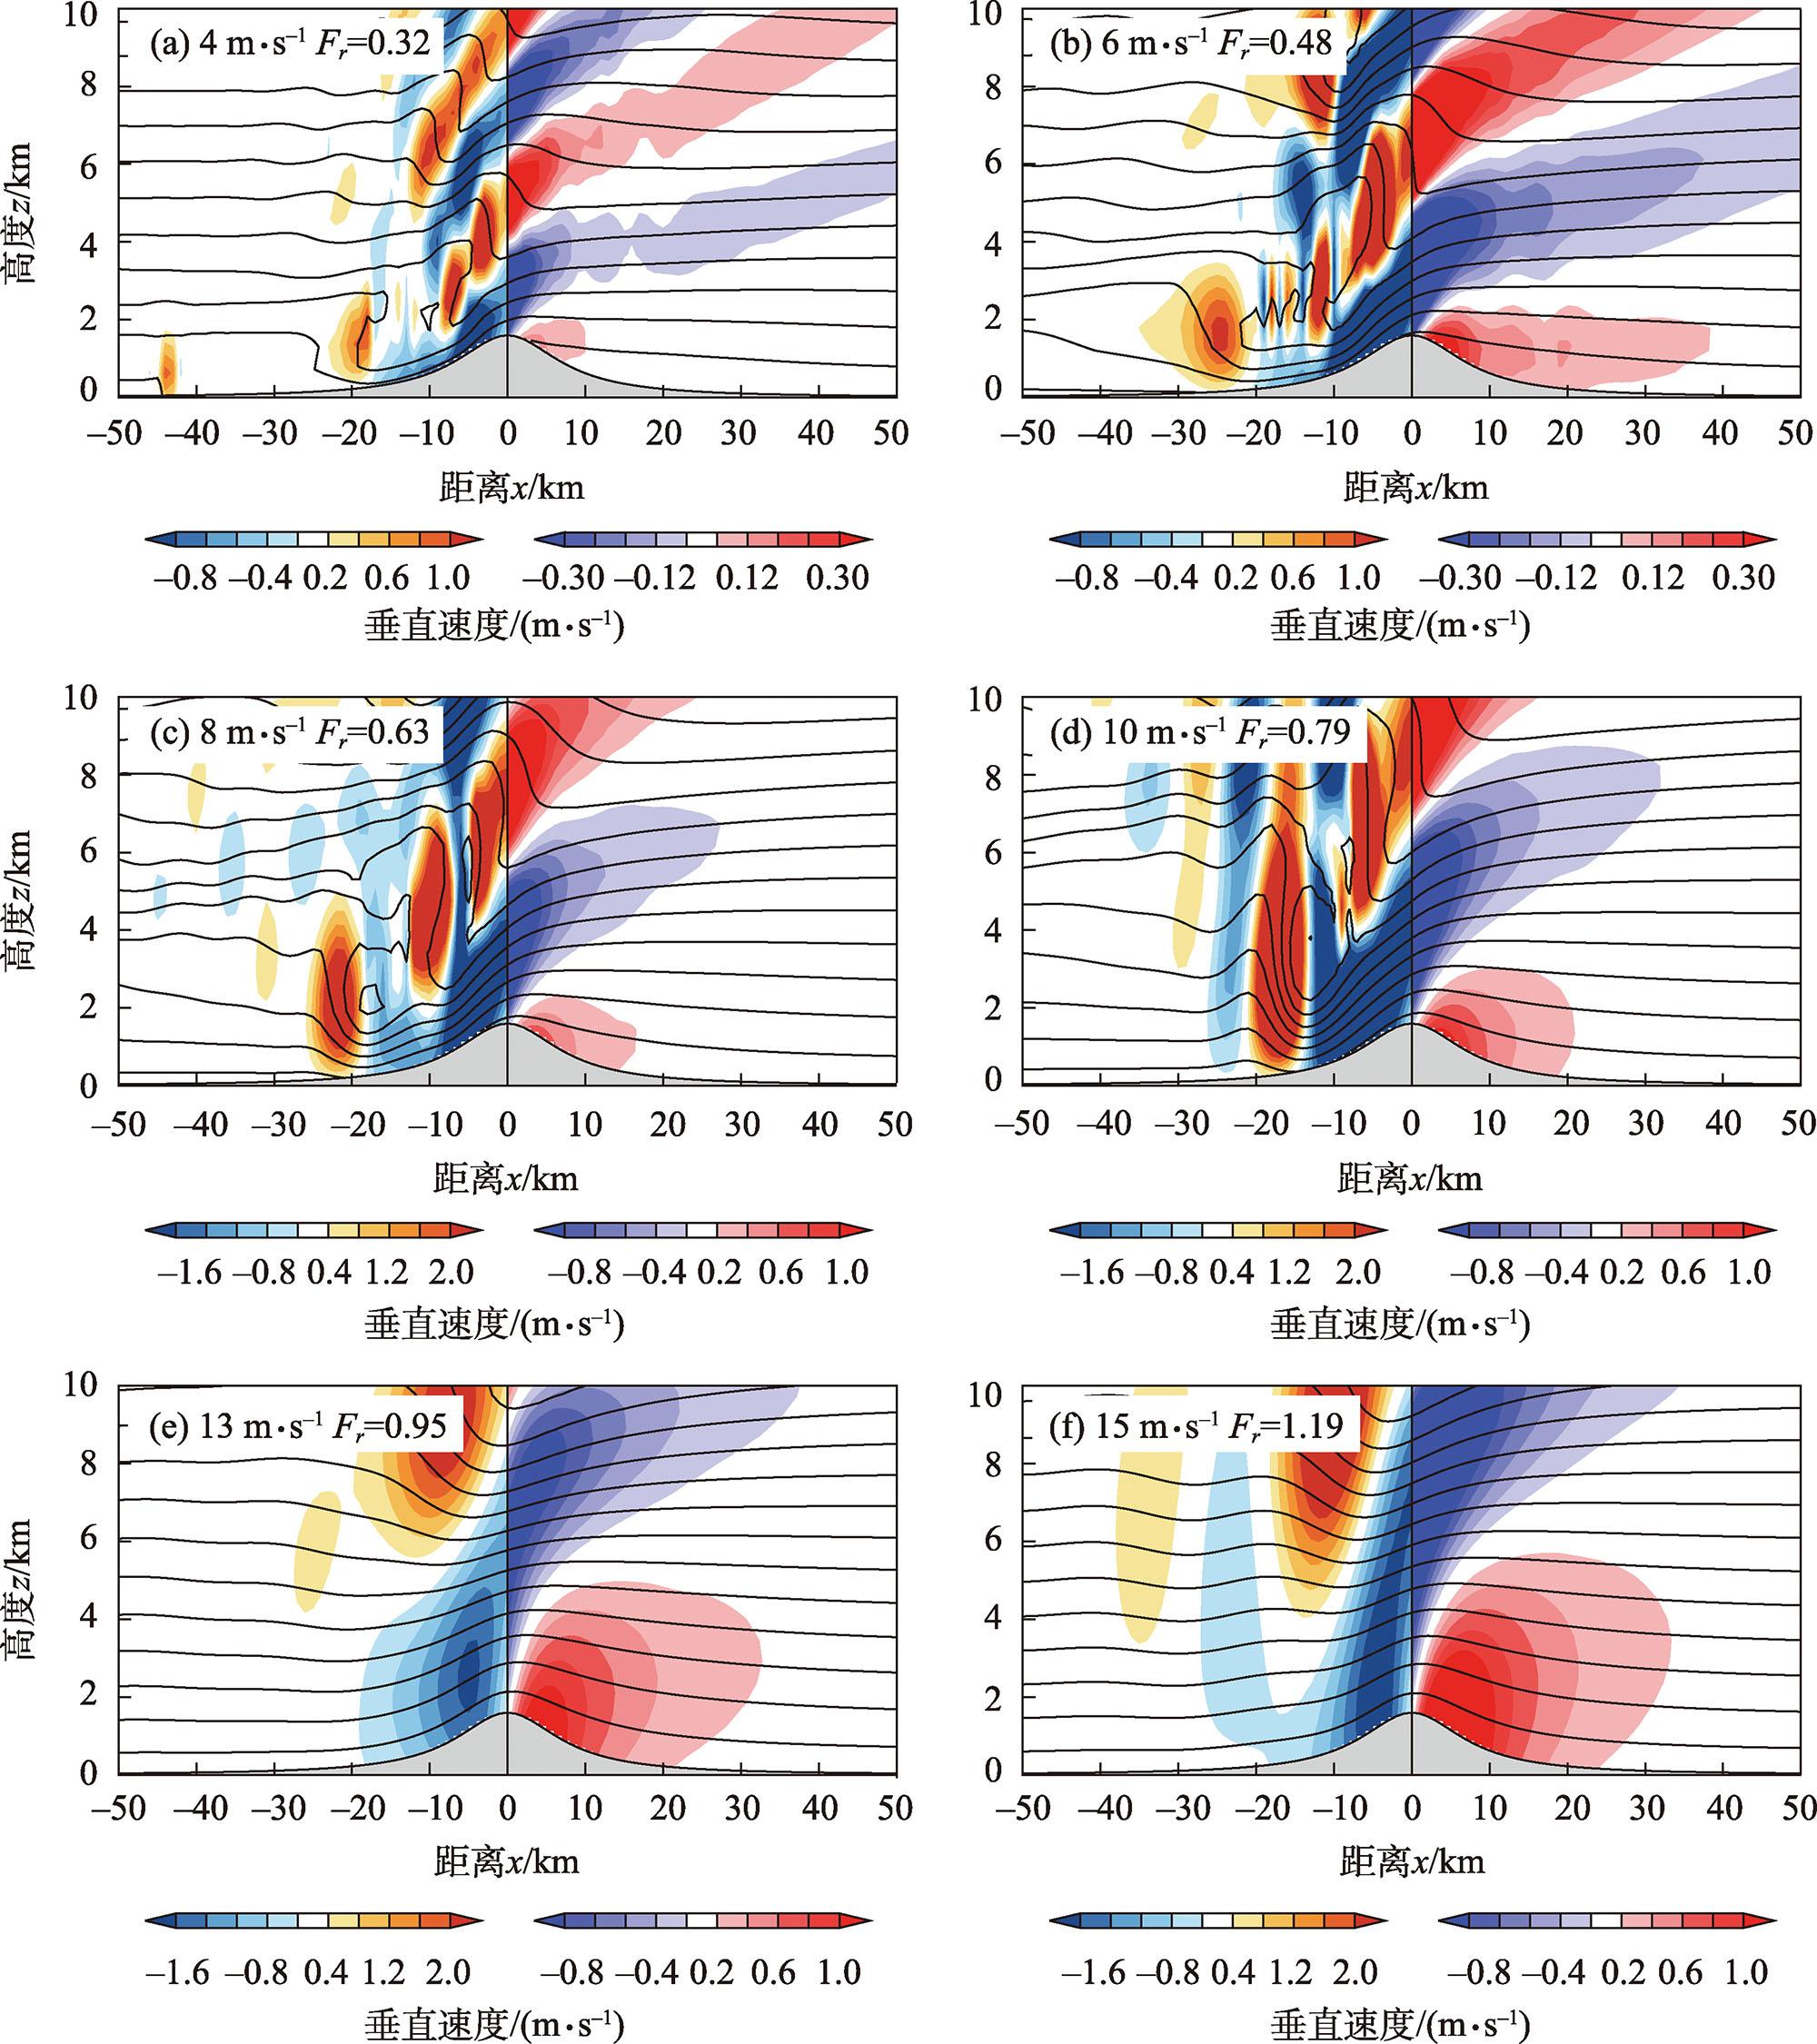
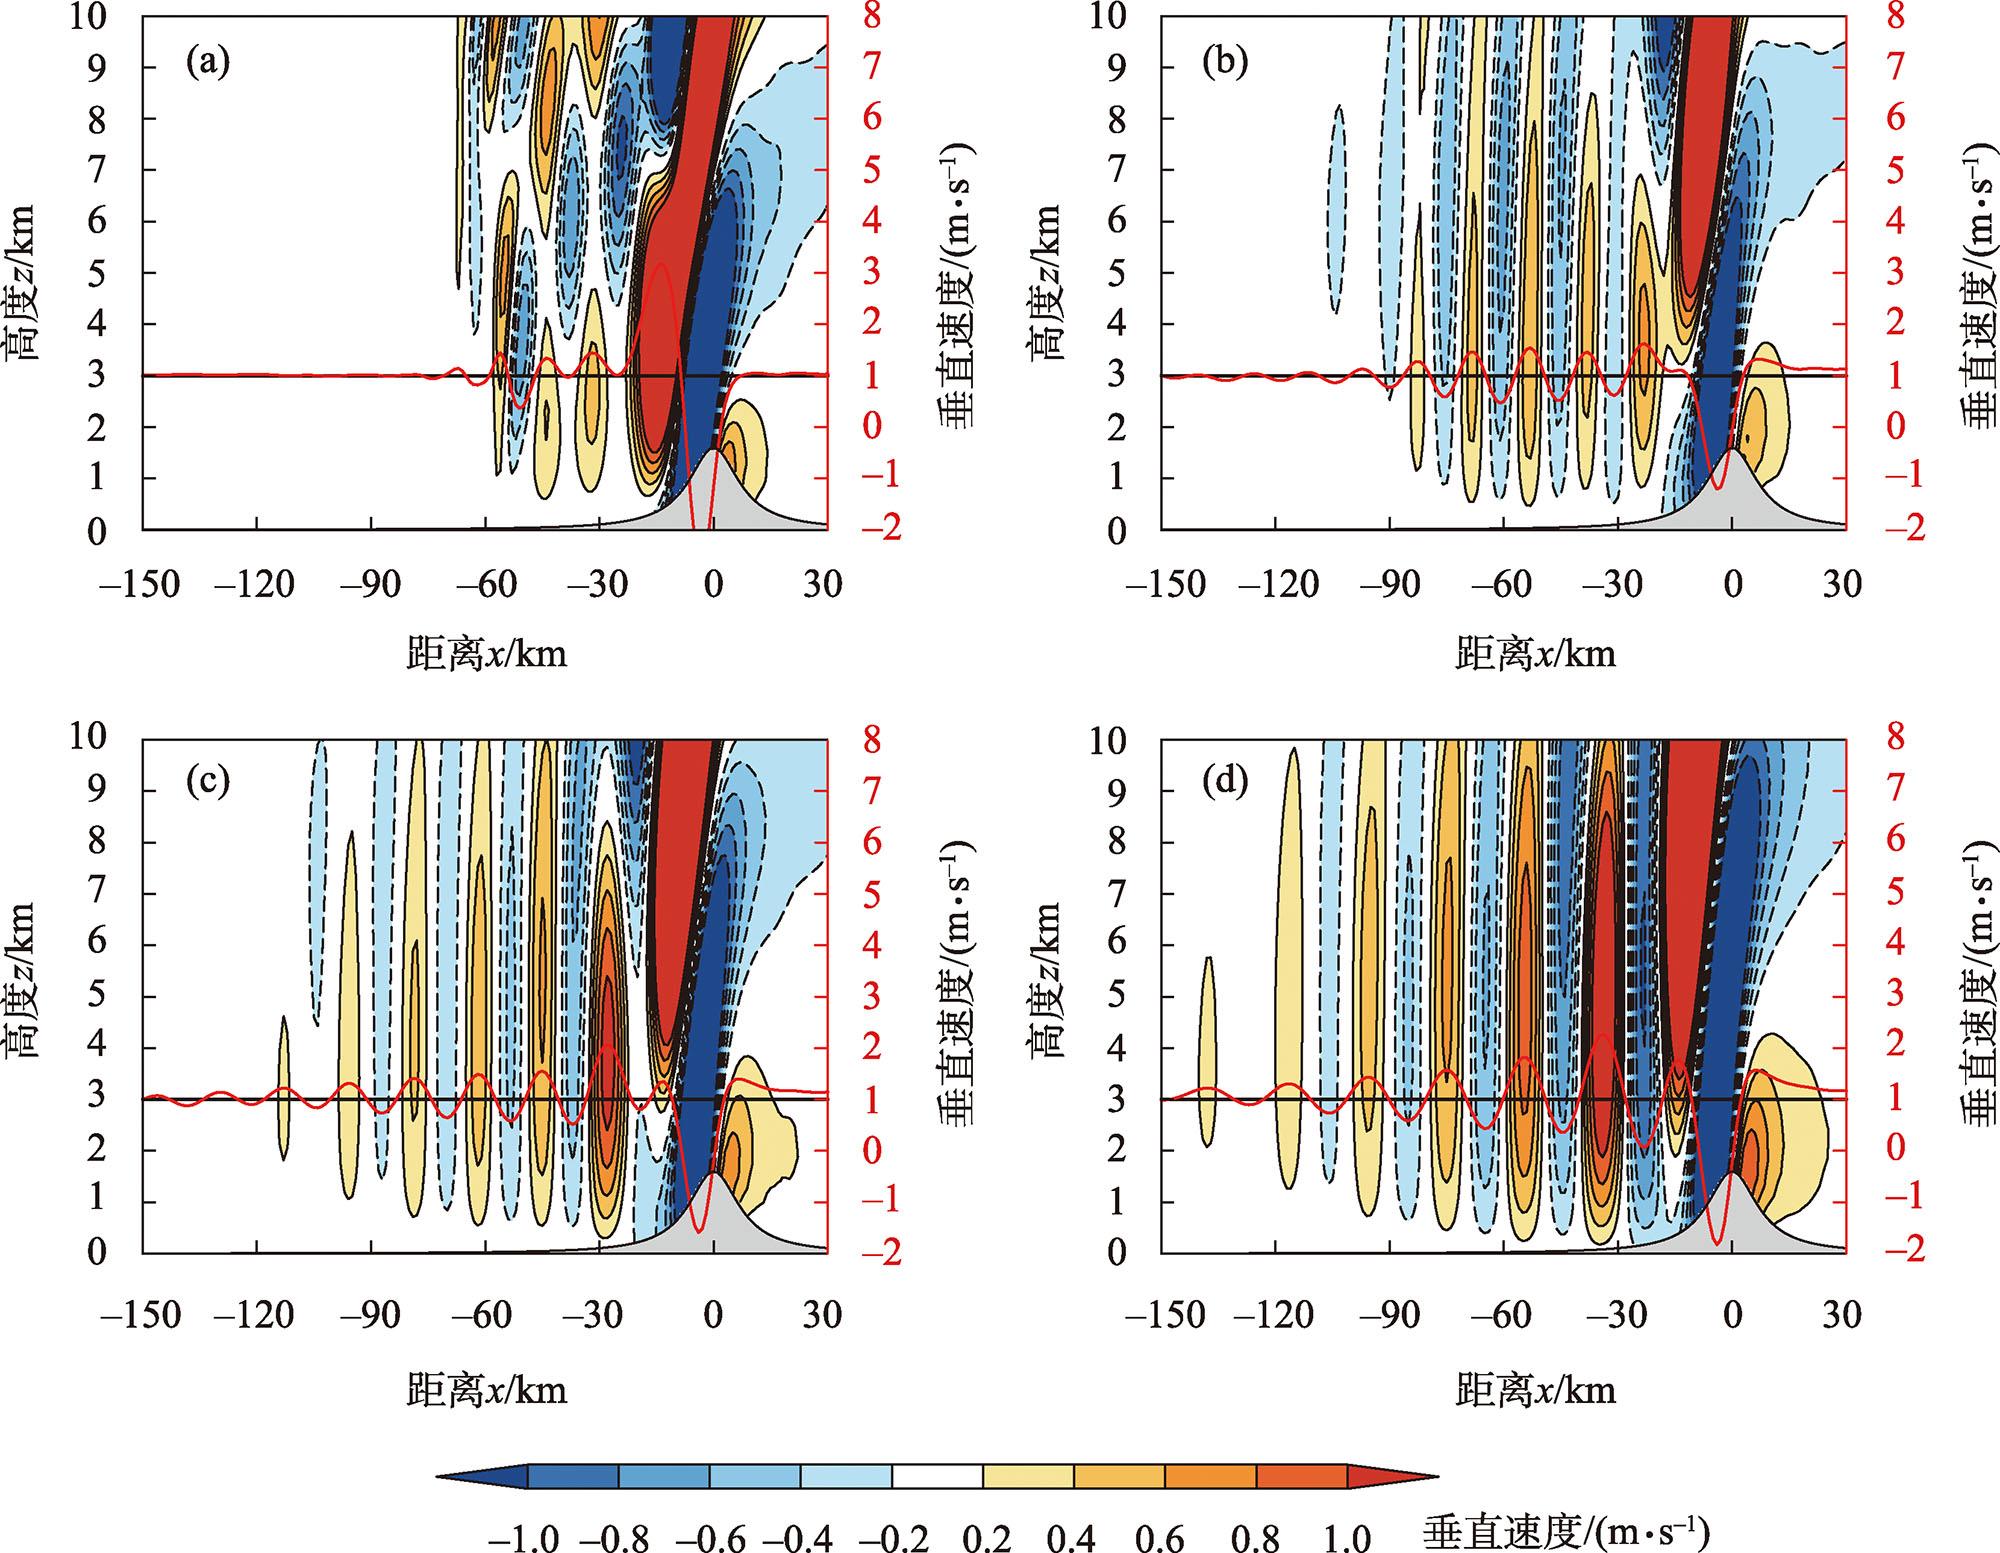
图5 具有不同大小风切变的东风(a:ushear =-8 m·s-1;b:ushear =-10 m·s-1;c:ushear =-12 m·s-1;d:ushear =-15 m·s-1)过山试验(D2)模拟的垂直速度场(阴影,单位:m·s-1)及2 km高度处垂直速度在山体两侧的变化(红色实线,单位:m·s-1)Fig. 5 Vertical velocity field (shadow, unit: m·s-1) and vertical velocity variation at 2 km height on both sides of the mountain (red line, unit: m·s-1) simulated by easterly cross-mountain experiments (D2) with different sizes of wind shear (a: ushear =-8 m·s-1, b: ushear =-10 m·s-1, c: ushear =-12 m·s-1, d: ushear =-15 m·s-1) |
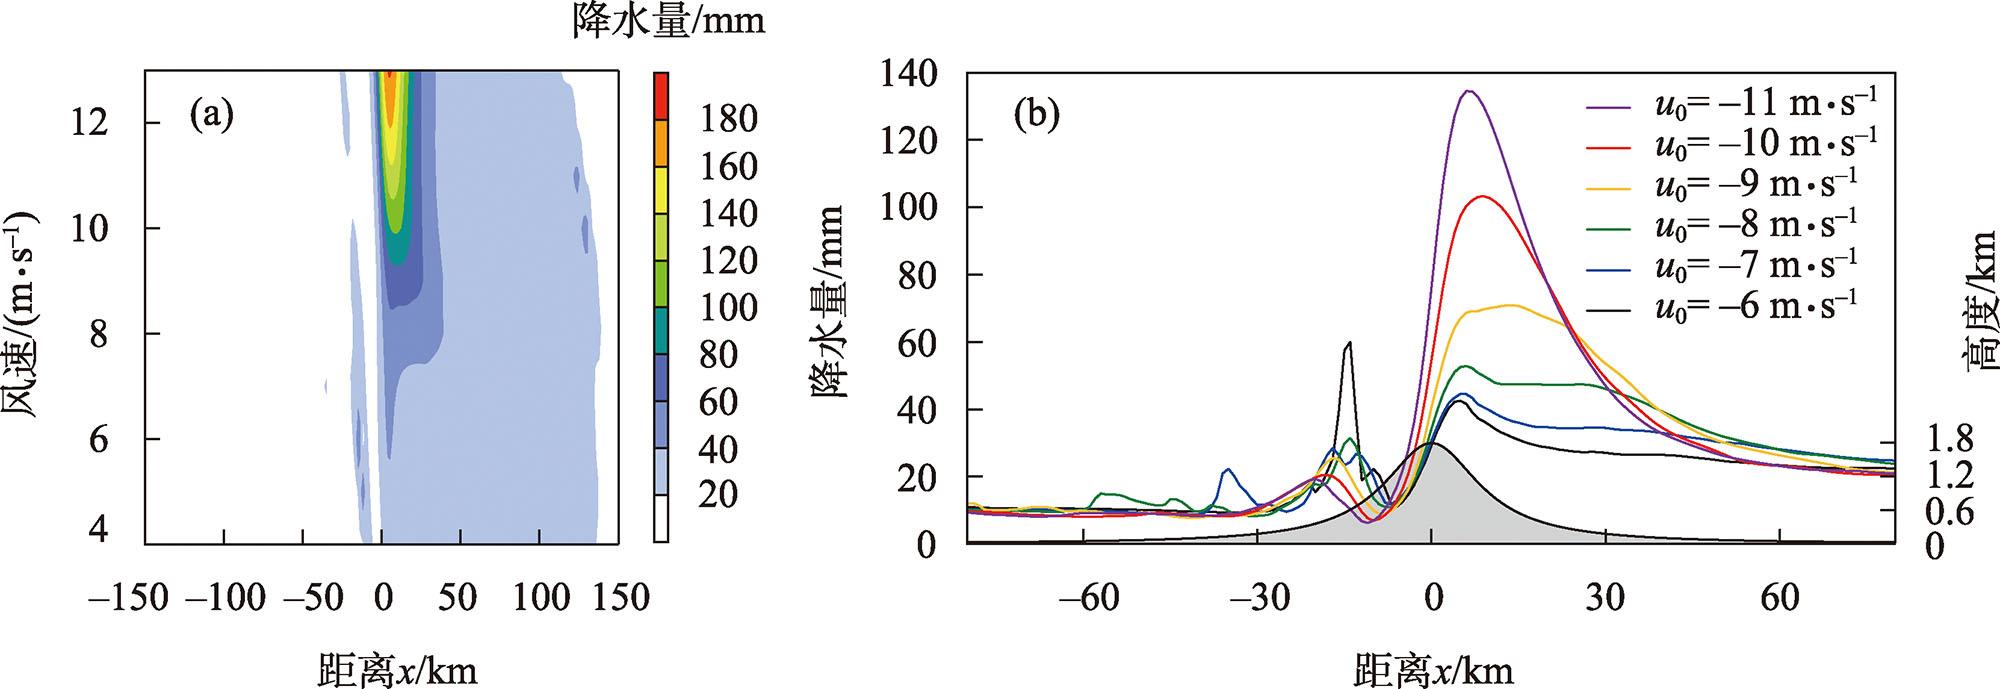
图7 M1试验中不同风速(u0)条件下模拟的降水量在山体两侧分布(a,单位:mm)以及几个特定风速条件下整个模拟时段的累积降水量(b,单位:mm)Fig. 7 Simulated precipitation distribution (a, unit: mm) on both sides of mountain under different wind speed (u0) in M1 experiments and cumulative precipitation for the entire simulation period under several specific wind speed conditions (b, unit: mm) |
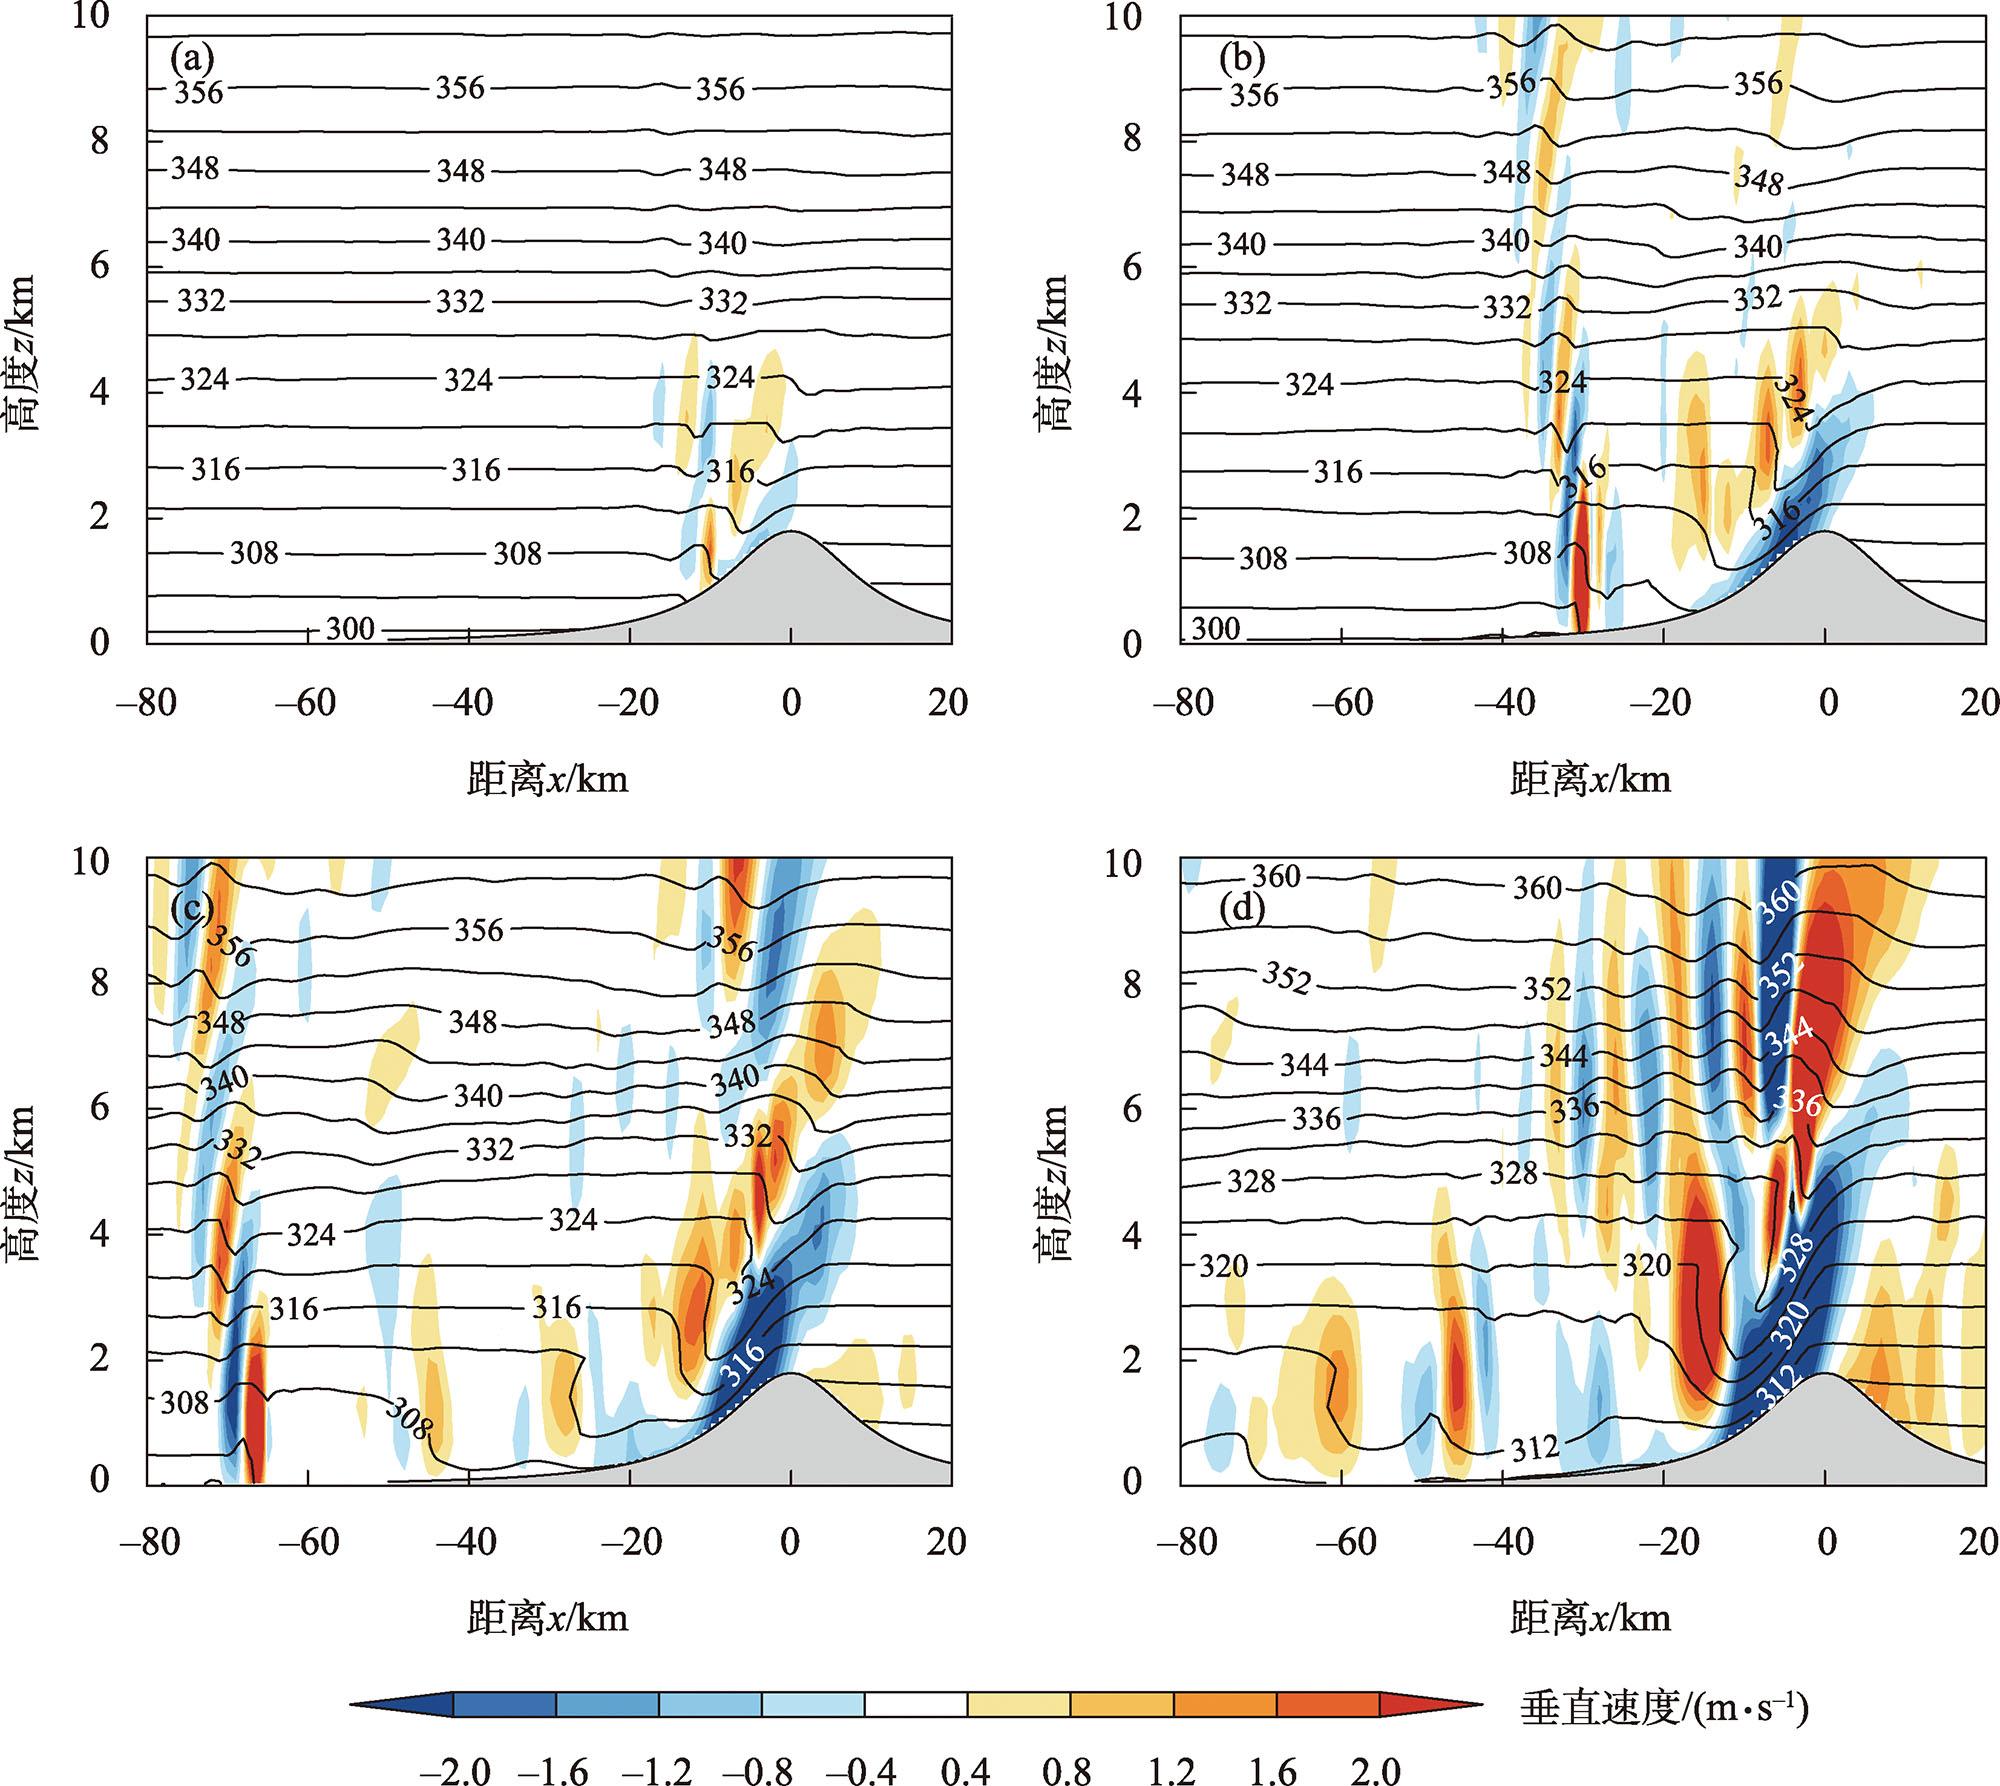
图8 M1试验(a: u0= -4 m·s-1,b: u0= -7 m·s-1,c: u0= -10 m·s-1,d: u0= -13 m·s-1)模拟至第360 min时的垂直速度场(阴影,单位:m·s-1)及位温场(等值线,单位:K)Fig. 8 Simulated vertical velocity field (shadow, unit: m·s-1) and potential temperature field (contour line, unit: K) at 360 min in M1 (a: u0= -4 m·s-1, b: u0= -7 m·s-1, c: u0= -10 m·s-1, d: u0= -13 m·s-1) experiments |
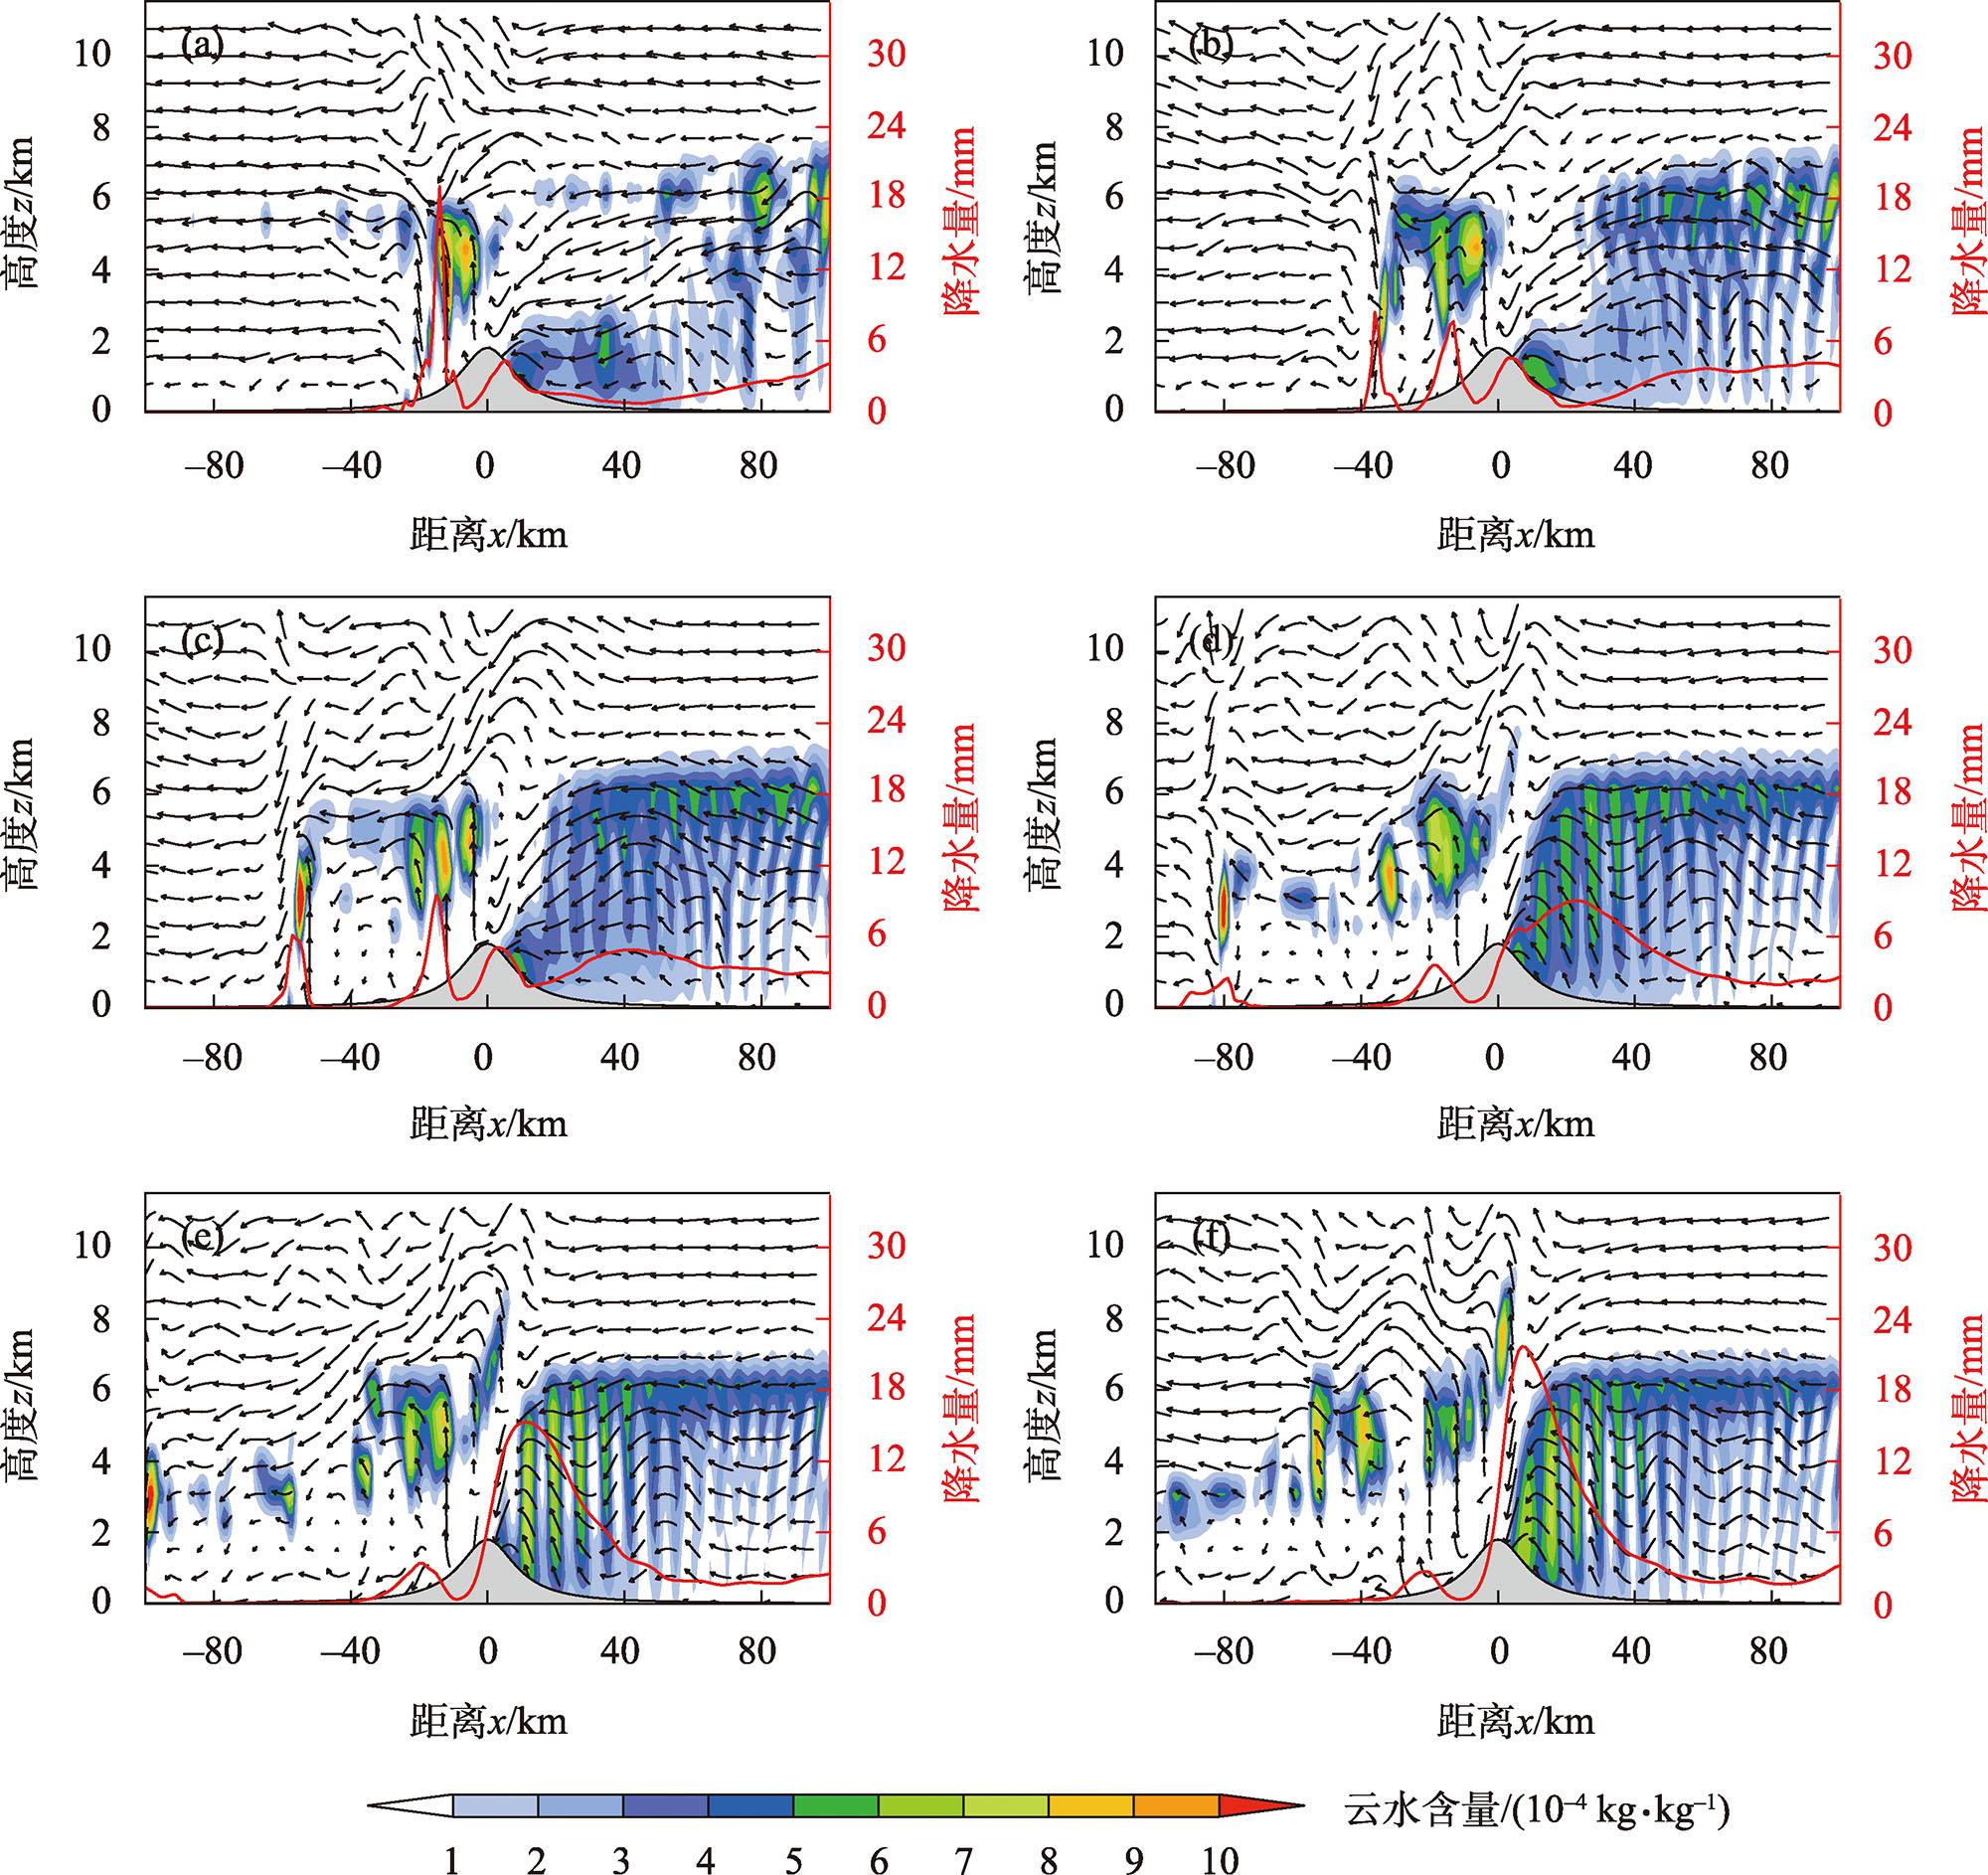
图9 M1试验(a:u0=-6 m·s-1、b:u0=-7 m·s-1、c:u0=-8 m·s-1、d:u0=-9 m·s-1、e:u0=-10 m·s-1、f:u0=-11 m·s-1)模拟至第540 min时的云水含量(阴影,单位:10-4 kg·kg-1)、流场(矢量箭头,单位:m·s-1)垂直剖面图及模拟的480~600 min内的累积降水量(红色曲线,单位:mm)Fig. 9 Simulated cloud water content (shadow, unit: 10-4 kg·kg-1), flow field (vector arrow, unit: m·s-1) vertical profile at 540 min and accumulated precipitation during 480-600 min (red curve, unit: mm) in M1 experiments (a: u0= -6 m·s-1, b: u0= -7 m·s-1, c: u0= -8 m·s-1, d: u0= -9 m·s-1, e: u0= -10 m·s-1, f: u0= -11 m·s-1) |
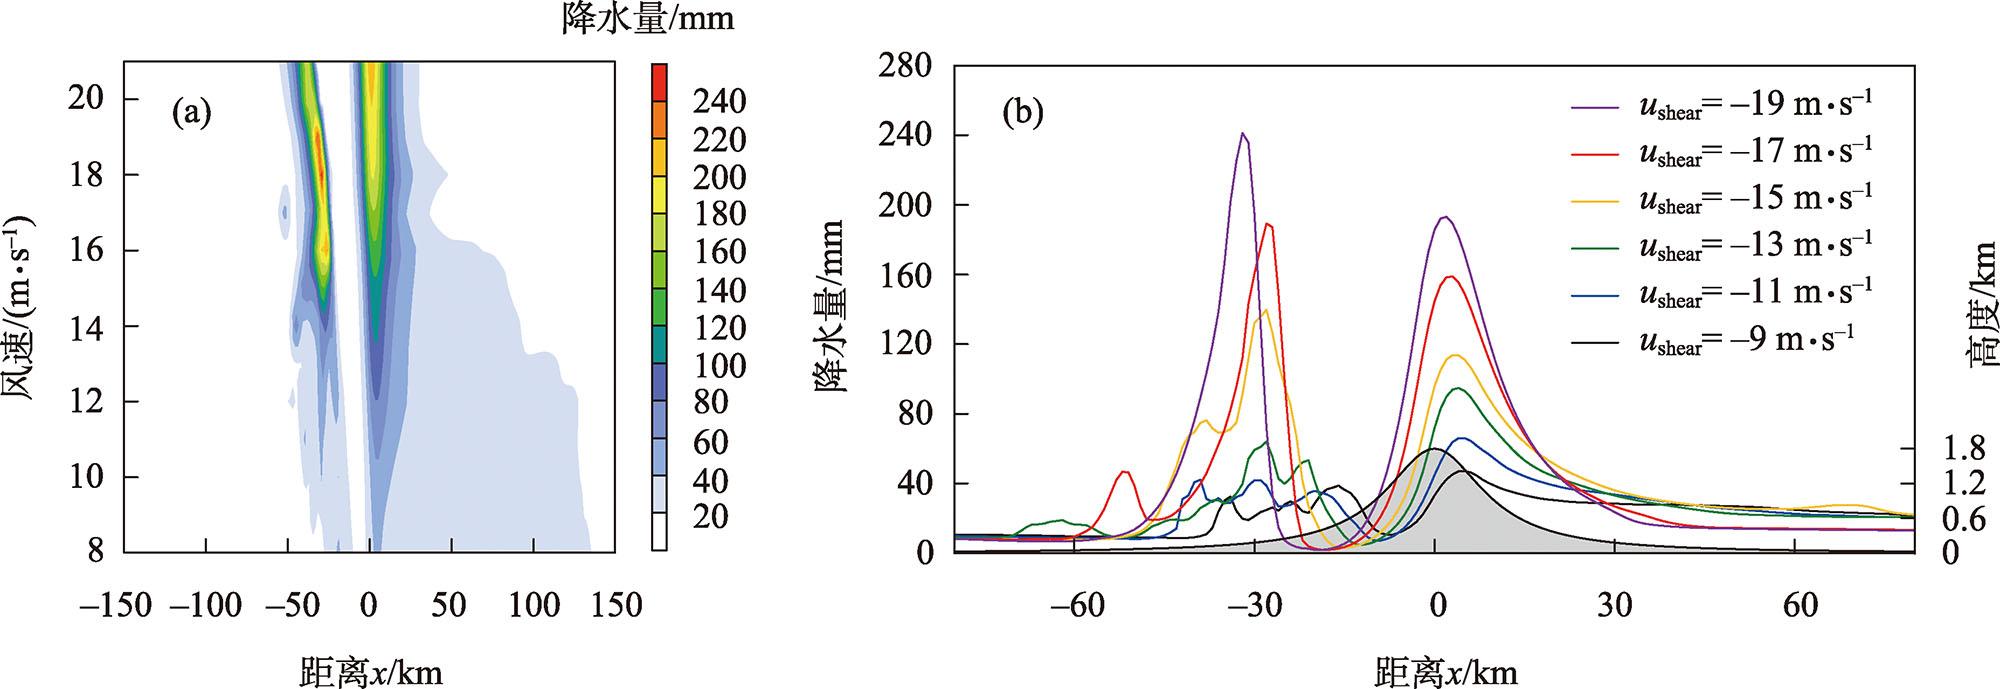
图10 M2试验中不同风速(ushear)条件下模拟的降水量在山体两侧的分布(a,单位:mm)以及几个特定风速条件下整个模拟时段的累积降水量(b,单位:mm)Fig. 10 Simulated precipitation distribution (a, unit: mm) on both sides of mountain under different wind speed (ushear) in M2 experiments and cumulative precipitation for the entire simulation period under several specific wind speed conditions (b, unit: mm) |
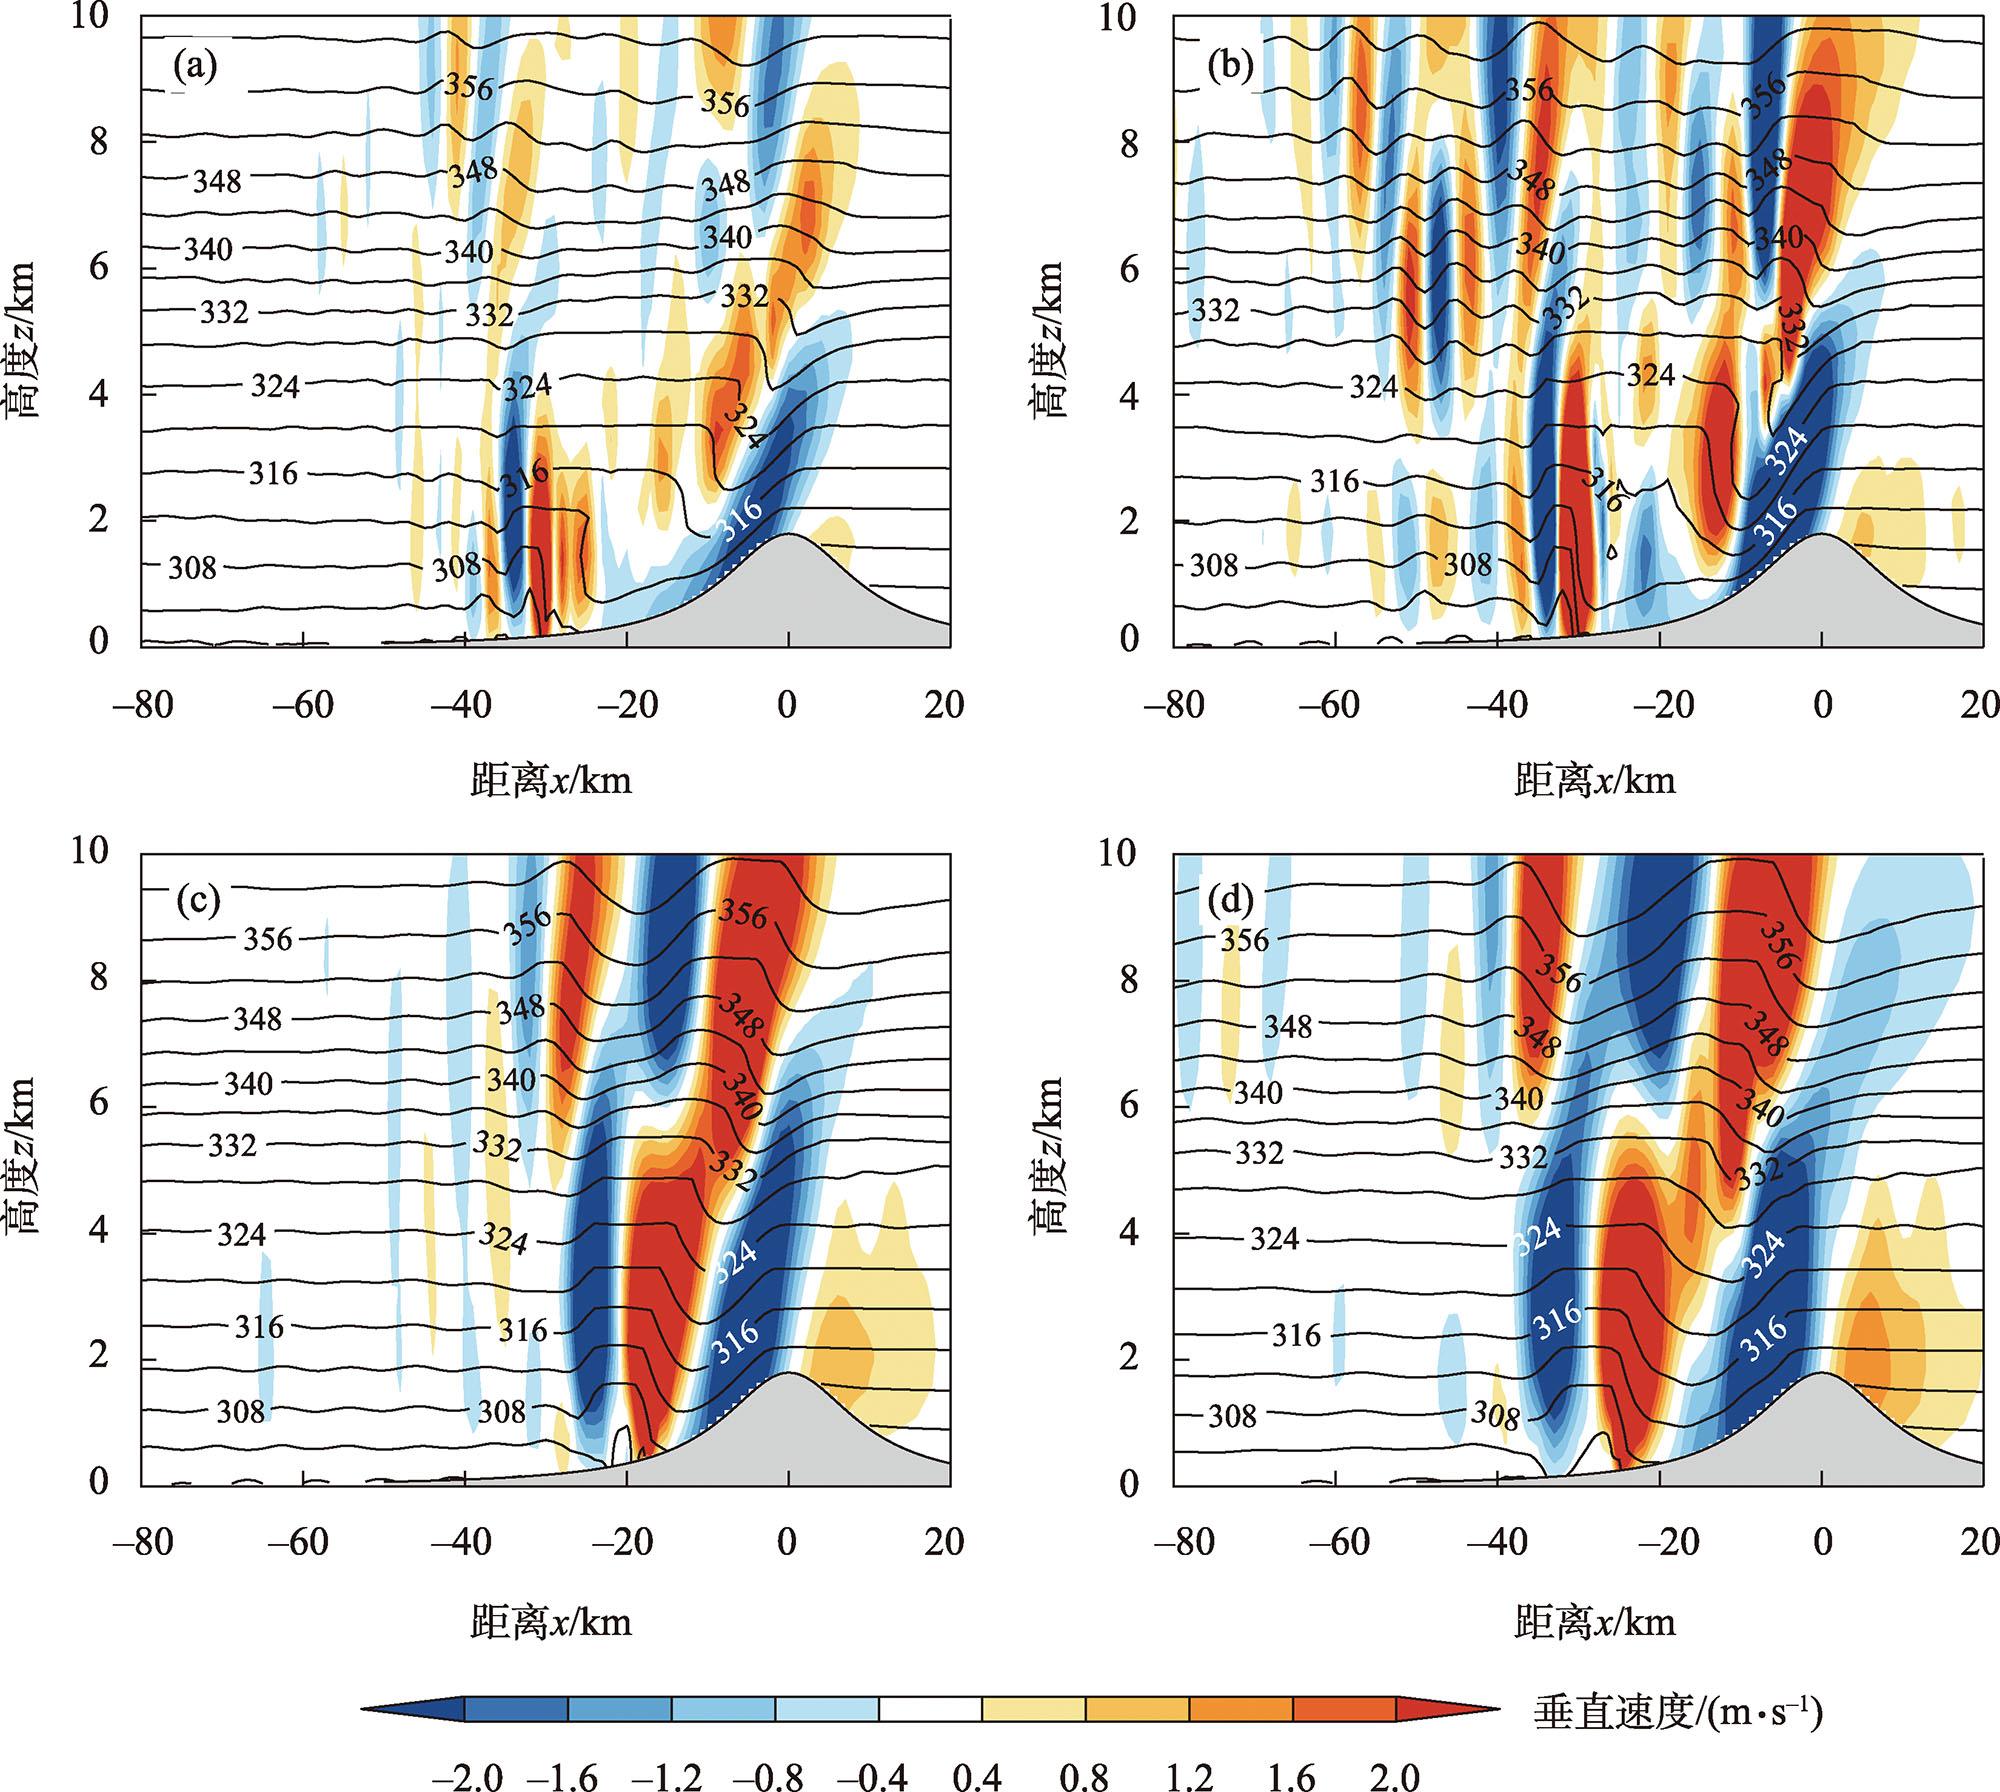
图11 M2试验(a:ushear=-8 m·s-1,b:ushear=-12 m·s-1,c:ushear=-16 m·s-1,d:ushear=-20 m·s-1)模拟至第360 min时的垂直速度场(阴影,单位:m·s-1)与位温场(等值线,单位:K)Fig. 11 Simulated vertical velocity field (shadow, unit: m·s-1) and potential temperature field (contour line, unit: K) at 360 min by M2 (a: ushear= -8 m·s-1, b: ushear= -12 m·s-1, c: ushear= -16 m·s-1, d: ushear= -20 m·s-1) experiments |
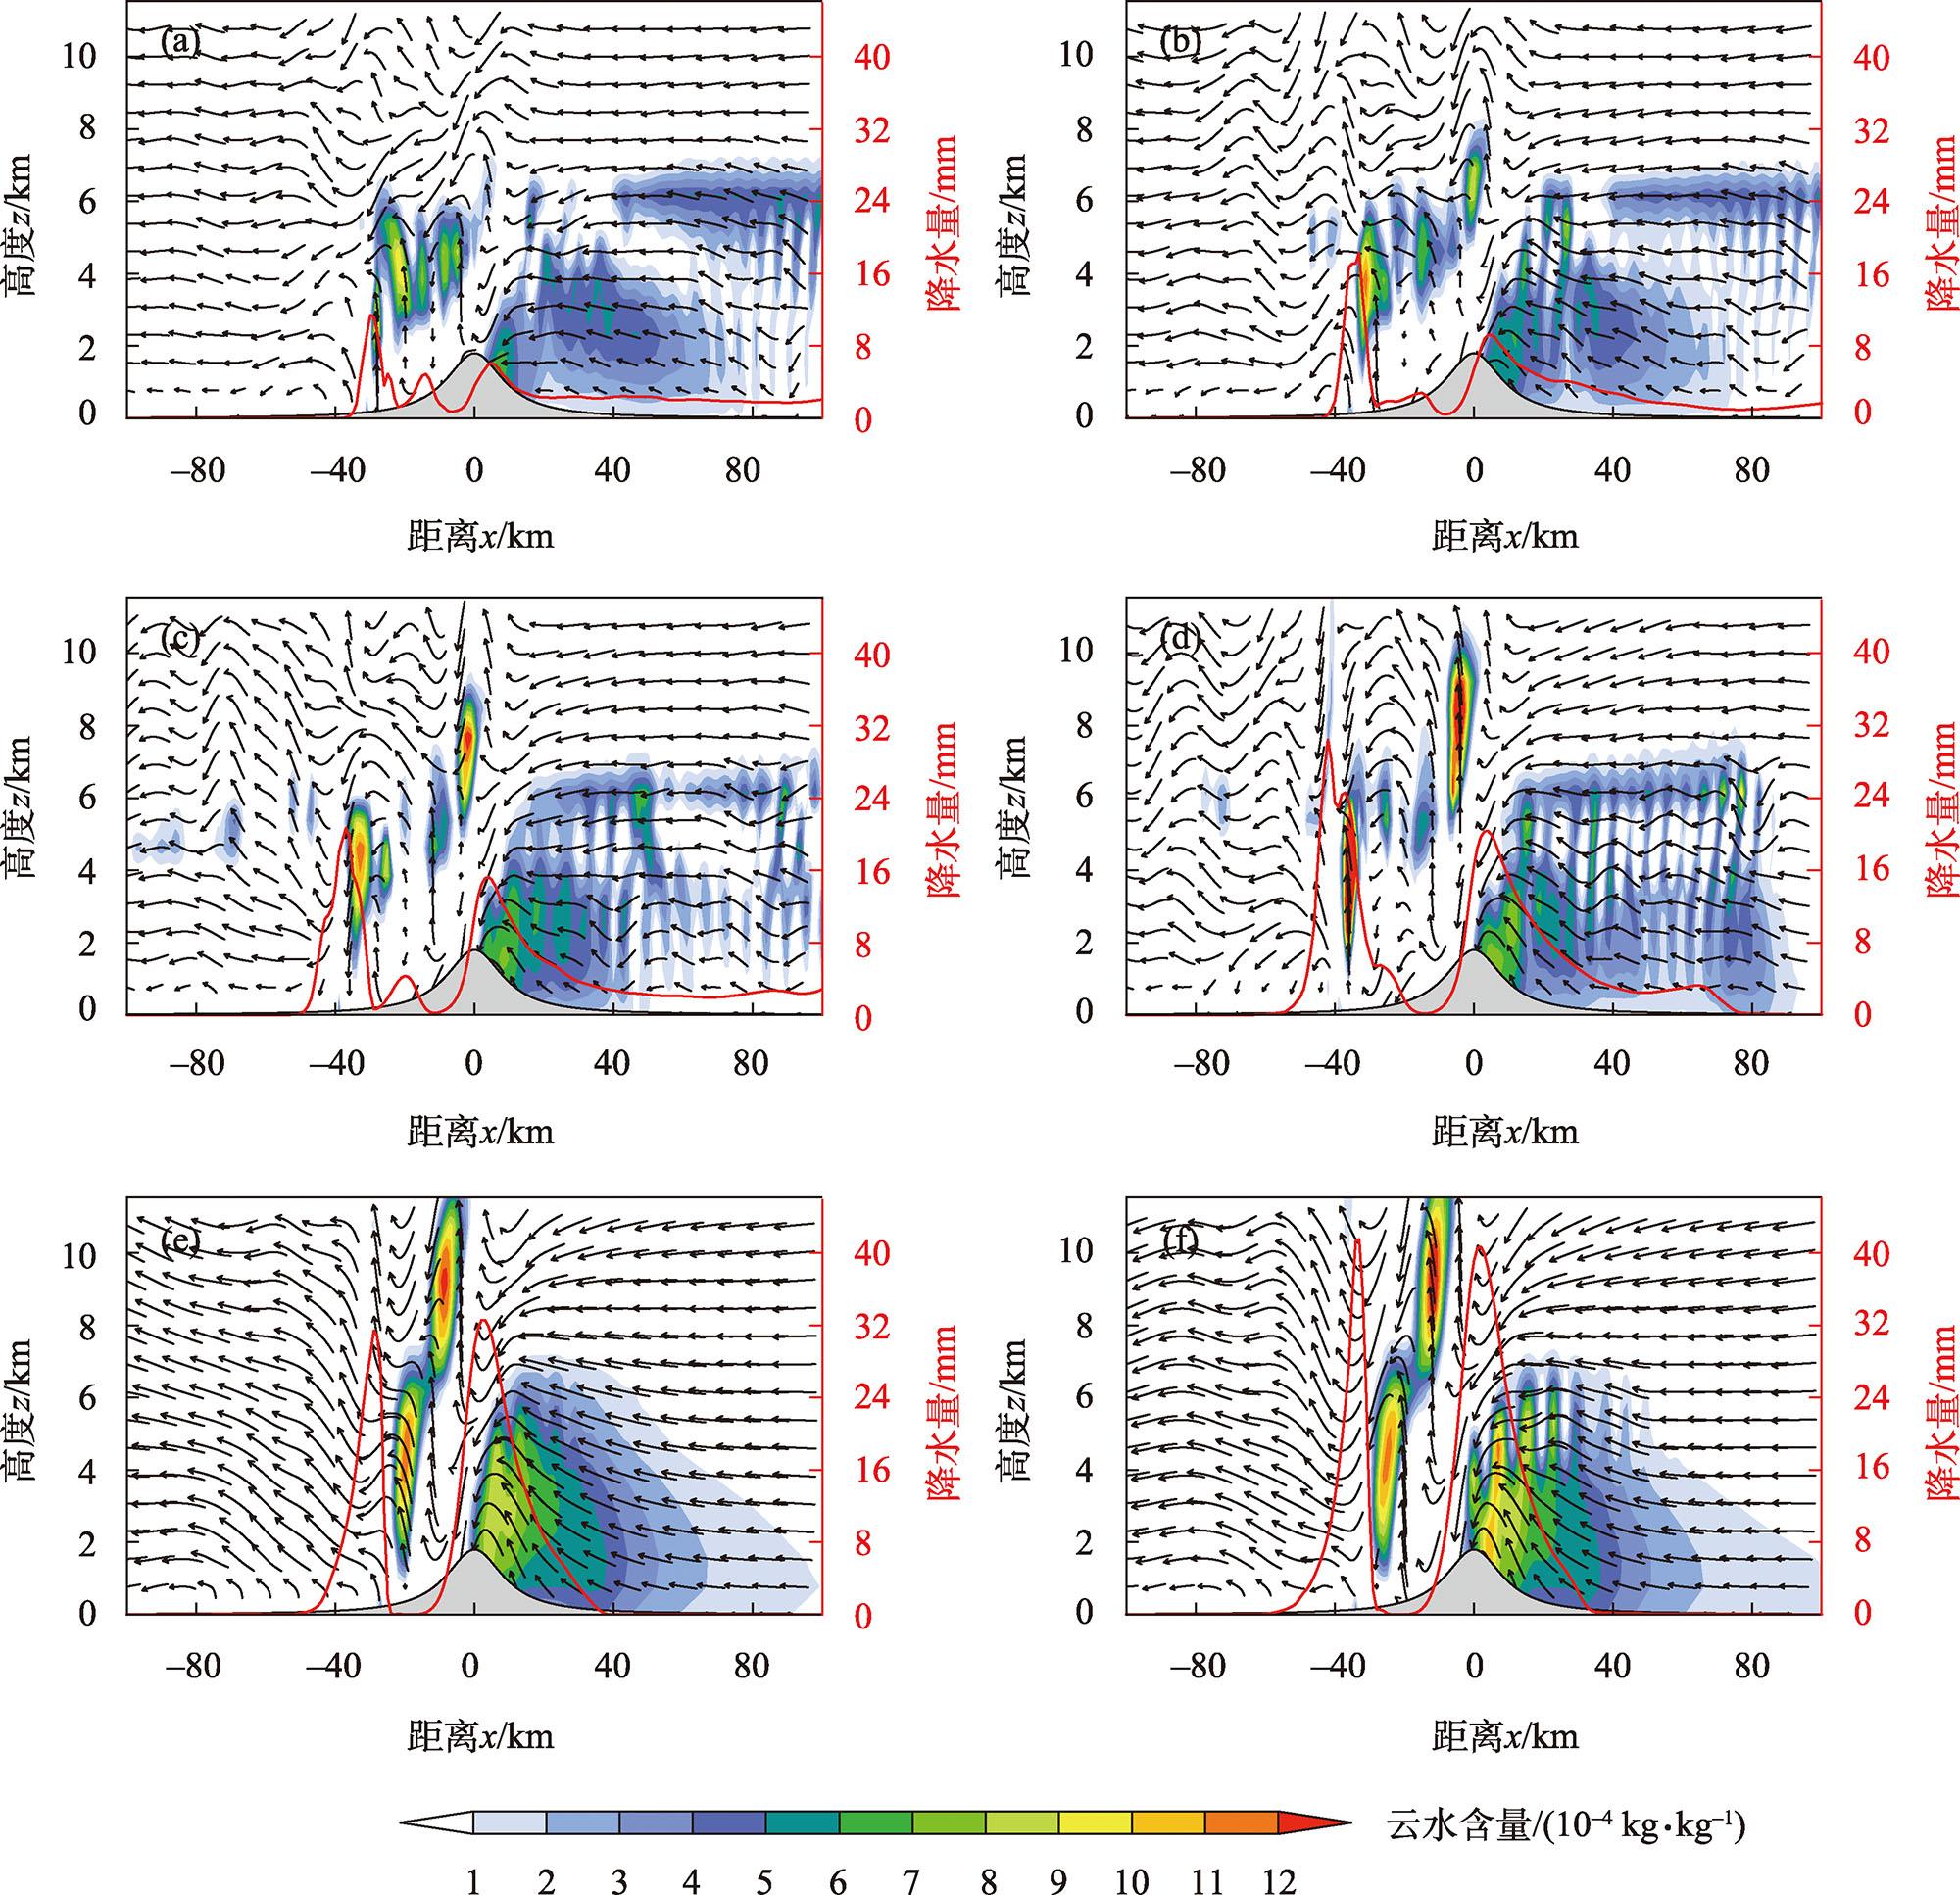
图12 M2试验(a:ushear=-9 m·s-1,b:ushear=-11 m·s-1,c:ushear=-13 m·s-1,d:ushear=-15 m·s-1,e:ushear=-17 m·s-1,f:ushear=-19 m·s-1)模拟至第540 min时的云水含量(阴影,单位:10-4 kg·kg-1)与流场(矢量箭头,单位:m·s-1)垂直剖面图及480~600 min内的累积降水量(红色曲线,单位:mm)Fig. 12 Simulated cloud water content (shadow, unit: 10-4 kg·kg-1), flow field (vector arrow, unit: m·s-1) vertical profile at 540 min and accumulated precipitation during 480-600 min (red curve, unit: mm) in M2 experiments (a: ushear=-9 m·s-1, b: ushear=-11 m·s-1, c: ushear= -13 m·s-1, d: ushear= -15 m·s-1, e: ushear= -17 m·s-1, f: ushear= -19 m·s-1 ) |
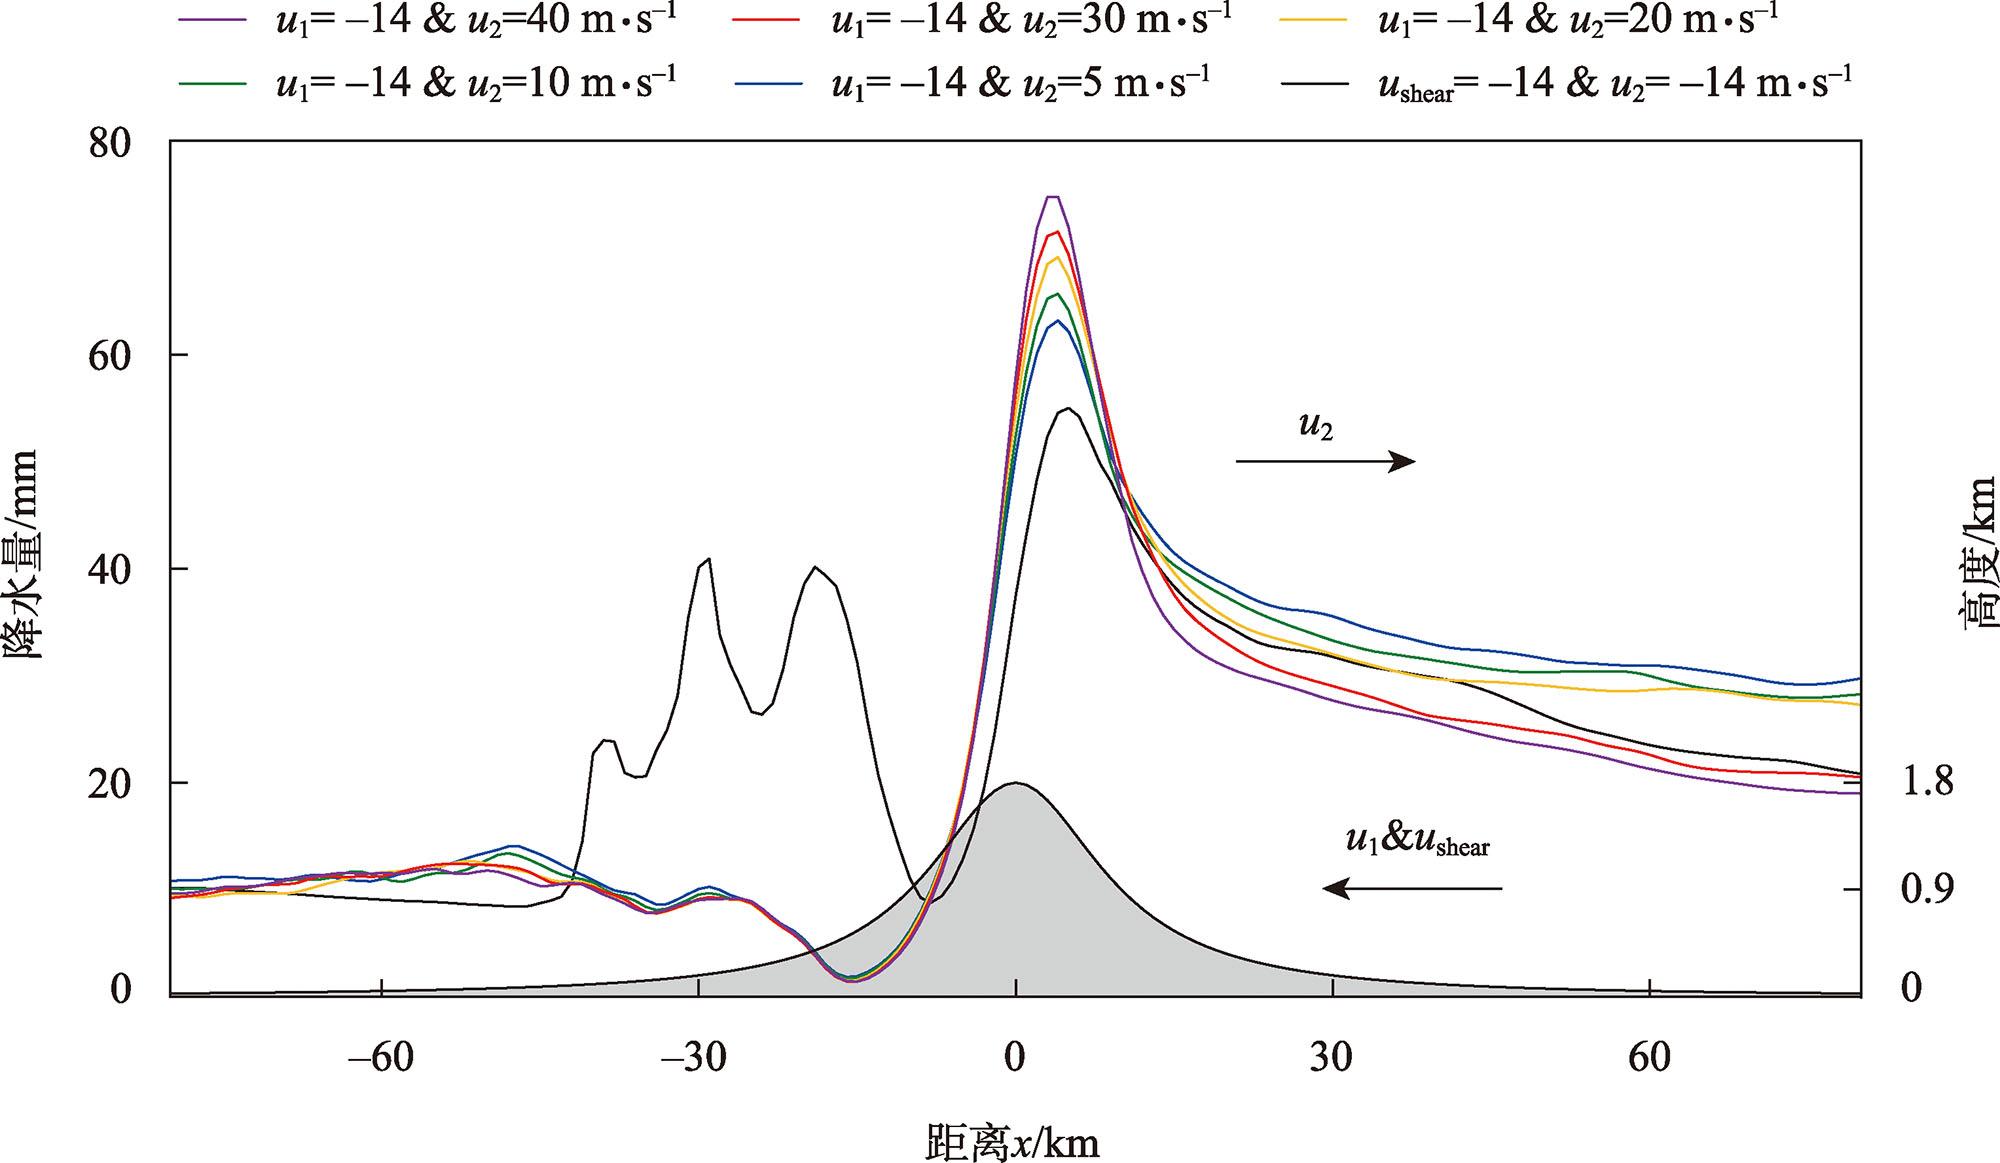
图13 M3试验(u1=-14 m·s-1; u2 =5 m·s-1、10 m·s-1、20 m·s-1、30 m·s-1、40 m·s-1)所模拟的整个时段的累积降水量在山体两侧的分布(单位:mm)Fig. 13 Distribution of accumulated precipitation (unit: mm) on both sides of the mountain in the whole period simulated by M3 experiments(u1= -14 m·s-1 and u2 = 5 m·s-1, 10 m·s-1, 20 m·s-1, 30 m·s-1, 40 m·s-1) |
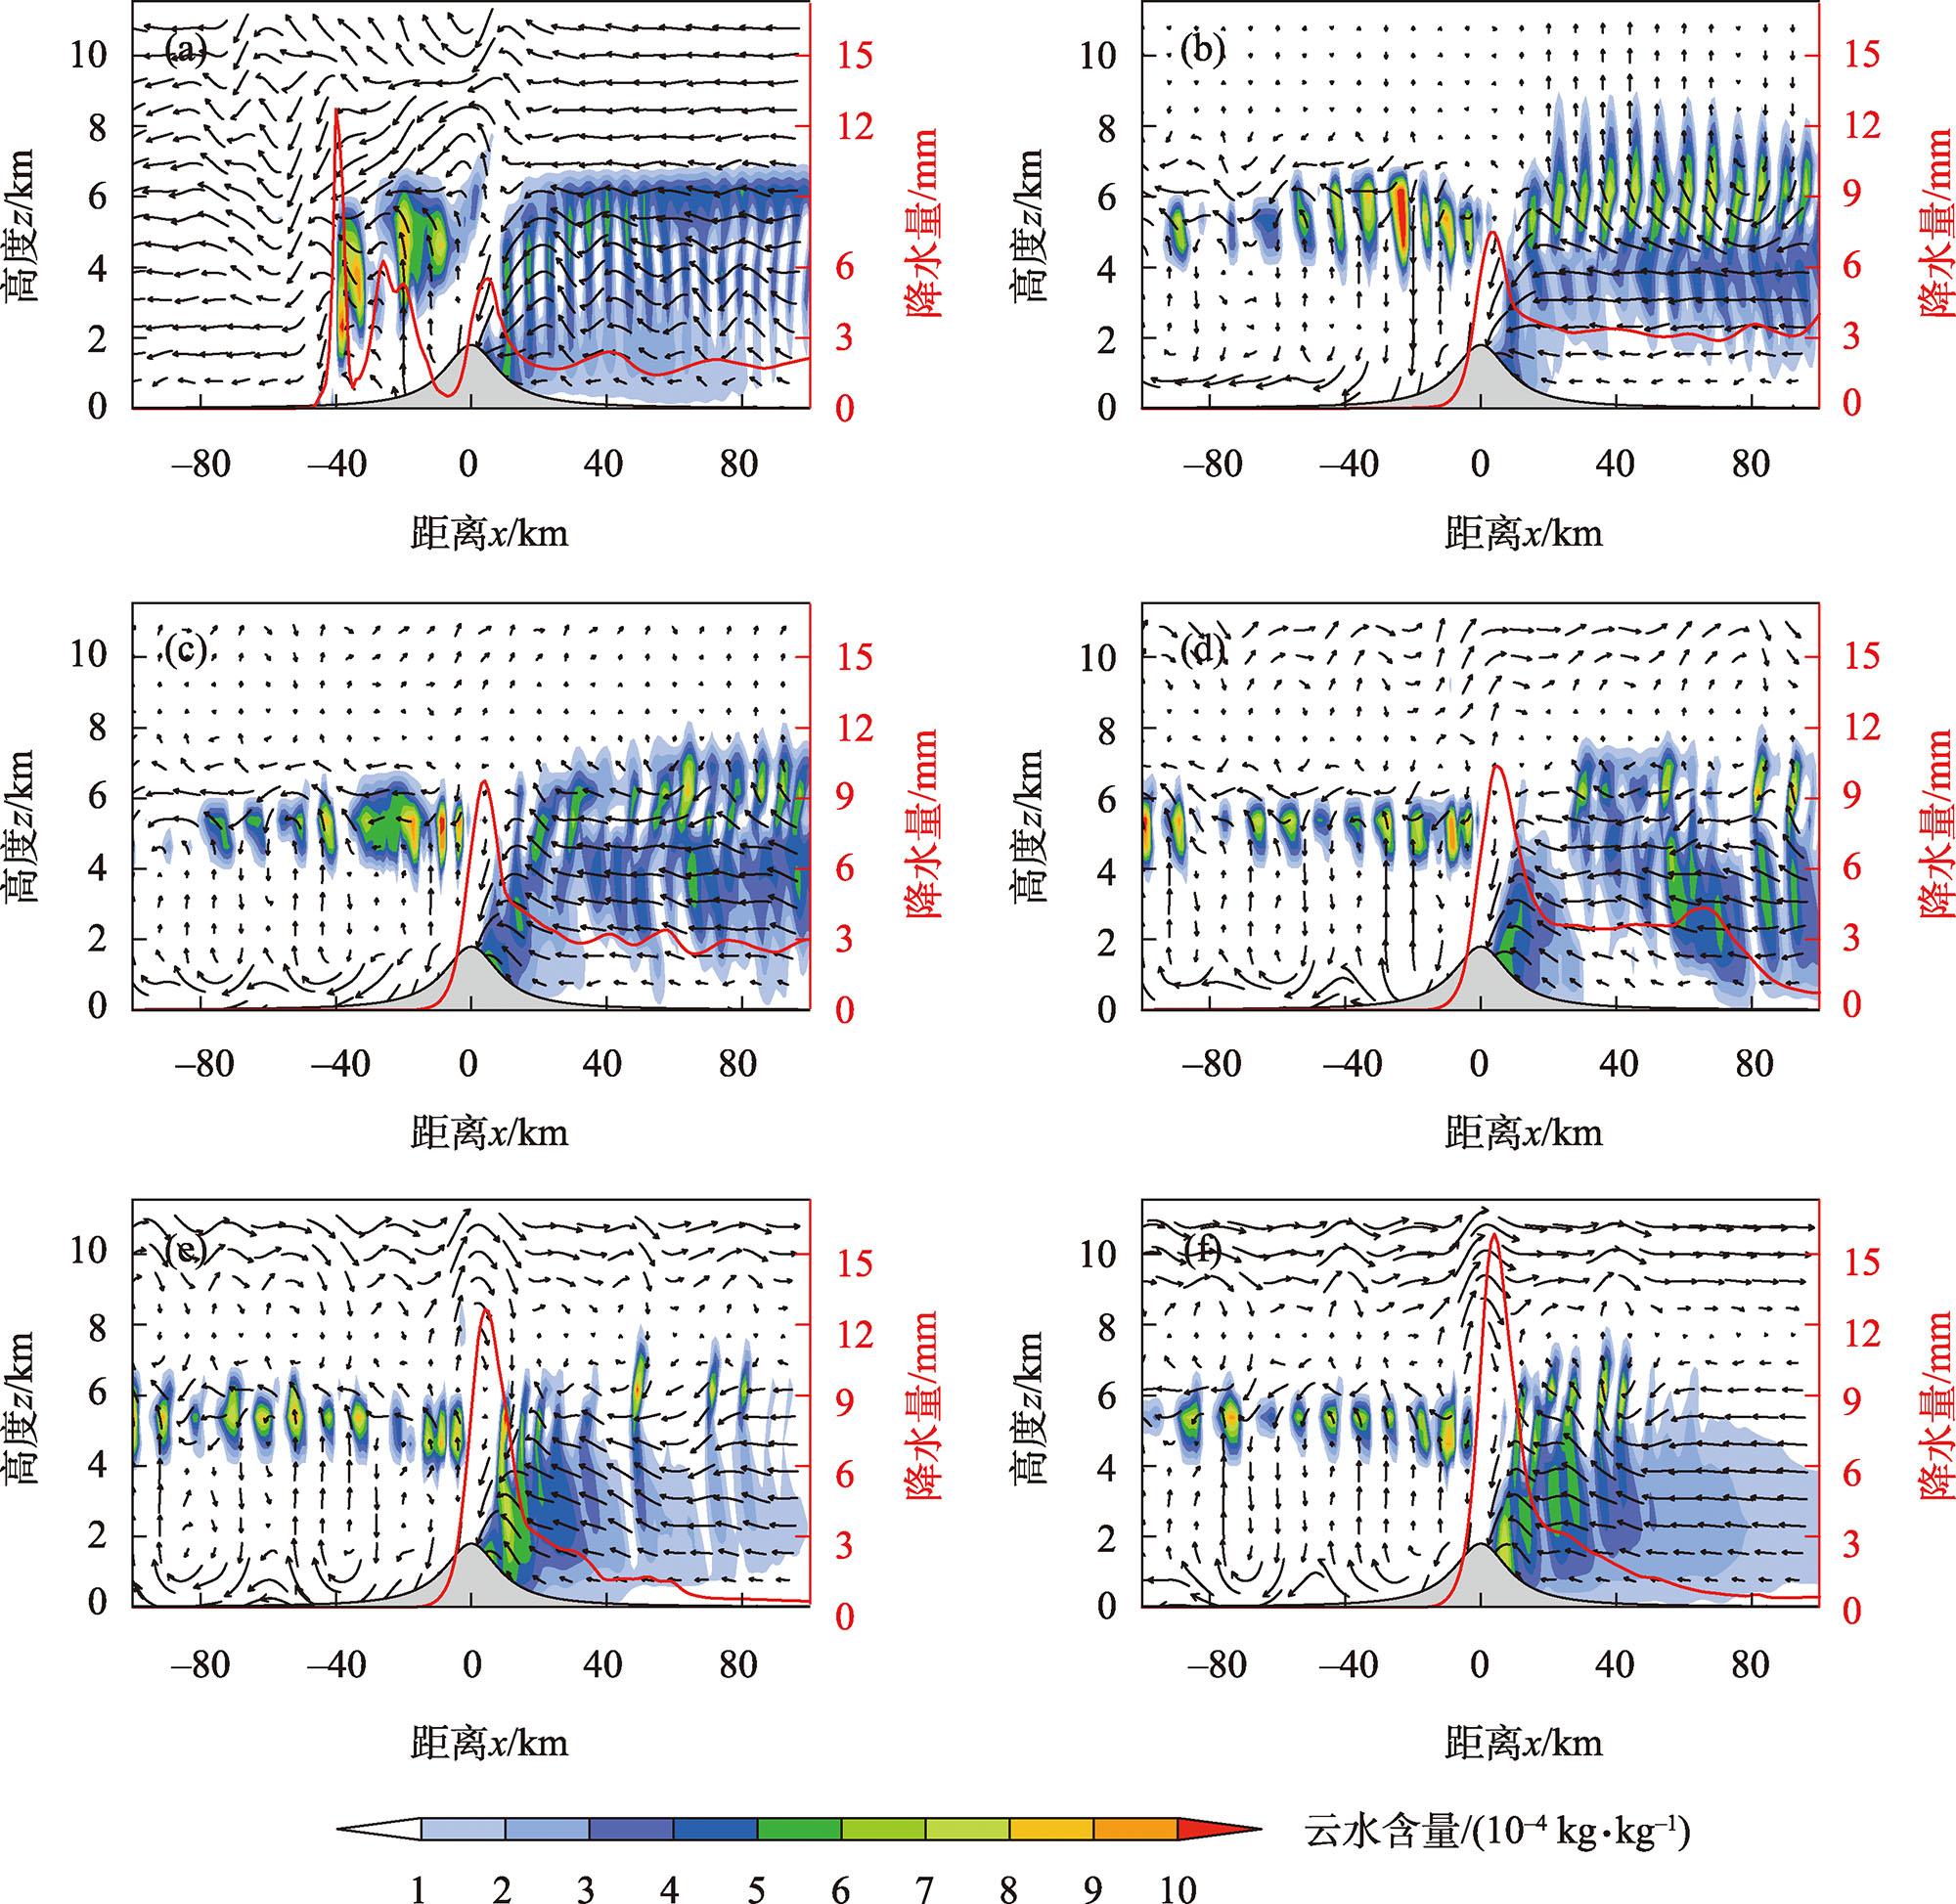
图14 M3试验(u1=-14 m·s-1; u2=5 m·s-1(b), 10 m·s-1(c), 20 m·s-1(d), 30 m·s-1(e), 40 m·s-1(f))模拟至第540 min时的云水含量(阴影,单位:10-4 kg·kg-1)与流场(矢量箭头,单位:m·s-1)垂直剖面图及480~600 min内的累积降水量(红色曲线,单位:mm)注:(a)为M2试验在ushear=-14 m·s-1条件下模拟的对照试验结果。 Fig. 14 Simulated cloud water content (shadow, unit: 10-4 kg·kg-1), flow field (vector arrow, unit: m·s-1) vertical profile at 540 min and accumulated precipitation during 480-600 min (red curve, unit: mm) in M3 experiments (u1= -14 m·s-1; u2= 5 m·s-1(b), 10 m·s-1(c), 20 m·s-1(d), 30 m·s-1(e), 40 m·s-1(f) ) |
| [1] |
|
| [2] |
|
| [3] |
Houze,
|
| [4] |
|
| [5] |
|
| [6] |
黄玉霞, 王宝鉴, 黄武斌, 等. 我国西北暴雨的研究进展[J]. 暴雨灾害, 2019, 38(5): 515-525.
[
|
| [7] |
钟水新. 地形对降水的影响机理及预报方法研究进展[J]. 高原气象, 2020, 39(5): 1122-1132.
[
|
| [8] |
李子良. 地形降水试验和背风回流降水机制[J]. 气象, 2006, 32(5): 10-15.
[
|
| [9] |
|
| [10] |
|
| [11] |
李子良. 三维多层流动过孤立山脉产生的山脉重力波的数值试验[J]. 北京大学学报: 自然科学版, 2006, 42(3): 351-356.
[
|
| [12] |
|
| [13] |
Colle,
|
| [14] |
杨婷, 闵锦忠, 张申龑. 分层气流条件下地形降水的二维理想数值试验[J]. 气象科学, 2017, 37(2): 222-230.
[
|
| [15] |
郭欣, 郭学良, 付丹红, 等. 钟形地形动力抬升和重力波传播与地形云和降水形成关系研究[J]. 大气科学, 2013, 37(4): 786-800.
[
|
| [16] |
|
| [17] |
|
| [18] |
|
| [19] |
|
| [20] |
|
| [21] |
陶林科, 杨侃, 胡文东, 等. “7·30”大暴雨的数值模拟及贺兰山地形影响分析[J]. 沙漠与绿洲气象, 2014, 8(4): 32-39.
[
|
| [22] |
王晖, 隆霄, 温晓培, 等. 2012年宁夏“7·29”大暴雨过程的数值模拟研究[J]. 高原气象, 2017, 36(1): 268-281.
[
|
| [23] |
陈晓娟, 王咏青, 毛璐, 等. 贺兰山区两次极端暴雨动力作用数值模拟分析[J]. 干旱区研究, 2020, 37(3): 680-688.
[
|
| [24] |
陈豫英, 苏洋, 杨银, 等. 贺兰山东麓极端暴雨的中尺度特征[J]. 高原气象, 2021, 40(1): 47-60.
[
|
| [25] |
|
| [26] |
刘晶, 李娜, 陈春艳. 新疆北部一次暖区暴雪过程锋面结构及中尺度云团分析[J]. 高原气象, 2018, 37(1): 158-166.
[
|
| [27] |
赵庆云, 张武, 陈晓燕, 等. 一次六盘山两侧强对流暴雨中尺度对流系统的传播特征[J]. 高原气象, 2018, 37(3): 767-776.
[
|
| [28] |
姜志斌. 贺兰山地区气候变化和极端天气特征分析[D]. 兰州: 兰州大学, 2016.
[
|
| [29] |
|
| [30] |
|
| [31] |
李驰钦, 左群杰, 高守亭, 等. 青藏高原上空一次重力波过程的识别与天气影响分析[J]. 气象学报, 2018, 76(6): 904-919.
[
|
| [32] |
|
| [33] |
|
| [34] |
《西北暴雨》编写组. 西北暴雨[M]. 北京: 气象出版社, 1992.
[ Editorial Group of “Northwest Rainstorm”. Northwest Rainstorm[M]. Beijing: China Meteorological Press, 1992. ]
|
| [35] |
朱乾根, 林锦瑞, 寿邵文, 等. 天气学原理和方法[M]. 北京: 科学出版社, 2007: 320-400.
[
|
| [36] |
李超, 隆霄, 曹怡清, 等. 贺兰山东麓20次暴雨过程环流形势及低空急流特征[J]. 干旱区研究, 2022, 39(6): 1753-1767.
[
|
| [37] |
苏洋, 陈豫英, 杨侃, 等. 低空急流与贺兰山东麓暴雨过程的相关性研究[J]. 气象, 2023, 49(10): 1171-1186.
[
|
| [38] |
曹怡清, 隆霄, 李超, 等. 低空急流对贺兰山东麓两次暴雨影响的数值模拟研究[J]. 干旱区研究, 2022, 39(6): 1739-1752.
[
|
/
| 〈 |
|
〉 |