Weather and Climate

Dust weather changes in Northwest Chinese Cities: Lanzhou as a case study

  • LYU Yanxun ,
  • ZHAO Hongmin ,
  • WANG Xiaojun ,
  • WANG Bin ,
  • MA Zhongwu ,
  • LIU Minlan ,
  • ZHANG Linghui
Expand
  • Gansu Ecological Resources Monitoring Centre (Gansu Forestry Survey and Planning Institute), Lanzhou 730030, Gansu, China

Received date: 2024-02-28

  Revised date: 2024-05-06

  Online published: 2025-08-14

Abstract

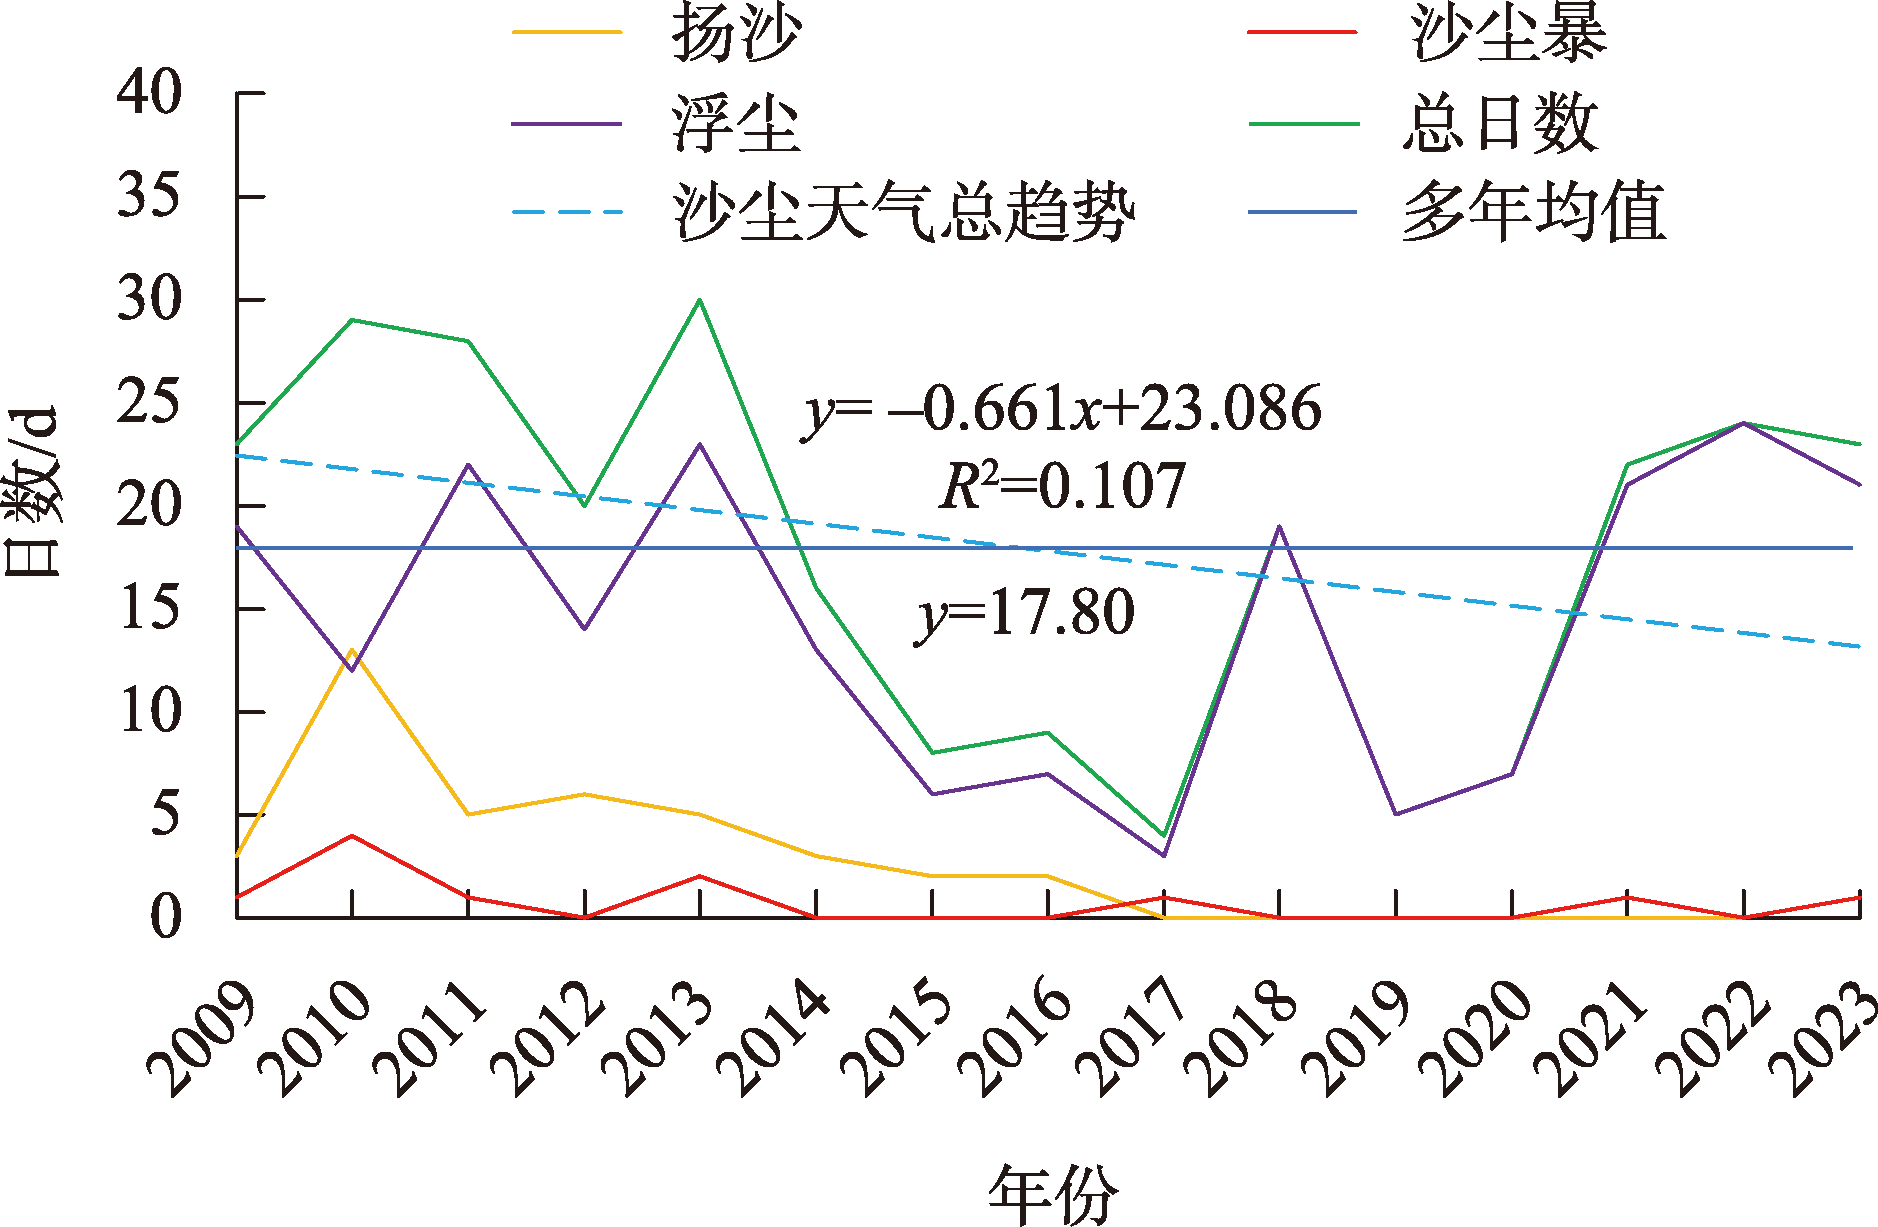
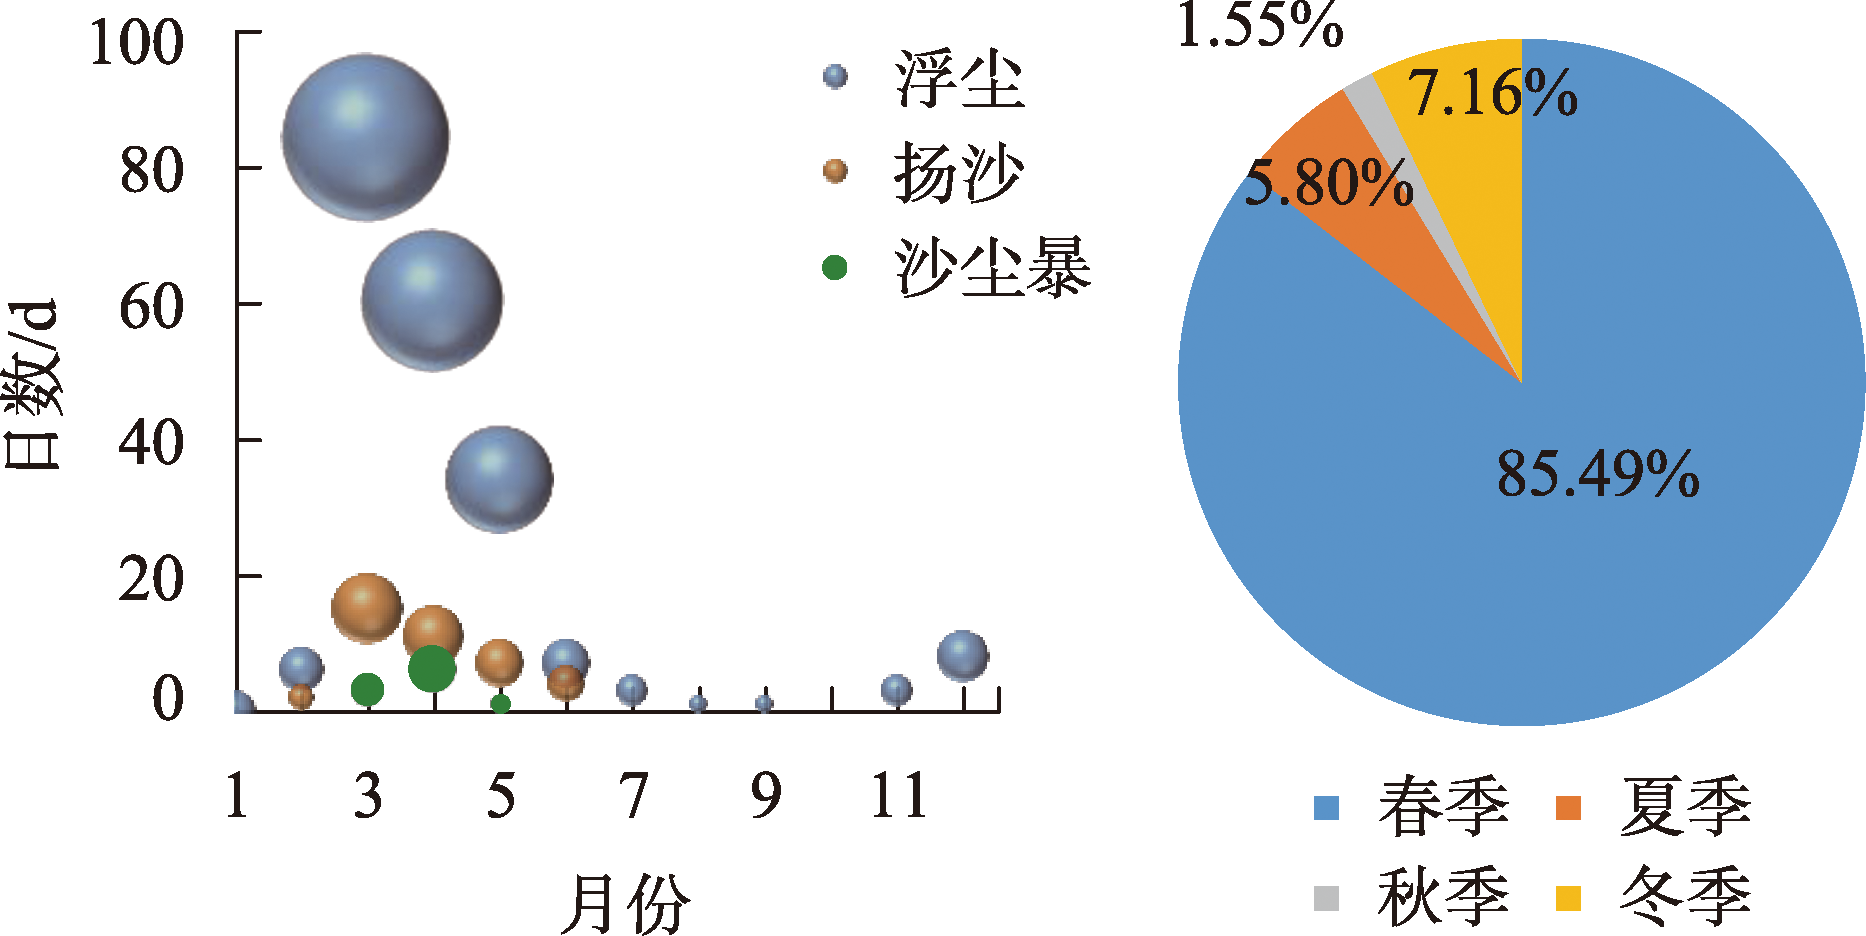
In recent years, many studies on sand and dust storms in Northwest China have mainly focused on large and regional scales, with less research on urban sand and dust storms. This paper studies the changing characteristics of urban sand and dust weather in Lanzhou City to understand the alteration characteristics of urban sand and dust storms. The results showed that (1) The number of days of floating dust, sand lifting, and dust storms in Lanzhou City from 2009 to 2023 showed multisegment fluctuation; the change at the time series level as a whole and the total number of days of sand and dust weather showed a marginal decrease of 0.66 d·a-1. (2) The sand and dust weather in Lanzhou City was concentrated in the spring, declining monthly after the cliff rises in March, mainly dominated by floating dust, followed by sand and dust storms. (3) The annual average frequency of dusty weather in Lanzhou City from 2009 to 2023 correlated positively with wind speed, which is the main meteorological factor affecting dusty weather, weakly negatively correlated with relative humidity, and no obvious correlation with the rest of the meteorological factors. (4) The number of dusty days occurred in 3-time cycle scales of 2~3 a, 4~7 a, and 8~23 a, revealing a multisegmented nonsignificant fluctuation, of which 8~23 a corresponded to two peaks with the most substantial amplitude, which is the primary cycle of dusty fluctuation.

Cite this article

LYU Yanxun , ZHAO Hongmin , WANG Xiaojun , WANG Bin , MA Zhongwu , LIU Minlan , ZHANG Linghui . Dust weather changes in Northwest Chinese Cities: Lanzhou as a case study[J]. Arid Zone Research, 2024 , 41(7) : 1112 -1119 . DOI: 10.13866/j.azr.2024.07.03
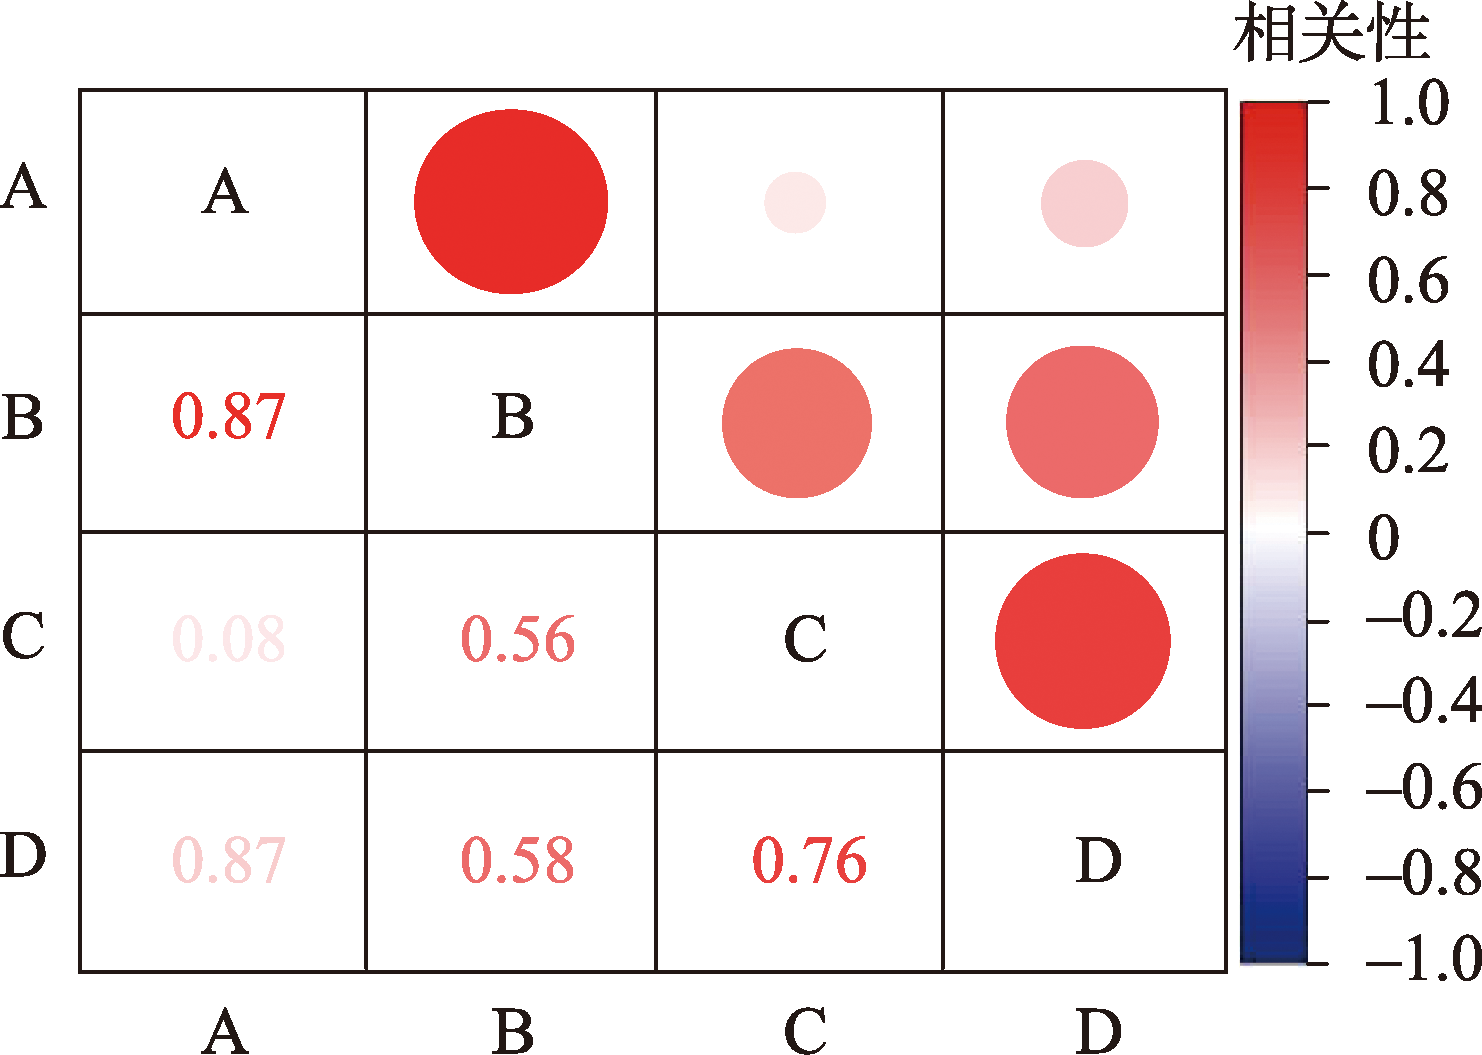
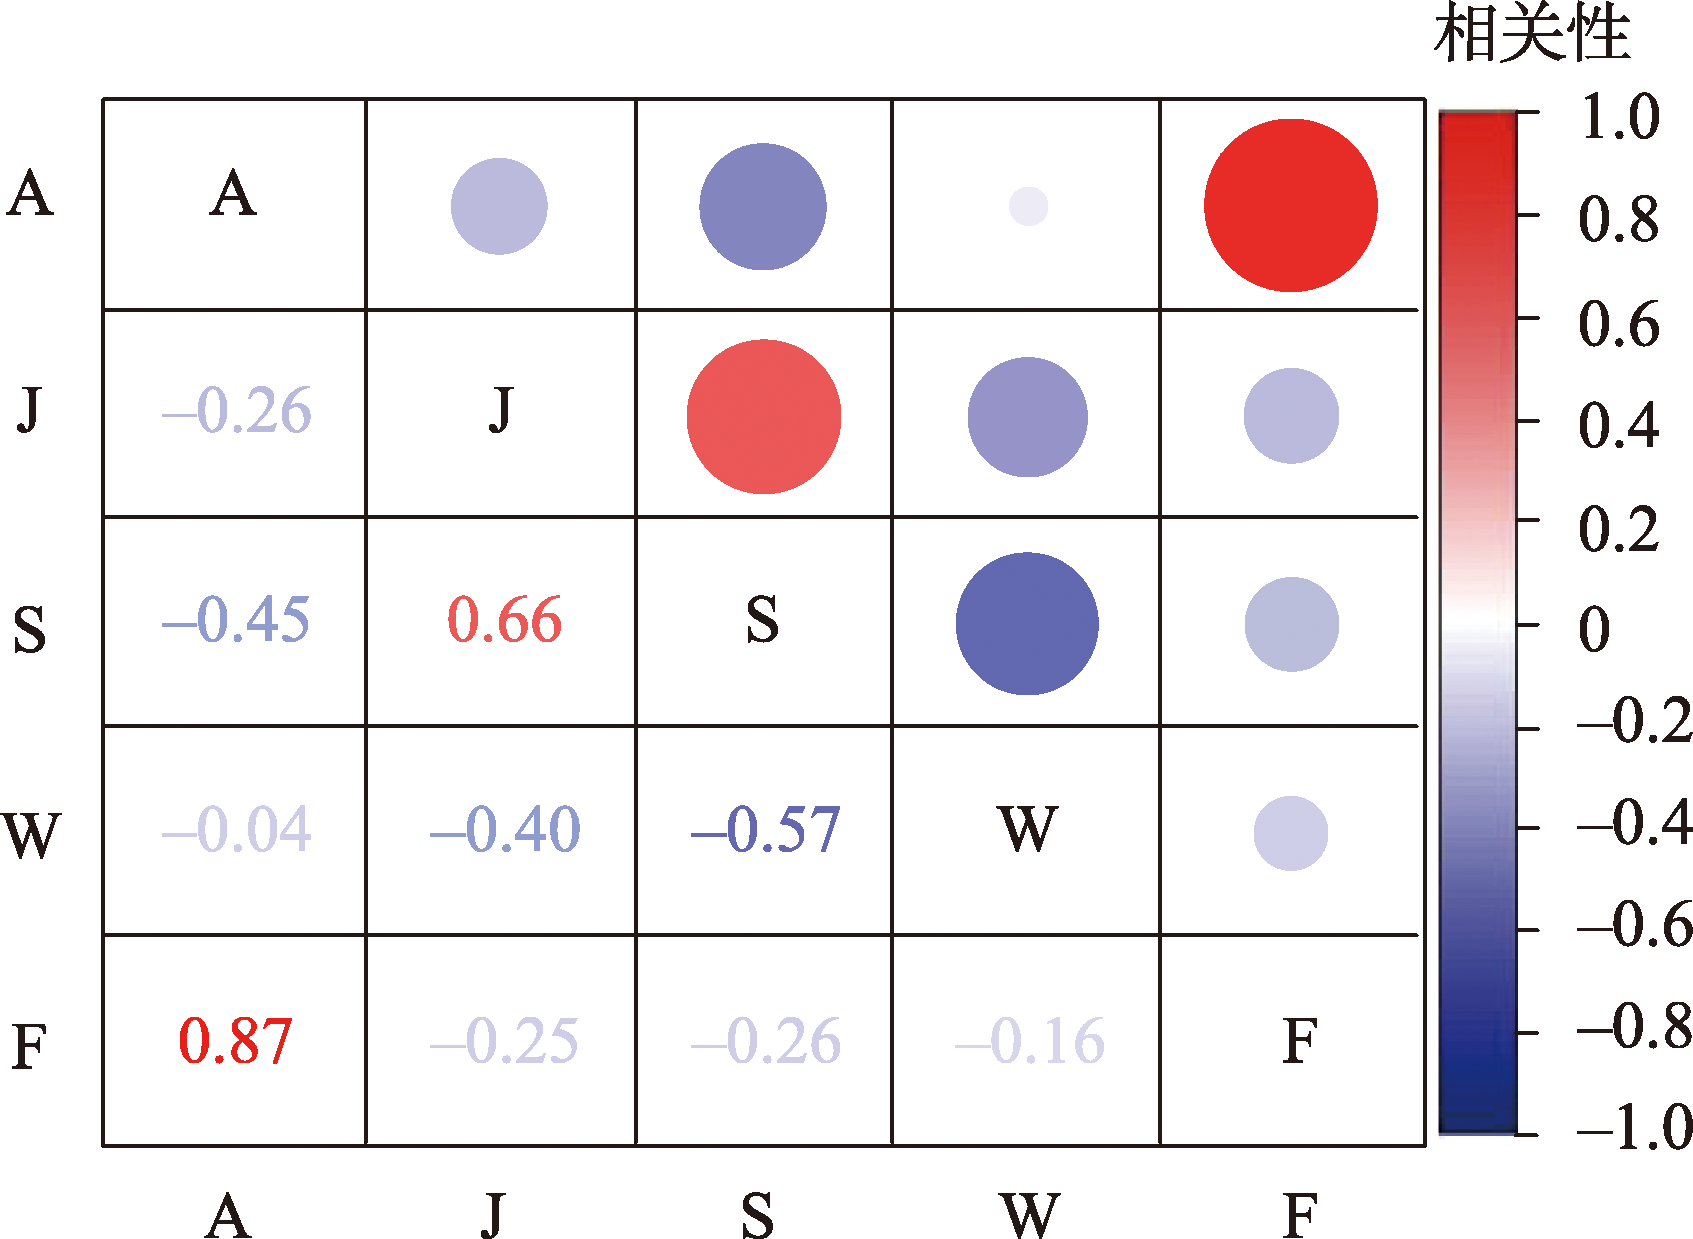
沙尘天气是指风将地面尘土、沙粒卷入空中,使空气混浊的一种天气现象的统称,根据能见度将沙尘天气分为浮尘、扬沙、沙尘暴、强沙尘暴和特强沙尘暴5类,主要发生在沙漠及其临近的干旱、半干旱区,是干旱半干旱地区的灾害性天气,往往能在短时间内造成严重危害,而中国西北地区属于中亚沙尘暴区,是世界上沙尘天气的高发区之一[1-5]。沙尘天气具有突发性、持续时间短、强度高、危害程度高、影响范围广、过程危险性大的特点,特别是强沙尘暴,对人们的生产生活和生态环境造成巨大影响,是一个全球性的生态环境问题[6-9]。因其频次多,能见度低,多发生在春季,破坏工农业设施,造成人畜伤亡,对农作物发芽生长、交通运输、人类生产生活造成严重威胁。更重要的是沙尘气溶胶携带严重破坏环境和空气质量的化学物质,危害人类的身心健康[4]。如2021年的“3·15”一场从蒙古国开始横跨东亚的强沙尘暴,造成了近10 a来最强、范围最广的沙尘暴天气,影响了中国12个省,受灾面积超过3.8×10⁷ km2,造成直接经济损失超过3.0×10⁸[10-11]。尽管近年来中国荒漠化防治取得了重大进展,但与中国接壤的蒙古国近90%的国土面积已成为最重要的外来沙尘源区,沙尘暴频率与20世纪60年代相比几乎增加了4倍,来自蒙古的跨界沙尘约占中国沙尘日数的50%,对中国北方生态安全屏障建设构成严重威胁[12-15]。因此,加强沙尘暴变化特征分析研究已经成为公民关注和国家防灾减灾的重点工作之一[10]
近年来,众多学者对我国西北地区沙尘暴的研究主要集中在区域性沙尘暴分析,对时空分布、发生源地、移动路径和天气气候成因等做了大量研究[10,16]。孔祥吉等[17-18]认为我国北方沙尘天气频次总体呈下降趋势,但部分年份局地强沙尘暴和特强沙尘暴日数增加。康杜娟等[19]认为,中国北方沙尘天气具有明显的年代际变化特征。杨明珠等[20]研究敏感沙尘源区夏季降水对次年春季北方沙尘天气趋势的影响,并在此基础上建立春季沙尘天气趋势的多因子客观预测模型,阐明极端风速大多发生在降雨开始之前或之后,导致强沙尘排放。刘景涛等[21]划分了引起北方沙尘暴的天气系统类型。张增祥等[22]、张杰等[23]研究了沙尘暴与下垫面的关系以及与其他气象要素的关系。陈晓光等[5]确定了甘肃省区域性沙尘暴过程强度标准和单站沙尘暴过程强度标准。Zhou等[24]认为,沙尘强度指数的空间分布与沙尘天气日数基本一致,风也是影响沙尘释放的最重要因素之一。Chen等[15]研究表明2023年3月、4月中国北方沙尘浓度蒙古国贡献超42%等。这些成果虽为了解西北地区区域性沙尘暴提供了很好的依据,但对城市沙尘暴的变化特征以及对居民的影响缺少研究。本文利用2009—2023年国家林草局兰州地面沙尘暴监测站监测资料,分析兰州各类沙尘天气的变化和周期性,以期为政府部门提高预报预警能力、制定防灾减灾政策、降低居民生产生活影响提供一定的理论依据。

1 数据与方法

1.1 研究区概况

兰州位于中国西北部、甘肃省中部,地跨102°36′~104°35′E、35°34′~37°00′N(图1),属温带大陆性气候,年平均气温10.3 ℃,年平均日照时数为2446 h,无霜期为180 d,年平均降水量为327 mm,主要集中在6—9月。东西长165 km,南北宽53 km,地势西部和南部高,东北低,形成峡谷与盆地相间的串珠形河谷。北与武威市、白银市接壤,东与定西市接壤、南与临夏回族自治州接壤,受地理位置、气象条件影响,各地气候差别大,生态环境复杂多样,频繁受沙尘天气影响。
图1 研究区示意图

Fig. 1 Diagram of the study area

1.2 数据来源与处理

本文分析数据包括兰州沙尘暴监测数据与兰州气象数据两部分。兰州沙尘暴监测数据、风速数据源自国家林草局兰州地面沙尘暴监测站,因风速是决定沙尘天气严重程度的主要因素,沙尘天气较年日数少,且监测站点处于市中心,若采用年均风速会造成很大误差,影响研究结果,因此,风速数据采用兰州地面沙尘暴监测站发生沙尘天气当日监测风速,时段为2009—2023年。气象数据包括年均降水量、相对湿度、温度,采用全年数据,来自国家气象局(https://www.cma.gov.cn/)。本文采用常规的气候统计方法对兰州沙尘暴特征进行分析,采用Origin对相关因素之间相关性进行分析,采用Matlab对主要沙尘天气进行突变检验和小波分析,采用GIS、Excel、Origin、Matlab等软件绘图。

1.3 研究方法

本文依据沙尘天气等级(GB/T 20480—2017)标准[25],确定浮尘、扬沙、沙尘暴的界定。因特强沙尘暴出现次数少,15 a仅出现两次,本文研究过程中,将沙尘暴以及更高等级的沙尘天气统称为沙尘暴天气[26]。根据气象观测规范将日界定为北京时间20:00,某一次沙尘暴过程跨越20:00,则按两个出现日计算;如果在同一次天气过程中出现两个或两个以上不同等级沙尘天气,则按照高等级沙尘天气计算;将四季划分为:冬季12月—次年2月,春季3—5月,夏季6—8月,秋季9—11月[27-28]。依据突变检验UFUB两个输出值判断出现突变的时间与范围,UF为标准正态分布,其是按时间序列顺序x1x2,…,xn计算出的统计量序列。UBUF时间顺序上的逆序列统计量。UFUB交点为突变时间点,UF值>0表明趋势上升,反之下降,超出临界线范围表明出现突变的时间区域,UF超过0.05显著性水平线表明趋势更加显著[29]。根据小波分析判断沙尘天气变化周期性。

2 结果与分析

2.1 兰州沙尘天气日数年际变化

对兰州2009—2023年时间序列沙尘天气日数进行相关性分析,沙尘天气总日数与浮尘天气日数呈显著正相关,与扬沙、沙尘暴日数均无明显相关性(图2)。对2009—2023年沙尘天气日数进行分析发现(图3),浮尘、扬沙、沙尘暴日数在2022年、2010年、2010年出最大值,分别为24 d、13 d、4 d,多年平均值为17.80 d;浮尘日数均大于扬沙日数且远大于沙尘暴日数,表明2009—2023年兰州沙尘天气总日数的发生与时间序列无关,主要为浮尘天气,与相关性检验一致。对时间序列水平整体趋势进行分析发现,年浮尘日数在时间序列上呈先增后减再增的趋势,在2013—2017年减幅明显,减幅为1.87 d·a-1,而在2019—2023年增幅明显,增幅1.21 d·a-1;扬沙日数呈先增后减趋势;沙尘暴日数基本稳定。对兰州沙尘天气总日数进行拟合发现,线性关系不明显,呈0.66 d·a-1微弱递减趋势。
图2 2009—2023年兰州各类沙尘天气次数相关性

注:A为沙尘天气总日数;B为浮尘日数;C为扬沙日数;D为沙尘暴日数。

Fig. 2 Correlation of the number of various types dust weather from 2009 to 2023 in Lanzhou

图3 兰州2009—2023年各类沙尘天气日数变化

Fig. 3 Interannual variation of various types dust weather days from 2009 to 2023 in Lanzhou

2.2 兰州沙尘天气月均日数与季节性变化

2009—2023年兰州浮尘日数集中出现在3—5月且明显逐月递减,年均19.78 d·a-1,其中3月出现最大值84 d,8月、9月出现最小值1 d,其余月份出现日数共19 d;扬沙日数集中于3—5月且逐月递减,年均2.20 d·a-1,其中3月出现最大值15 d,2月出现最小值2 d,其余月份未出现扬沙天气;沙尘暴日数集中出现在3—5月,年均0.67 d·a-1,其中4月出现最大值6 d,5月出现最小值1 d,其余月均未发生沙尘暴,表明兰州沙尘天气集中发生在3—5月,主要以浮尘为主,3月断崖式上升后呈逐月递减趋势,此时段内地表植被盖度低,是防范农作物风蚀危害的重要阶段(图4)。从季节变化来看(图5),春季是兰州沙尘天气的高发期,总日数为442 d,占全年85.49%,冬季、夏季、秋季总日数和占比较小,总日数分别为37 d、30 d、8 d,占比分别为7.16%、5.80%、1.55%。
图4 兰州2009—2023年沙尘天气月均日数和季节变化

Fig. 4 Monthly average days and the seasonal variations changes in dusty conditions from 2009 to 2023 in Lanzhou

图5 气象要素与沙尘天气相关性分析

注:A为沙尘天气总日数;J为降水量;S为相对湿度;W为温度;F为当日风速。

Fig. 5 Analysis of the correlation between meteorological elements and dusty weather

2.3 气象要素对沙尘天气的影响

2009—2023年兰州年平均沙尘暴、扬沙、浮尘日数分别为0.73 d、2.67 d、14.40 d,年平均浮尘日数及标准差最大,年平均沙尘暴日数及标准差最小。说明兰州浮尘日数年际波动幅度最大,其次为年扬沙日数、年沙尘暴日数。2009—2023年兰州年平均气温、降水量、相对湿度、发生沙尘天气当日风速平均值分别为8.07 ℃、244.82 mm、55.42%、3.45 m·s-1。因4个气象要素数据量纲不同,因此可用变异系数客观比较年平均气温、降水量、相对湿度和风速的离散程度。年平均气温、降水量、相对湿度、当日风速变异系数分别为0.04、0.31、0.06、1.42,当日风速变异系数最大,与年降水量、气温、年相对湿度变异系数相差较大,年平均气温、相对湿度变异系数较小。说明兰州发生沙尘天气当日风速在年际序列变化幅度较大,年降水量、平均气温、相对湿度在年际之间变化幅度较小(表1)。对沙尘天气总日数与气象要素相关性分析(图6),沙尘天气总日数与当日风速呈显著正相关,与相对湿度呈微弱负相关,与其余要素之间无明显相关性。
表1 2009—2023年兰州沙尘天气气象要素统计

Tab. 1 Statistical of dusty weather and other meteorological elements from 2009 to 2023 in Lanzhou

指标 沙尘天气 气象要素
年沙尘暴日数/d 年扬沙日数/d 年浮尘日数/d 年均气温/℃ 年降水量/mm 年相对湿度/% 当日风速/(m·s-1
平均值 0.73 2.67 14.40 8.70 20.40 55.42 3.45
标准差 1.01 3.54 7.37 0.32 6.34 3.30 4.91
变异系数 1.38 1.33 0.51 0.04 0.31 0.06 1.42

注:变异系数无单位。

图6 浮尘日数突变检验

Fig. 6 Test for sudden changes in the number of floating dust days

2.4 主要沙尘天气日数突变检验及小波分析

采用M-K趋势检验法验证2009—2023年兰州浮尘天气日数变化趋势及其在置信水平α=0.05下的显著性,浮尘天气日数M-K趋势检验Zc值(-0.13)小于0且绝对值小于值1.96,说明兰州浮尘天气日数在2009—2023年时间序列均呈不显著减小趋势,符合线性趋势结果,趋势检验结果可靠。由浮尘日数突变检验图可知(图7),浮尘日数突变年份出现在2009年、2013年、2022年、2023年,其中2011—2014年趋势上升,2009—2011年、2014—2023年趋势下降,显著性均呈多段不显著波动趋势。运用小波分析对兰州近15 a时间序列的浮尘日数周期特征进行分析,表明兰州浮尘日数变化周期存在2~3 a、4~7 a、8~23 a 3种时间周期尺度(图7a),其中,8~23 a周期对应两个峰值,振幅最强,是浮尘变化的主周期,4~7 a为第二周期,2~3 a为第三周期,3个周期共同影响兰州浮尘日数时间序列变化(图7b)。
图7 浮尘日数小波分析

Fig. 7 Wavelet analysis of the number of floating dust days

3 讨论

本文分析了兰州各类沙尘天气的变化情况,发生日数的月份、季节性变化特征、影响沙尘天气程度的主要气象要素,以及主要沙尘天气日数突变检验和周期性,是了解城市沙尘天气状况,提高预警能力、制定防灾减灾政策、降低居民生产生活影响的基础性工作。然而城市沙尘天气的监测过程也会受到其他因素的影响,例如,工业生产排放的工业废气、汽车等排放的尾气、工程作业产生的灰尘等,这些因素同样在一定程度上会造成或者加重浮尘现象[30]。不同因素造成的危害程度不同,如工业污染携带的化学物质较自然颗粒物对人类健康的危害更严重,在城市沙尘天气研究中如何判断或者将这些因素的影响同自然因素影响区分显得尤为重要。有研究表明[31-33],沙尘气溶胶的存在会影响地面净辐射,进而影响地面空气能量交换的其他组分,对城市沙尘天气研究具有明显的指导意义。原则上可根据能见度资料每小时观测数据和同期的大气环流资料,分析沙尘暴事件的环流背景、气象影响因子、同期的气溶胶光学厚度、颗粒物浓度及移动路径和到达城市上空的沙尘天气各种指标浓度,通过对比监测浓度可计算因其他因素产生的浓度[26]。随着研究的不断深入,沙尘天气监测方法不仅包括传统的地面观测,还包括多源卫星监测,利用大气颗粒物的光谱辐射特征及其与其他环境因子的相对差异,从大气中提取沙尘信息,可弥补地面观测中对沙尘发生、传输、强度变化等监测数据的不足[6,34-35]
研究表明,沙尘天气总日数在整个时间序列上与降水量和温度无明显相关关系,而李红军等[36]研究指出,沙尘天气日数与气温和降水量成反向相关关系,与大风呈显著正相关,这种现象可能是区域位置、治理措施、环境差异共同作用的结果。本文分析过程中发现(图8),将降水量与对应时间序列分时段相关性分析存在明显相关性,2019年以前年沙尘天气日数与降水量无相关关系,2019年以后沙尘天气日数与降水量呈负相关关系(R=0.74),出现这种现象的原因还需进一步研究,有可能是整个时间序列上的某一个影响因素影响能力下降所导致。在沙尘天气月均日数与季节性变化分析过程中发现,兰州沙尘天气集中出现在春季的3—5月,从2月开始断崖式增加,3—5月开始急剧下降,此时段地表植被覆盖度低,正值农作物发芽生长,可为预防作物灾害提供依据。
图8 2019—2023年兰州沙尘天气与降水量变化

Fig. 8 Dusty weather and precipitation changes from 2019 to 2023 in Lanzhou

4 结论

本文通过分析2009—2023年兰州各类沙尘天气的变化情况,发生日数的月份、季节性变化特征、影响沙尘天气程度的主要气象要素以及主要沙尘天气日数突变检验和周期性,主要结论如下:
(1) 兰州2009—2023年浮尘、扬沙、沙尘暴日数在时间序列水平上分别呈先增后减再增、先增后减、基本稳定趋势,且浮尘日数在2013—2017年减幅明显,减幅为1.87 d·a-1,在2019—2023年增幅明显,增幅为1.21 d·a-1。沙尘天气总日数在时间序列水平上整体呈0.66 d·a-1微弱递减趋势。
(2) 兰州沙尘天气集中发生在春季的3—5月,其中3月断崖式上升,后逐月递减。此时段是防范农作物风蚀危害的重要阶段,主要以浮尘为主,年均19.78 d·a-1,其次为扬沙、沙尘暴,年均分别为2.47 d·a-1、0.67 d·a-1,其余月份影响较小。
(3) 2009—2023年兰州年均沙尘天气发生频次与风速呈微弱正相关,是影响沙尘天气的主要气象因子,与相对湿度呈微弱负相关,与其他气象因素无明显相关性。年浮尘日数波动最大,其次为扬沙、沙尘暴。
(4) 浮尘日数突变年份出现在2009年、2013年、2022年、2023年,其中2011—2014年呈上升趋势,2009—2011年、2014—2023年呈下降趋势,显著性均呈多段不显著波动趋势。周期性存在2~3 a、4~7 a、8~23 a 3种时间周期尺度,8~23 a对应两个峰值,振幅最强,是浮尘变化的主周期,4~7 a为第二周期,2~3 a为第三周期,3个周期共同影响兰州浮尘日数时间序列变化。
[1]
秦豪君, 杨晓军, 马莉, 等. 2000—2020年中国西北地区区域性沙尘暴特征及成因[J]. 中国沙漠, 2022, 42(6): 53-64.

DOI

[Qin Haojun, Yang Xiaojun, Ma Li, et al. Characteristics and causes of regional sandstorms in Northwest of China from 2000 to 2020[J]. Journal of Desert Research, 2022, 42(6): 53-64.]

DOI

[2]
杨晓军, 张强, 叶培龙, 等. 中国北方2021年3月中旬持续性沙尘天气的特征及其成因[J]. 中国沙漠, 2021, 41(3): 245-255.

DOI

[Yang Xiaojun, Zhang Qiang, Ye Peilong et al. Characteristics and causes of persistent sand-dust weather in mid-march 2021 over Northern China[J]. Journal of Desert Research, 2021, 41(3): 245-255.]

DOI

[3]
钱正安, 宋敏红, 李万元. 近50年来中国北方沙尘暴的分布及变化趋势分析[J]. 中国沙漠, 2002, 23(2): 10-15.

[Qian Zheng’an, Song Minhong, Li Wanwan. Analyseson distributive variation and forecast of sand-dust storms in recent 50 years in North China[J]. Journal of Desert Research, 2002, 23(2): 10-15.]

[4]
魏桂英, 陈少勇, 张媛文. 腾格里沙漠南缘沙尘暴气候变化特征——以甘肃省景泰县为例[J]. 干旱区研究, 2015, 32(6): 1133-1139.

[Wei Guiying, Chen Shaoyong, Zhang Yuanwen. Sandstorms changing characteristics in the south edge of the tengger desert——Jintai County, Gansu Province as a case study[J]. Arid Zone Research, 2015, 32(6): 1133-1139.]

[5]
陈晓光, 张存杰, 董安祥, 等. 甘肃省沙尘暴过程的划分及统计分析[J]. 高原气象, 2004, 23(3): 374-381.

[Chen Xiaoguang, Zhang Cunjie, Dong Anxiang, et al. Study on intensity standard of regional sandstorm in Gansu Province[J]. Plateau Meteorology, 2004, 23(3): 374-381.]

[6]
Zhou Y, Gao X, Lei J. Characteristics of dust weather in the Tarim Basin from 1989 to 2021 and its impact on the atmospheric environment[J]. Remote Sensing, 2023, 15(7): 1804.

[7]
Zhu B Q, Zhang J X, Sun C. Potential links of gobi, dust, and desertification: A comprehensive understanding from aeolian landform evolution in a middle-latitude desert[J]. Sediment Geology, 2021, 428, 106049.

[8]
JiunnHorng K, TsaiChing L, Joseph K, et al. Asian dust storm events are associated with an acute increase in stroke hospitalization[J]. Journal of Epidemiology and Community Health, 2012, 67(2): 125.

[9]
Karagulian F, Temimi M, Ghebreyesus D, et al. Analysis of a severe dust storm and its impact on air quality conditions using WRF-Chem modeling, satellite imagery, and ground observations[J]. Air Quality, Atmosphere Health, 2019, 12(4): 453-470.

[10]
杨梅, 李岩瑛, 张春燕, 等. 河西走廊中东部春季沙尘暴变化特征及其典型个例分析[J]. 干旱区地理, 2021, 44(5): 1339-1349.

[Yang Mei, Li Yanying, Zhang Chunyan, et al. Variation characteristics of spring sandstorm and its typical case analysis in the middle east of Hexi corridor[J]. Arid Land Geography, 2021, 44(5): 1339-1349.]

[11]
Zhi C Y, Yu W, Yi J Z, et al. Why super sandstorm 2021 in North China[J]. National Science Review, 2022, 9(3): 165-171.

[12]
Zhang K, Gao H W. The characteristics of Asian-dust storms during 2000-2002: From the source to the sea[J]. Atmospheric Environment, 2007, 41(39): 9136-9145.

[13]
Zhang Z H, Huisingh D. Monitoring, control, management and revegetation[J]. Journal of Cleaner Production, 2018, 182(1): 765-775.

[14]
Tana B, Tao G, Banzragch N, et al. Variations in frequency and intensity of dust events crossing the Mongolia-China border[J]. Sola, 2021, 17(1): 145-150.

[15]
Chen S Y, Zhao D, Huang J P, et al. Mongolia contributed more than 42% of the dust concentrations in northern China in march and april 2023[J]. Advances in Atmospheric Sciences, 2023, 40(9): 1549-1557.

[16]
Yang Y Q, Wang J Z, Niu T, et al. The variability of spring sand-dust storm frequency in Northeast Asia from 1980 to 2011[J]. Acta Meteorologica Sinica, 2013, 27(1): 119-127.

[17]
孔祥吉, 王雨, 黄侃, 等. 2021年春季我国沙尘天气发生时空特征分析[J]. 林业资源管理, 2022, 50(3): 117-121.

[Kong Xiangji, Wang Yu, Huang Kai, et al. Spatio-temporal characteristics of dust weather in spring 2021 in China[J]. Forestry Resource Management, 2022, 50(3): 117-121.]

[18]
Gui K, Yao W R, Che H Z, et al. Record-breaking dust loading during two mega dust storm events over northern China in march 2021[J]. Atmospheric Chemistry and Physics, 2022, 22(12): 7905-7932.

[19]
康杜娟, 王会军. 中国北方沙尘暴气候形势的年代际变化[J]. 中国科学: 地球科学 2005, 26(11): 1096-1102.

[Kang Dujuan, Wang Huijun. Interdecadal changes of the climate situation of dust storms in northern China[J]. Scientia Sinica (Terrae), 2005, 26(11): 1096-1102.]

[20]
杨明珠, 竺夏英, 艾婉秀, 等. 中国北方春季沙尘天气气候趋势的多因子客观预测[J]. 科技导报, 2019, 37(20): 19-29.

DOI

[Yang Mingzhu, Zhu Xiaying, Ai Wanxiu, et al. Multi-factor prediction of spring dust weather frequecy in northern China[J]. Science & Technology Review, 2019, 37(20): 19-29.]

[21]
刘景涛, 钱正安, 姜学恭, 等. 中国北方特强沙尘暴的天气系统分型研究[J]. 高原气象, 2004, 23(4): 540-547.

[Liu Jingtao, Qian Zheng’an, Jiang Xuegong, et al. A study on weather types of super severe dust storms in Northern China[J]. Plateau Meteorology, 2004, 23(4): 540-547.]

[22]
张增祥, 周全斌, 刘斌, 等. 中国北方沙尘灾害特点及其下垫面状况的遥感监测[J]. 遥感学报, 2001, 16(5): 377-382, 406.

[Zhang Zengxiang, Zhou Quanbin, Liu Bin, et al. Monitoring of the characters and ground-surface of dust storm area in north China using remote sensing[J]. National Remote Sensing Bulletin, 2001, 16(5): 377-382, 406.]

[23]
张杰, 郭铌, 荻潇泓. 西北地区东部冬季降水与次年沙尘暴发生的关系[J]. 中国沙漠, 2004, 23(5): 87-90.

[Zhang Jie, Guo Ni, Di Xiaohong. Analysis on precipitation in winter and relation with sand days in Northwest region[J]. Journal of Desert Research, 2004, 23(5): 87-90.]

[24]
Zhou Y C, Gao X, Lei J Q. Characteristics of dust weather in the Tarim Basin from 1989 to 2021 and its impact on the atmospheric environment[J]. Remote Sensing, 2023, 15(7): 1021-1027.

[25]
中华人民共和国国家质量监督检验检疫总局, 中国国家标准化管理委员会. 沙尘天气等级(GB/T 20480-2017)[S]. 北京: 中国标准出版社, 2017.

[General Administration of Quality Supervision, Inspection and Quarantine of the People’s Republic of China, Standardization Administration of the People’s Republic of China. Classification of Sand and Dust Weather (GB/T 20480-2017) [S]. Beijing: Standards Press of China, 2017.]

[26]
李亚云, 成巍, 王宁, 等. 塔克拉玛干沙漠和戈壁沙漠春季沙尘暴特征及其气象影响因素对比[J]. 中国沙漠, 2023, 43(4): 1-9.

DOI

[Li Yayun, Cheng Wei, Wang Ning, et al. Comparative study on the characteristic of spring sandstorms and the related meteorological factors of the Taklimakan desert and gobi desert[J]. Journal of Desert Research, 2023, 43(4): 1-9.]

DOI

[27]
中国气象局. 地面气象观测规范[M]. 北京: 气象出版社, 2003.

[China Meteorological Administration. Specification for Surface Meteorological Observation[M]. Beijing: China Meteorological Press, 2003.]

[28]
李玲萍, 李岩瑛, 孙占峰, 等. 河西走廊东部沙尘暴特征及地面气象因素影响机制[J]. 干旱区研究, 2019, 36(6): 1457-1465.

[Li Lingping, Li Yanying, Sun Zhanfeng, et al. Sandstorm and its affecting meteorological factors in East Hexi Corridor[J]. Arid Zone Research, 2019, 36(6): 1457-1465.]

[29]
杜灵通, 宋乃平, 王磊. 气候变化背景下宁夏近50年来的干旱变化特征[J]. 自然灾害学报, 2015, 24(2): 157-164.

[Du Lingtong, Song Naiping, Wang Lei. Characteristics of drought changes in Ningxia from 1960 to 2012 under background of climate change[J]. Journal of Natural Disasters, 2015, 24(2): 157-164.]

[30]
梅静, 王建, 何亮, 等. 川西甘孜州1961—2015年气温和降水时空变化特征研究[J]. 山地学报, 2019, 37(2): 161-172.

[Mei Jing, Wang Jian, He Liang, et al. Spatio-temporal variations of temperature and precipitation in Ganzi of Western Sichuan in China during 1961-2015[J]. Mountain Research, 2019, 37(2): 161-172.]

[31]
《2020年大气环境气象公报》: 全国大气环境继续改善霾日数继续下降[J]. 中国环境监察, 2021, 12(4): 4-5.

[Atmospheric environment and meteorology bulletin 2020: National atmospheric environment continues to improve and the number of hazy days continues to decline[J]. China Environment Supervision, 2021, 12(4): 4-5.]

[32]
Tan Z Y, LiuY Z, Zhu Q Z, et al. Effect of dust aerosols on the heat exchange over the Taklimakan desert[J]. Atmospheric Environment, 2022, 276(4): 215-220.

[33]
杨燕萍, 王莉娜, 杨丽丽, 等. 兰州市沙尘天气污染特征及潜在源区[J]. 中国沙漠, 2020, 40(3): 60-66.

DOI

[Yang Yanping, Wang Lina, Yang Lili, et al. Air pollution characteristics and potential sources in Lanzhou during dust weather[J]. Journal of Desert Research, 2020, 40(3): 60-66.]

DOI

[34]
Meij D A, Bossioli E, Penard C, et al. The effect of srtm and corine land cover data on calculated gas and PM10 concentrations in WRF-Chem[J]. Atmospheric Environment, 2015, 101(2): 177-193.

[35]
Sujitha P R, Santra Priyabrata, Bera A K, et al. Detecting dust loads in the atmosphere over thar desert by using MODIS and INSAT-3D data[J]. Aeolian Research, 2022, 57(12): 1009-1016.

[36]
李红军, 李军, 何清. 新疆沙尘暴的趋势和突变研究[J]. 中国沙漠, 2008, 28(5): 915-919.

[Li Hongjun, Li Jun, He Qing. Study on sandstorm trend and abrupt change in Xinjiang[J]. Journal of Desert Research, 2008, 28(5): 915-919.]

Outlines

/