
Evolution characteristics of spatial and temporal distribution pattern and driving force analysis of reservoirs in the economic zone on the north slope of Tianshan Mountains
Received date: 2024-04-19
Revised date: 2024-06-03
Online published: 2025-08-13
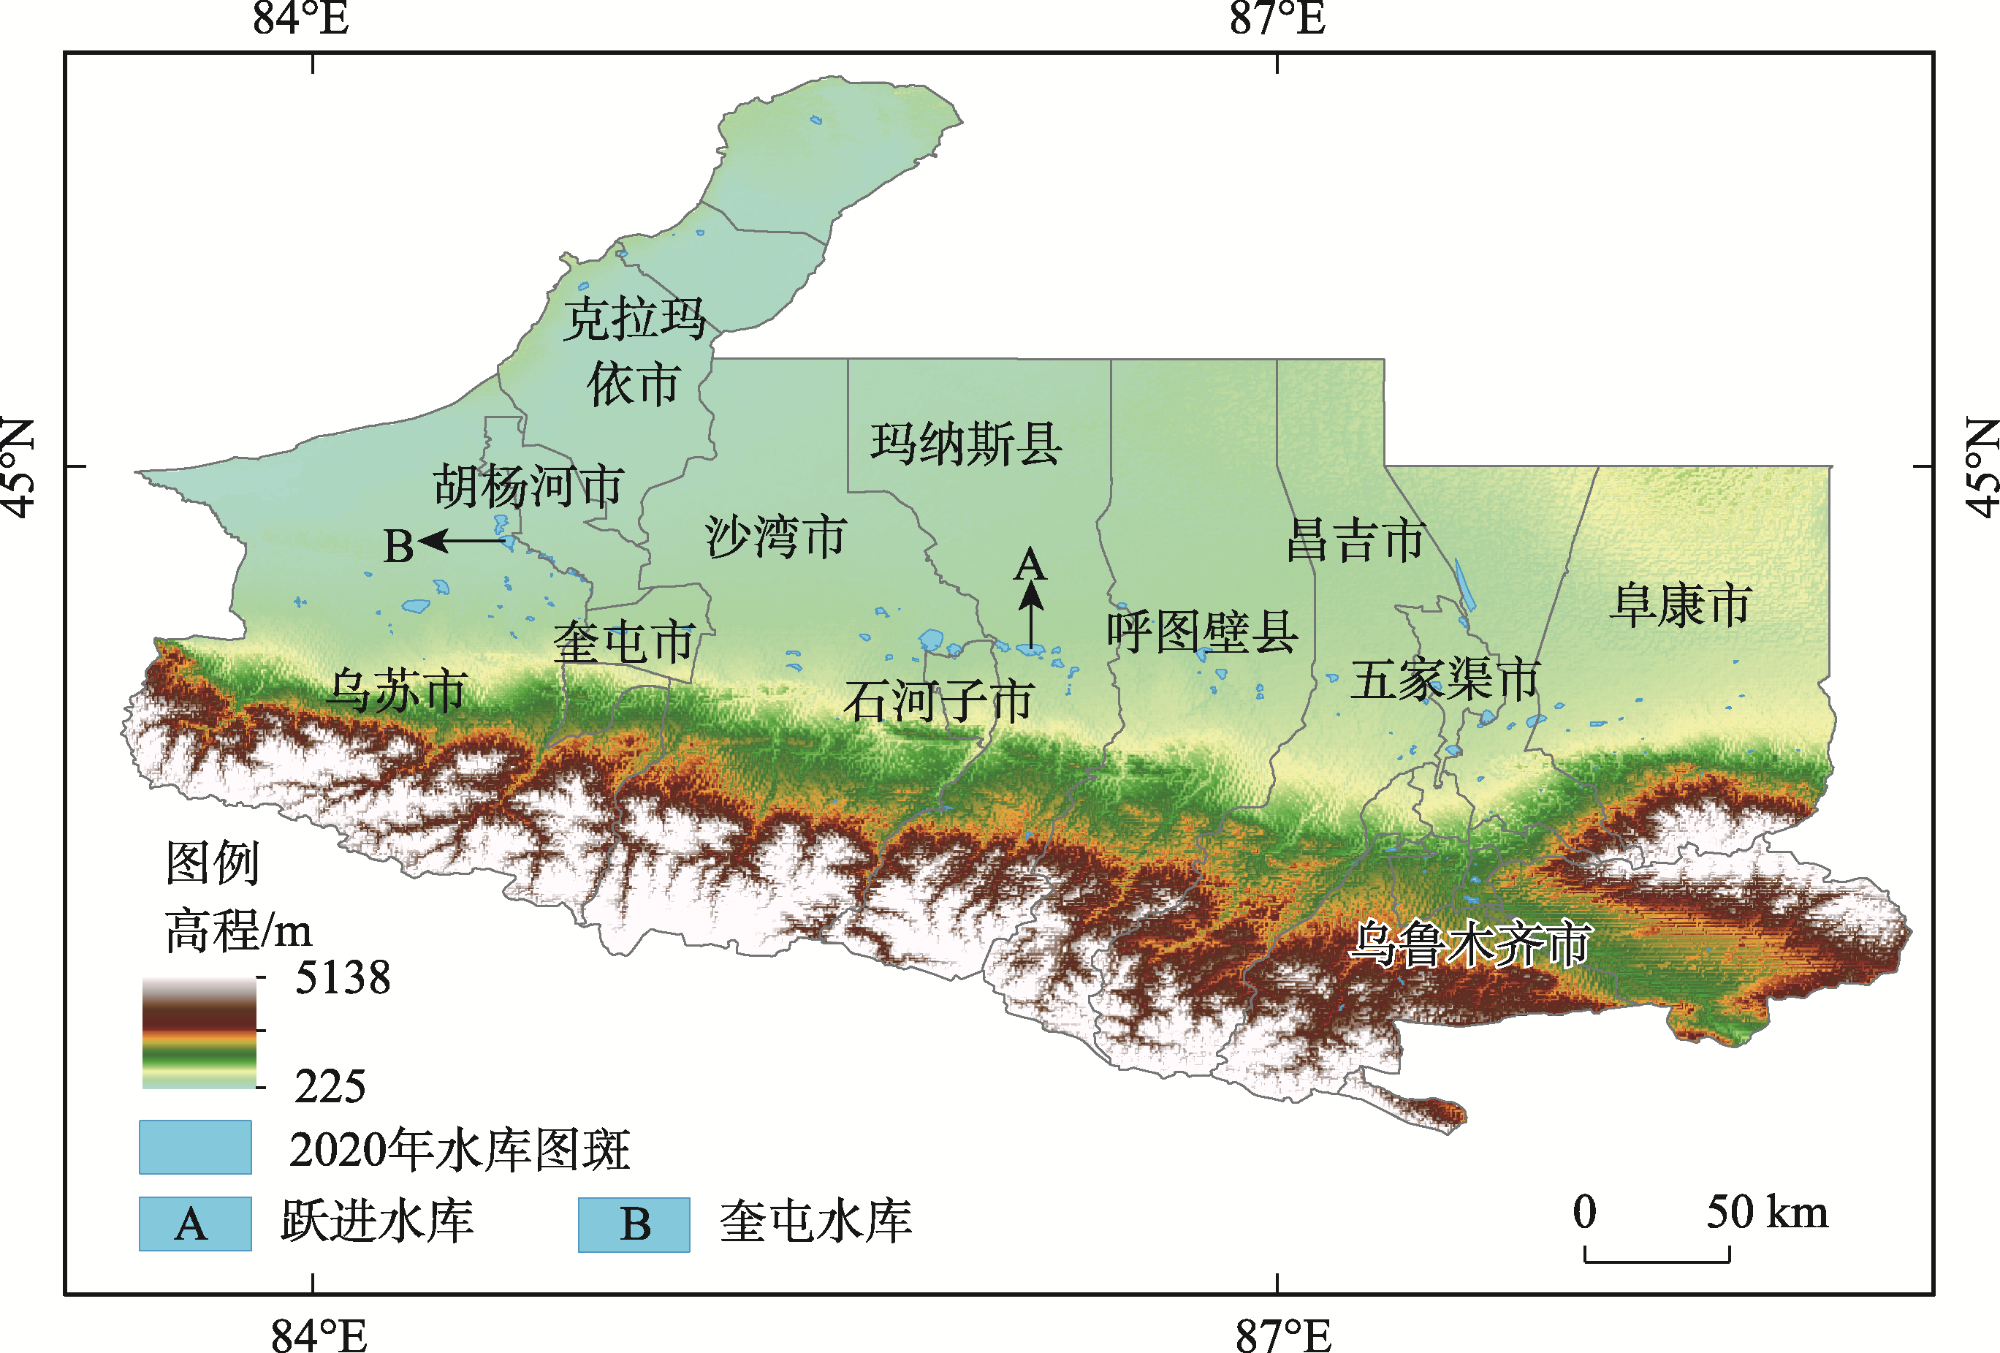
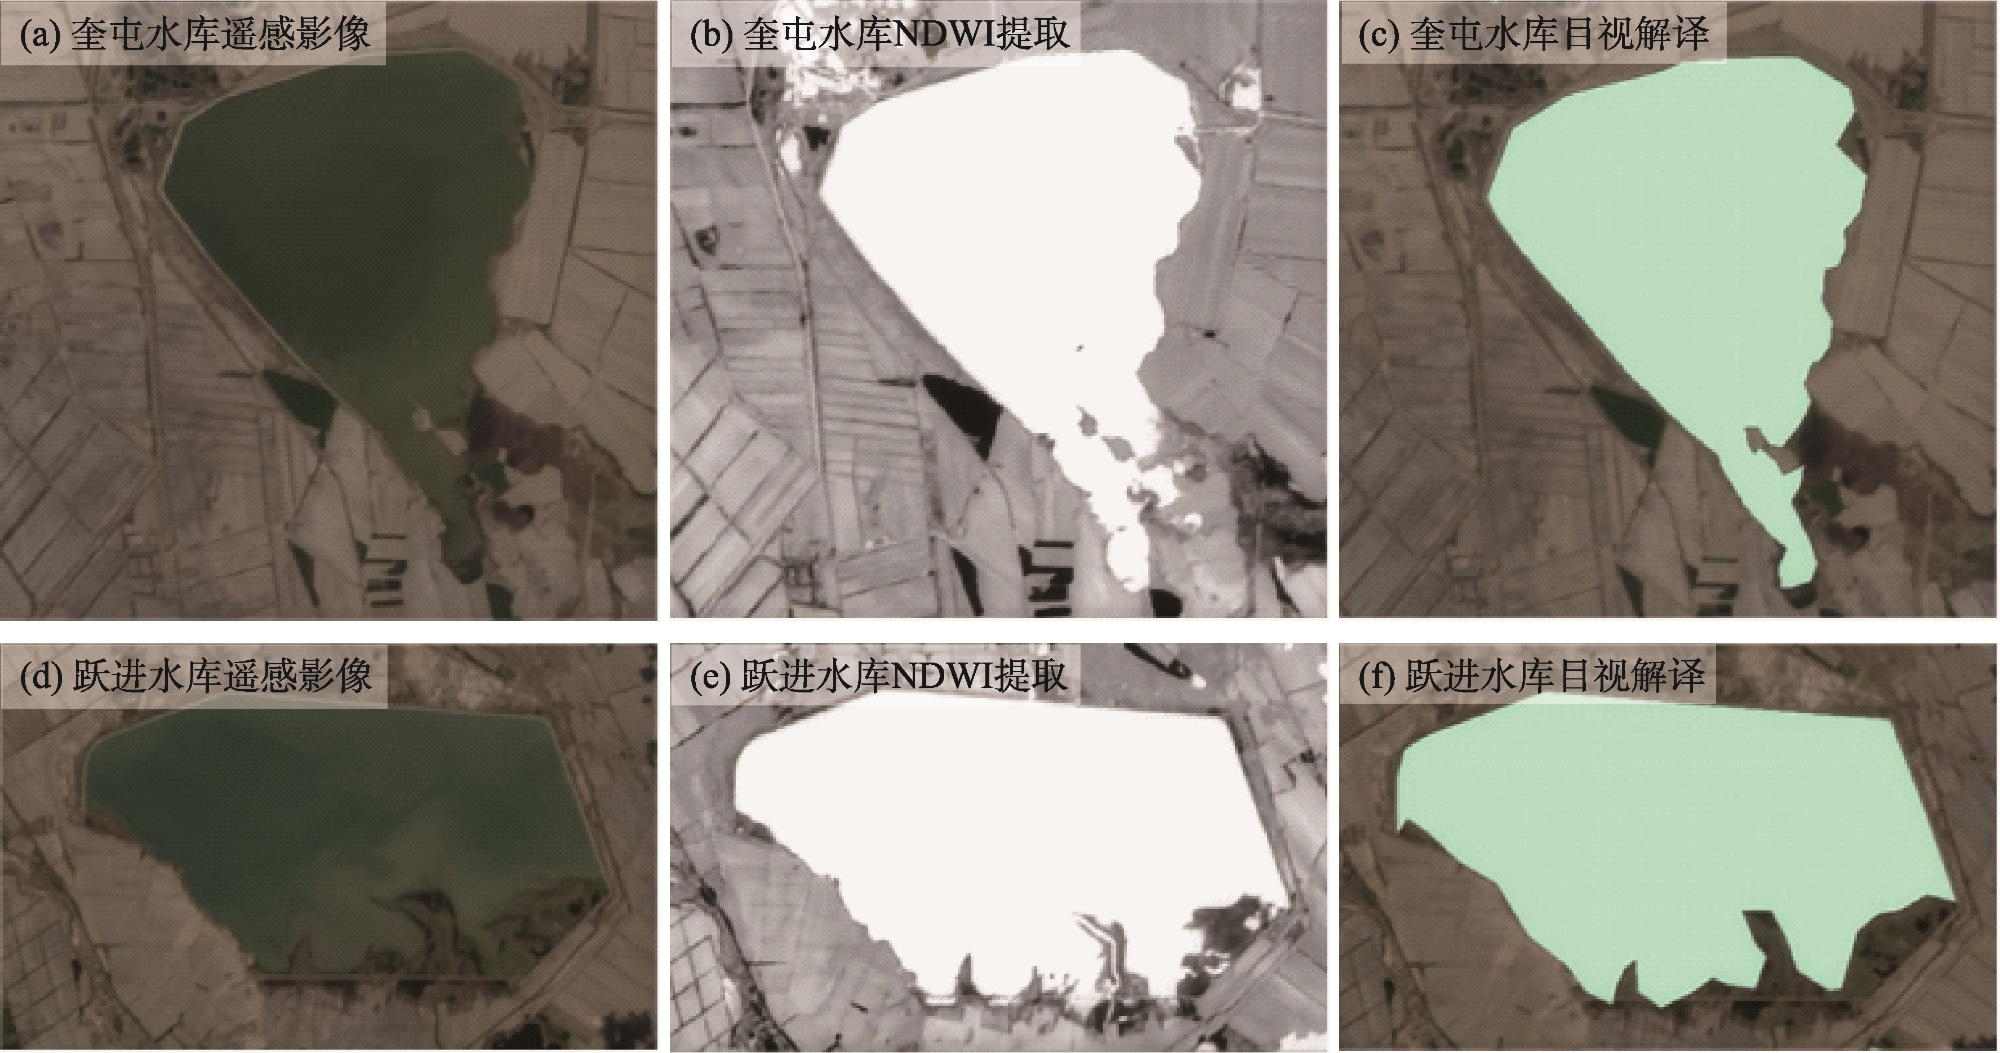
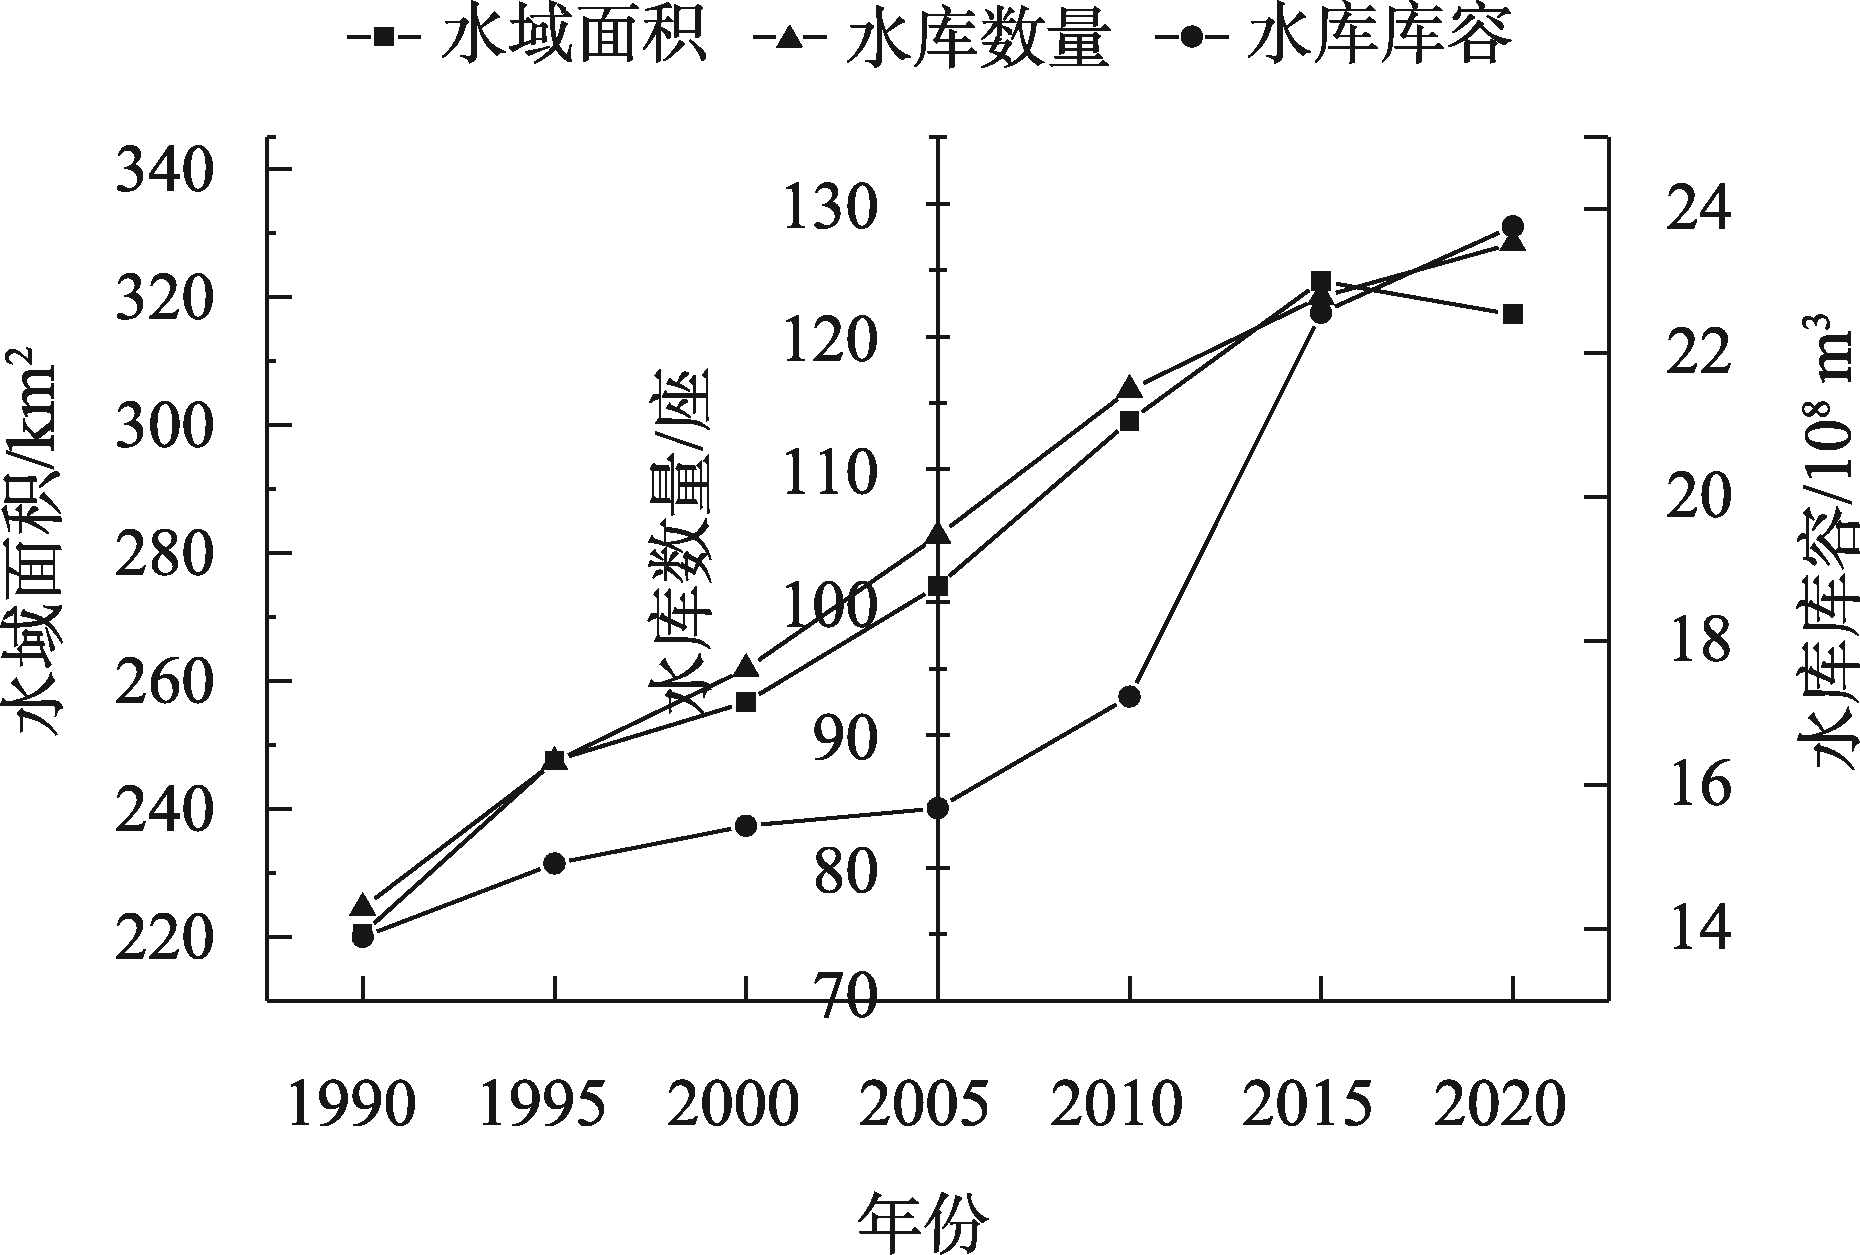
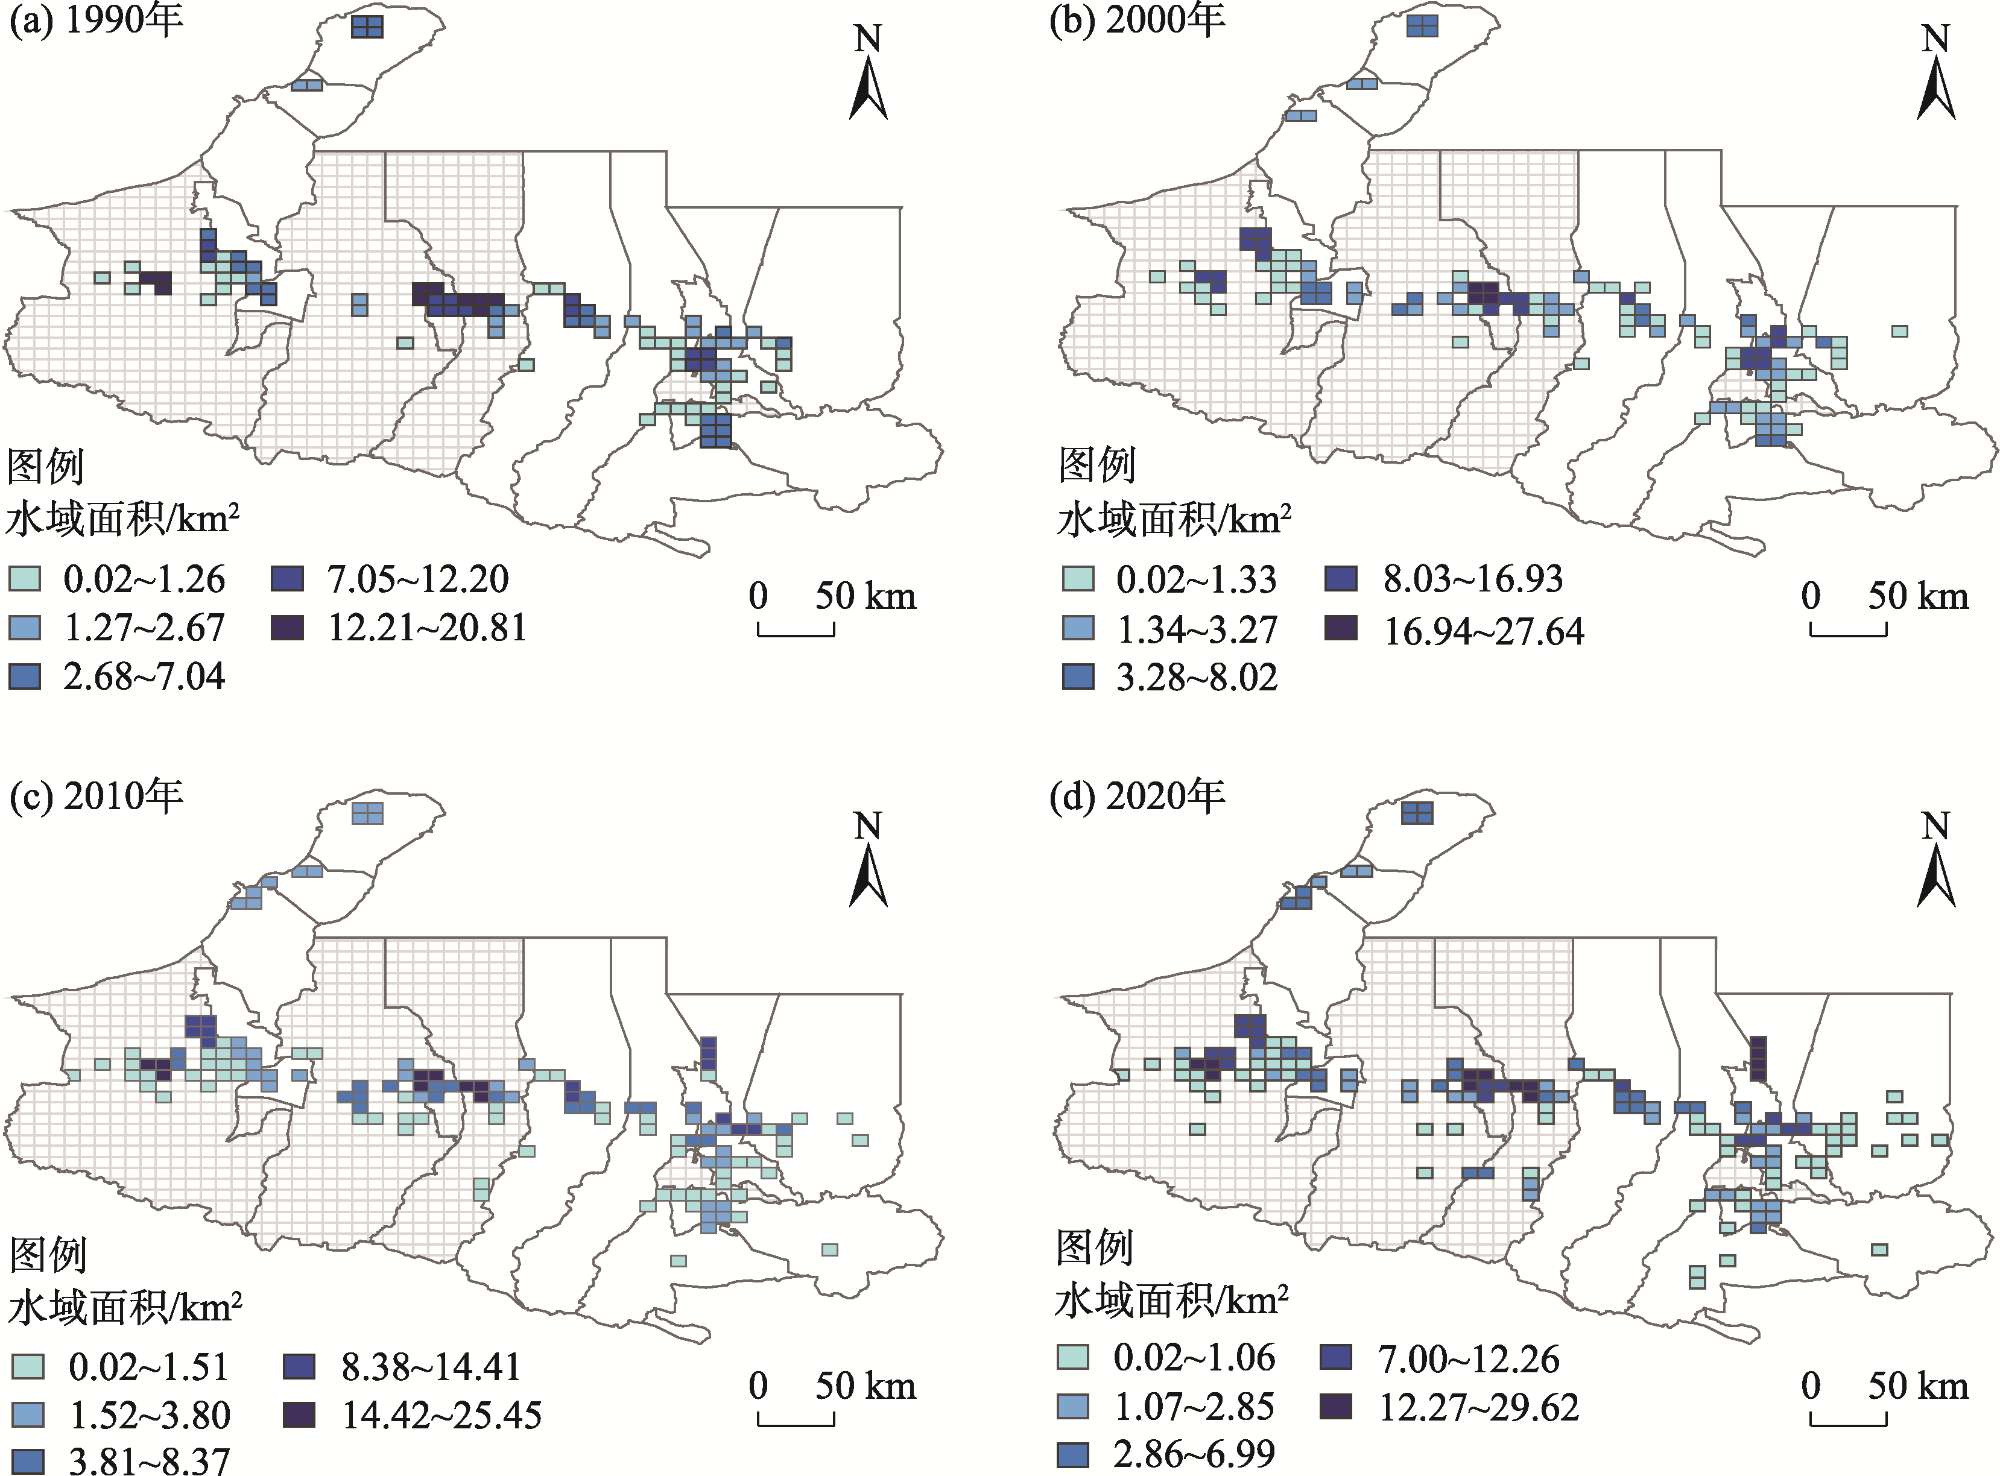
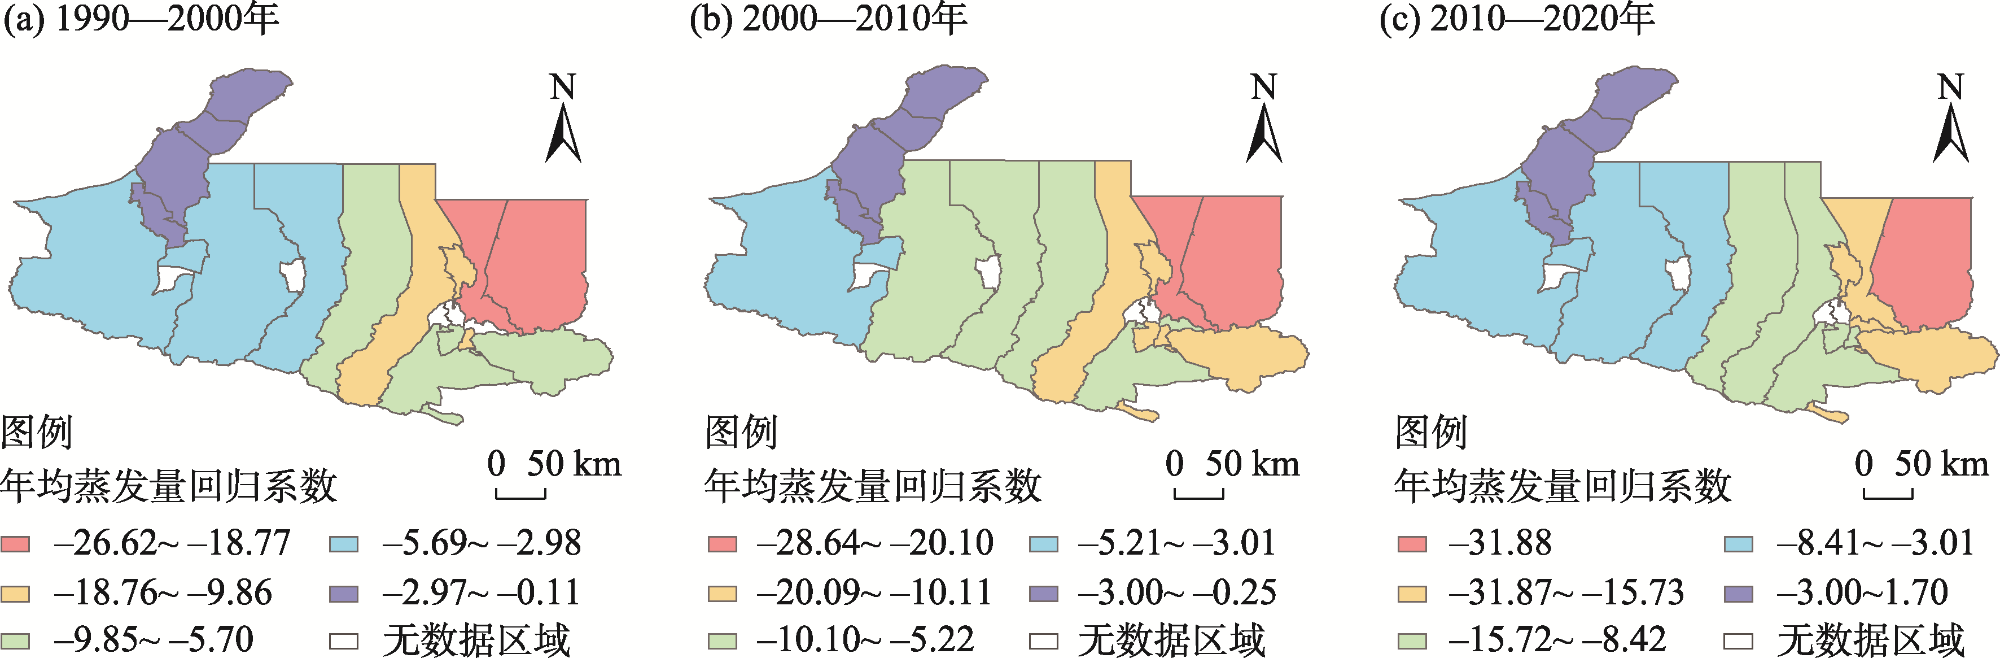
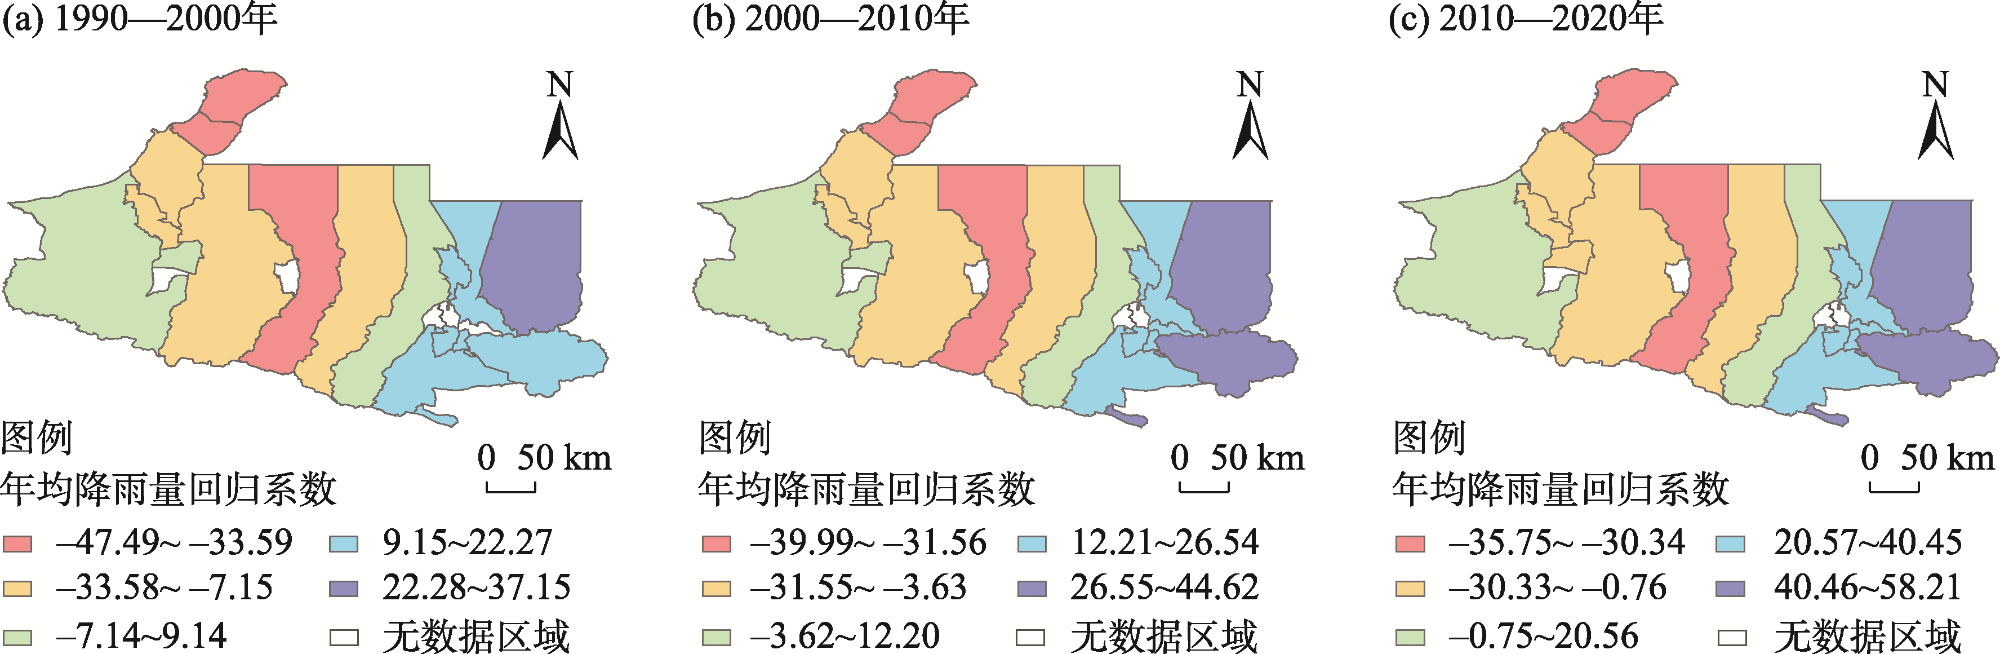
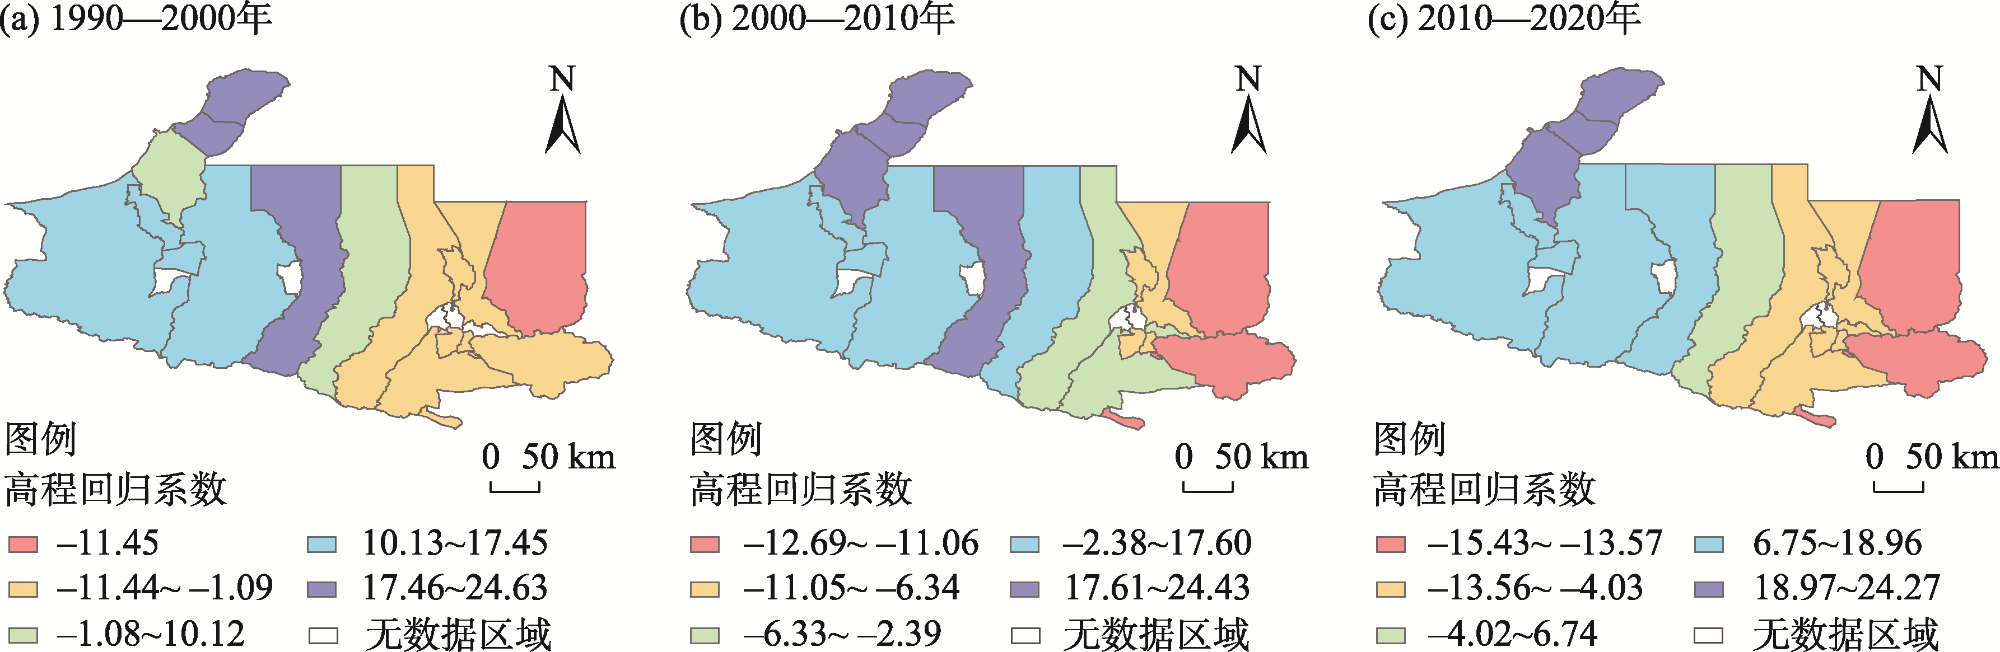
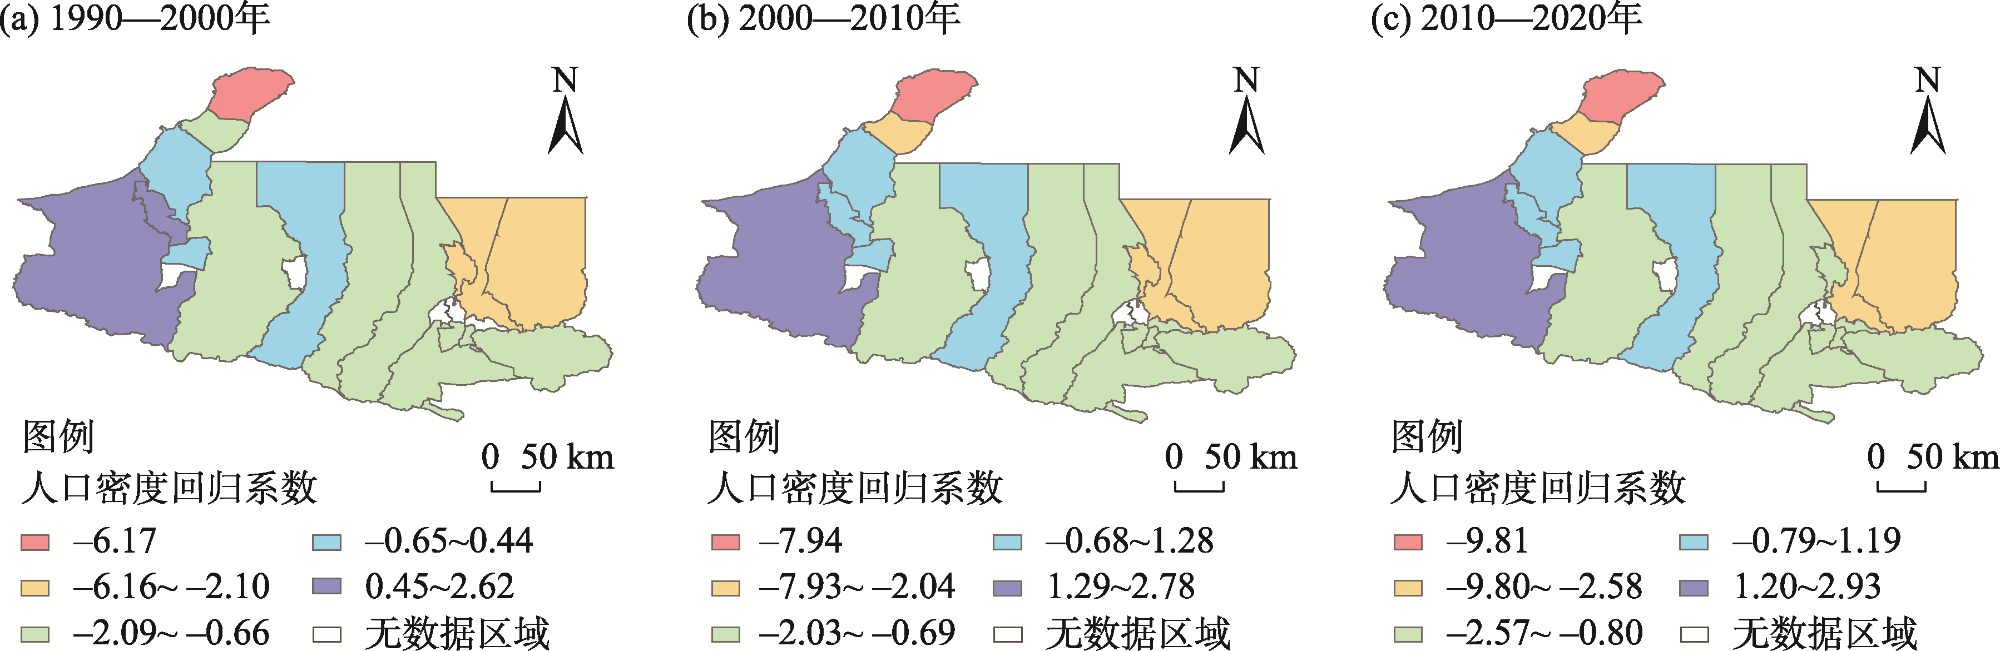
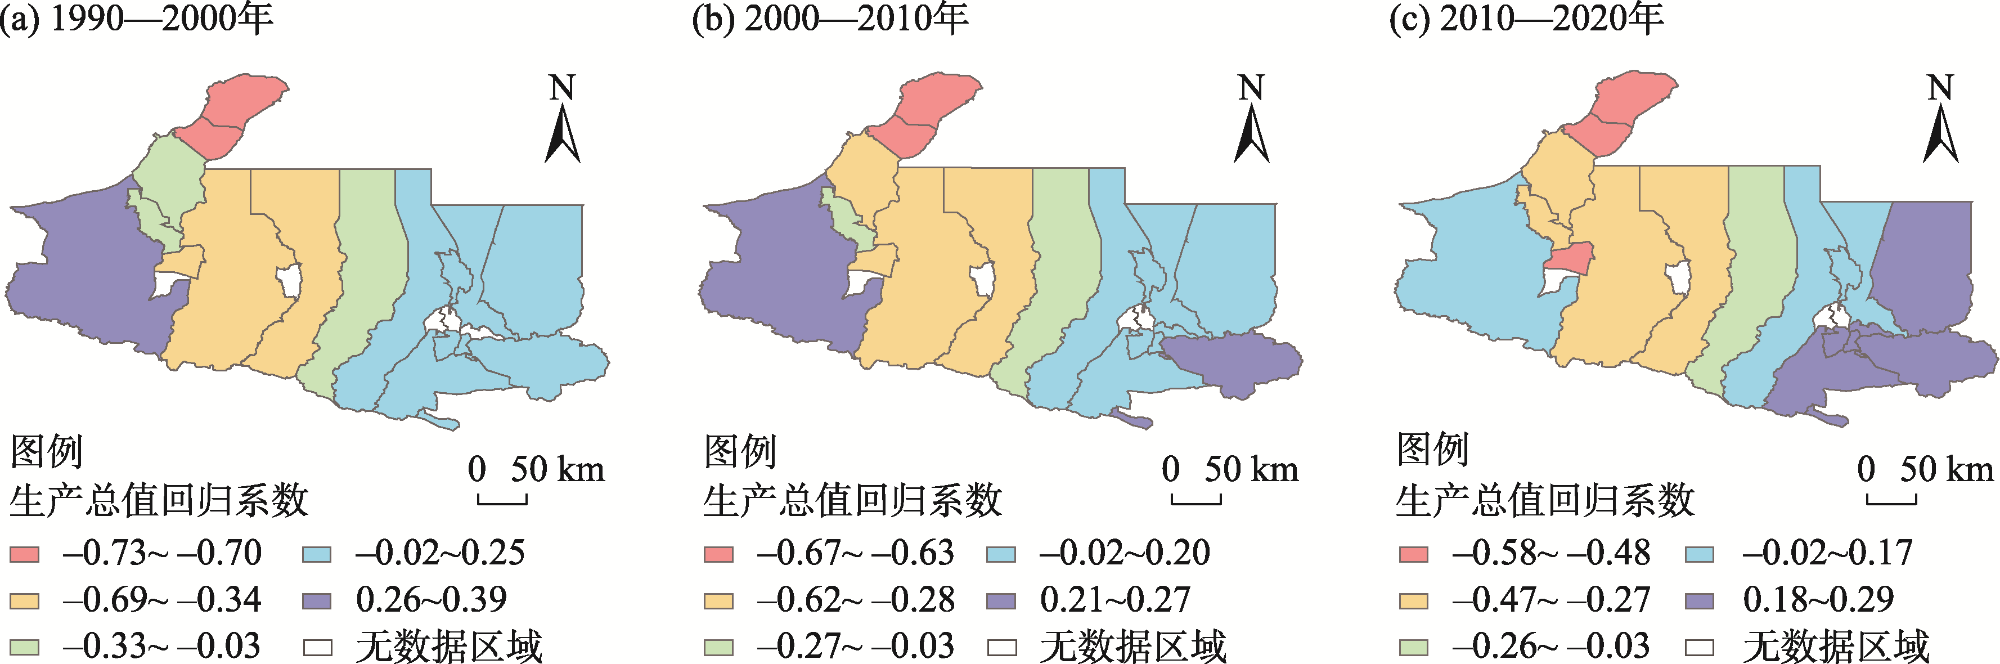
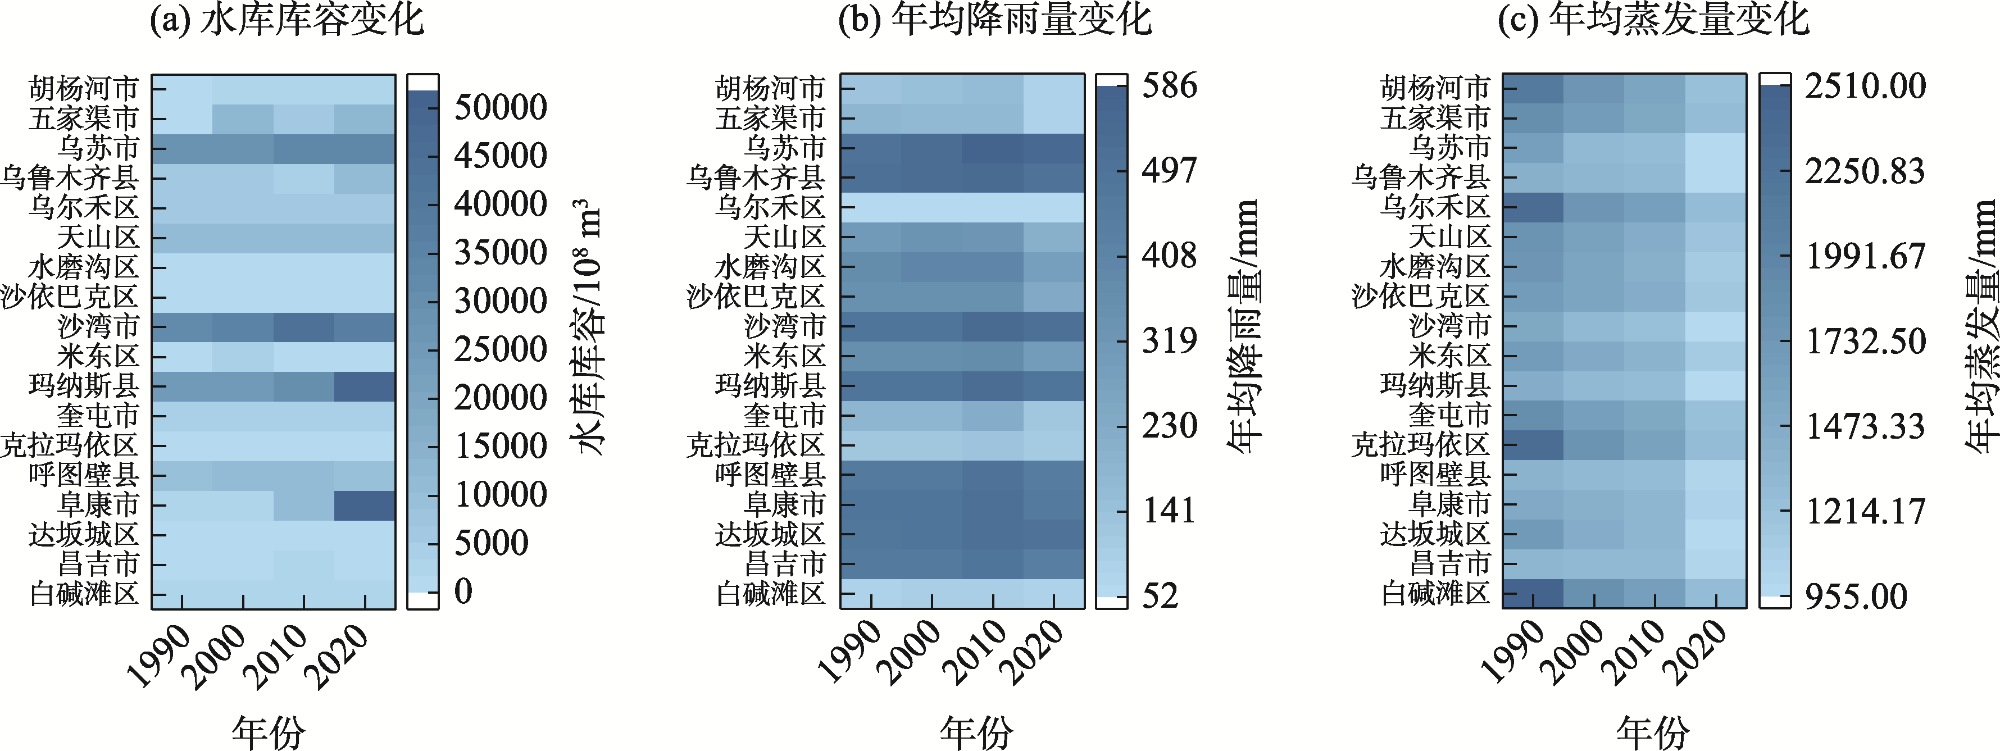
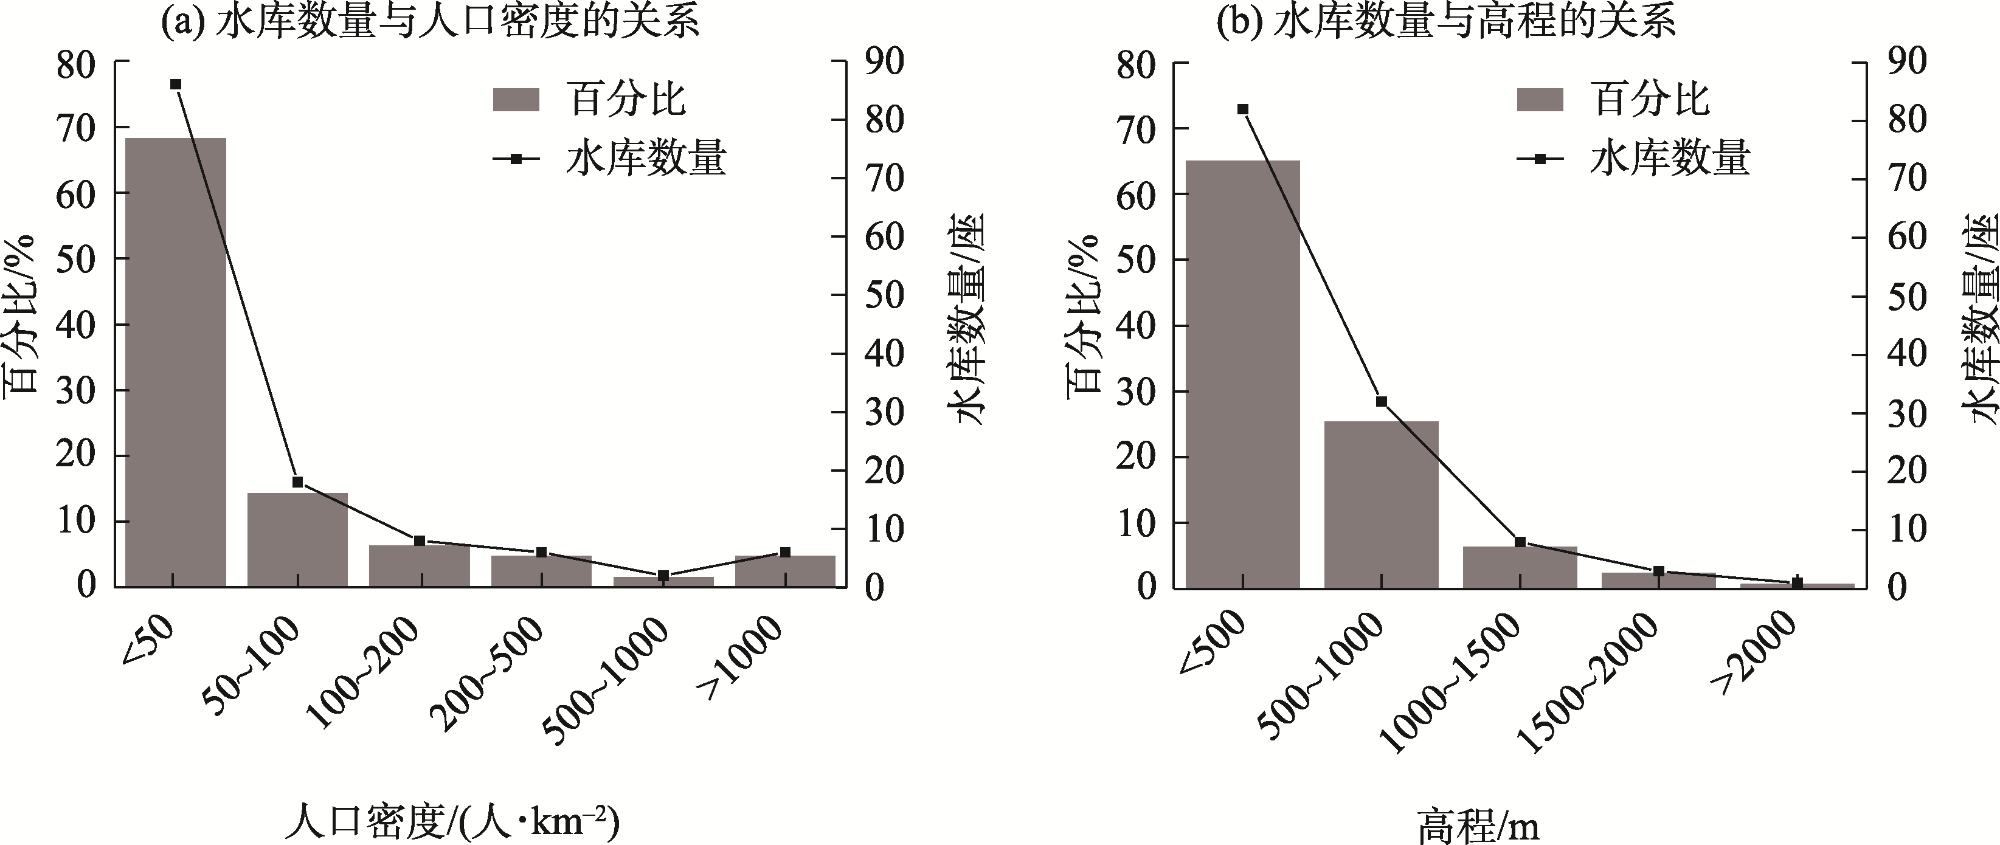
The temporal continuity and spatial equilibrium of reservoir group construction in the north slope of the Tianshan Mountain Economic Belt was verified, by extracting the water area of each reservoir from the 1990-2020 remote sensing data. The variation process of reservoir quantity and storage capacity was also analyzed by combining statistical data. The Moran index was used to quantify the aggregation degree of reservoir spatial distribution, and geographically and temporally weighted regression was established to analyze the driving factors of the reservoir. The results showed that in the past 30 years, the reservoir water area in the study region first increased by 46.25% from 1990 to 2015 and then decreased by 1.63% from 2015 to 2020. The number of reservoirs and storage capacity enhanced by 64.94% and 71.06% respectively. From 1990 to 2020, the Moreland index of the reservoirs in each representative year was 0.81, 0.83, 0.79, 0.91, 0.66, 0.73, and 0.78, respectively, along with a positive correlation between the spatial distribution of the reservoirs. The high-value area of reservoir distribution was mainly concentrated in the agricultural irrigation region of the Kuitun River Basin, and the low-value area in the industrial region was represented by Urumqi City. The main factors affecting the variation in reservoir capacity were evaporation, rainfall, elevation, population, and GDP. Evaporation adversely affected storage capacity, and the effect of rainfall was not uniform in space. Altitude and population had a positive impact on the construction of the reservoir in the west section and a negative influence in the east section. The GDP had a positive association with reservoir construction in the eastern section and a part of the western section, but a negative correlation in the middle section. These results can provide a reference for reservoir planning, construction, and operation management in similar areas.
WANG Ting , SHEN Ganhua , LIU Bing , SUN Yinglin , WANG Zaiguang . Evolution characteristics of spatial and temporal distribution pattern and driving force analysis of reservoirs in the economic zone on the north slope of Tianshan Mountains[J]. Arid Zone Research, 2024 , 41(9) : 1456 -1467 . DOI: 10.13866/j.azr.2024.09.03
表1 自然地理及社会经济相关数据Tab. 1 Physical geography and socio-economic data |
| 驱动因素 | 驱动因子 | 数据集名称 |
|---|---|---|
| 自然地理 因素 | 年均蒸发量/mm | 中国气象要素平均状况空间插值数据集 |
| DEM/m | 全国DEM 1 km、500 m和250 m数据 | |
| 年均降雨量/mm | 中国气象要素平均状况空间插值数据集 | |
| 社会经济 因素 | 人口密度 /(人·km-2) | 中国人口空间分布公里网格数据集 |
| 生产总值 /(104元·km-2) | 中国GDP空间分布公里网格数据集 |
表2 水库Moran’s I指数与检验Tab. 2 Moran’s I and test of reservoir |
| 代表年份 | Moran’s I | 标准差 | 概率 |
|---|---|---|---|
| 1990年 | 0.81 | 17.97 | 0.00 |
| 1995年 | 0.83 | 17.53 | 0.00 |
| 2000年 | 0.79 | 18.96 | 0.00 |
| 2005年 | 0.91 | 19.79 | 0.00 |
| 2010年 | 0.66 | 18.80 | 0.00 |
| 2015年 | 0.73 | 21.27 | 0.00 |
| 2020年 | 0.78 | 22.18 | 0.00 |
| [1] |
|
| [2] |
|
| [3] |
刘畅, 唐海蓉, 计璐艳, 等. 长时间序列1984—2020年密云水库水面信息遥感监测与分析[J]. 遥感学报, 2023, 27(2): 335-350.
[
|
| [4] |
吕明权, 吴胜军, 马茂华, 等. 中国小型水体空间分布特征及影响因素[J]. 中国科学: 地球科学, 2022, 52(8): 1443-1461.
[
|
| [5] |
|
| [6] |
李崇巍, 王志慧, 汤秋鸿, 等. 1986—2019年黄河流域地表水体动态变化及其影响因素[J]. 地理学报, 2022, 77(5): 1153-1168.
[
|
| [7] |
|
| [8] |
宋奇, 史舟, 冯春晖, 等. 基于1990—2019年多时相影像的干旱区绿洲景观格局分析[J]. 干旱区研究, 2022, 39(2): 594-604.
[
|
| [9] |
|
| [10] |
|
| [11] |
马振刚, 李黎黎, 张俊贵. 官厅和密云水库水域面积变化及影响因素比较研究[J]. 干旱区研究, 2023, 40(8): 1229-1239.
[
|
| [12] |
|
| [13] |
李健锋, 叶虎平, 张宗科, 等. 基于Landsat影像的斯里兰卡内陆湖库水体时空变化分析[J]. 地球信息科学学报, 2019, 21(5): 781-788.
[
|
| [14] |
郝固状, 甘甫平, 闫柏琨, 等. 红崖山水库近20年面积变化遥感调查及驱动力分析[J]. 国土资源遥感, 2021, 33(2): 192-201.
[
|
| [15] |
|
| [16] |
杨昀则, 田鹏, 李加林, 等. 浙江省水域系统时空变化特征及驱动力分析[J]. 浙江大学学报(理学版), 2022, 49(4): 508-520.
[
|
| [17] |
于成龙, 王志春, 刘丹, 等. 基于SWAT模型的西辽河流域自然湿地演变过程及驱动力分析[J]. 农业工程学报, 2020, 36(22): 286-297.
[
|
| [18] |
李娜娜, 高飞, 魏圣钊, 等. 四川省湿地类型变化的自然-社会经济驱动力分析[J]. 生态学报, 2020, 40(16): 5502-5512.
[
|
| [19] |
赵永玉, 阿里木江·卡斯木, 高鹏文, 等. 基于GIS的天山北坡城市群人居环境自然适宜性评价[J]. 生态科学, 2023, 42(5): 84-93.
[
|
| [20] |
李江, 柳莹, 吴涛, 等. 新疆水库大坝70年建设成就[J]. 中国水利水电科学研究院学报, 2020, 18(5): 322-330.
[
|
| [21] |
方创琳. 天山北坡城市群可持续发展战略思路与空间布局[J]. 干旱区地理, 2019, 42(1): 1-11.
[
|
| [22] |
刘琳, 张正勇, 刘芬, 等. 天山北坡经济带城市PM2.5质量浓度时空分布及模拟分析[J]. 环境科学研究, 2018, 31(11): 1849-1857.
[
|
| [23] |
|
| [24] |
王晓飞, 黄粤, 刘铁, 等. 近60 a伊塞克湖水量平衡变化及影响因素分析[J]. 干旱区研究, 2022, 39(5): 1576-1587.
[
|
| [25] |
|
| [26] |
王秀兰, 包玉海. 土地利用动态变化研究方法探讨[J]. 地理科学进展, 1999, 18(1): 81-87.
[
|
| [27] |
|
| [28] |
|
| [29] |
田鹏, 李加林, 王丽佳, 等. 基于GTWR模型的浙江省海岸带三维生态足迹动态变化及其影响因素[J]. 应用生态学报, 2020, 31(9): 3173-3186.
[
|
| [30] |
|
| [31] |
|
| [32] |
叶盼青, 阿不都艾尼·阿不里, 孙小丽, 等. 天山北坡经济带土壤重金属来源及污染评价[J]. 中国环境科学, 2022, 42(10): 4704-4712.
[
|
| [33] |
何思聪, 董恒, 张城芳. 1994—2015年武汉城市圈湖泊演变规律及驱动力分析[J]. 生态与农村环境学报, 2020, 36(10): 1260-1267.
[
|
| [34] |
李旭冰. 西天山北麓湖泊时空动态变化及影响因素研究[D]. 南京: 南京信息工程大学, 2022.
[
|
| [35] |
李江, 柳莹, 刘生云, 等. 新时期新疆水库大坝建设的主要问题与对策建议[J]. 干旱区地理, 2020, 43(6): 1409-1416.
[
|
/
| 〈 |
|
〉 |