
Spatiotemporal variations of the precipitation concentration index and seasonal precipitation characteristics in the Yalung Zangbo River Basin from 1981 to 2024
Received date: 2025-03-03
Revised date: 2025-04-24
Online published: 2025-08-13
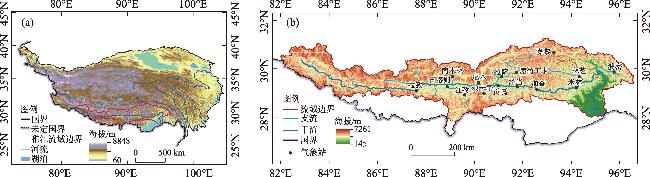
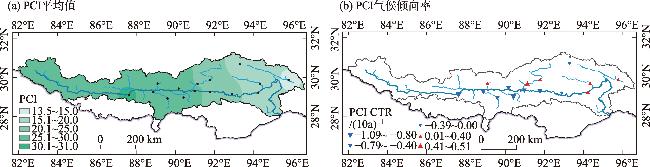
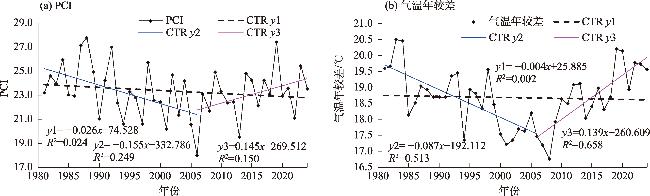
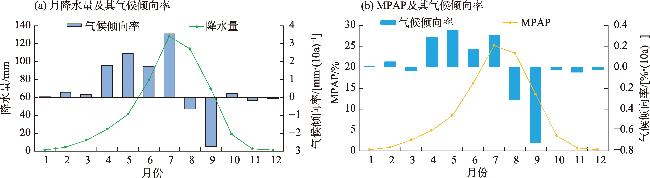
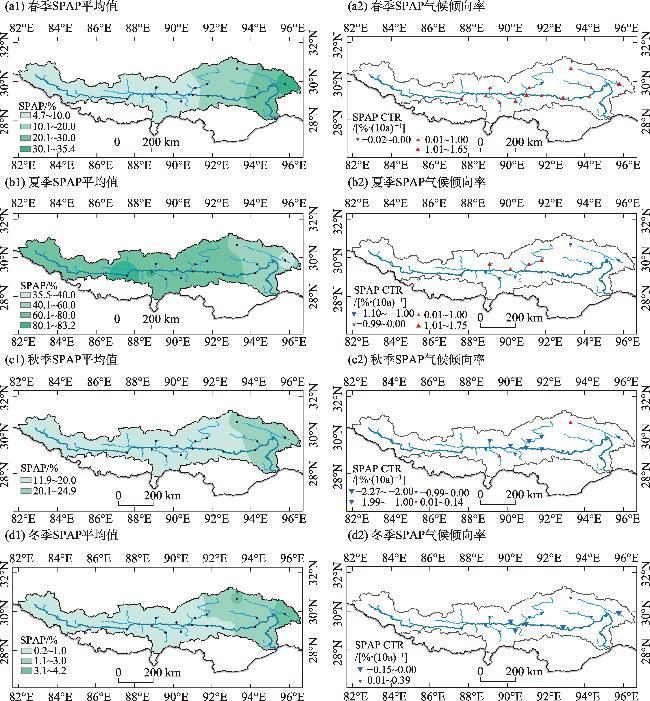
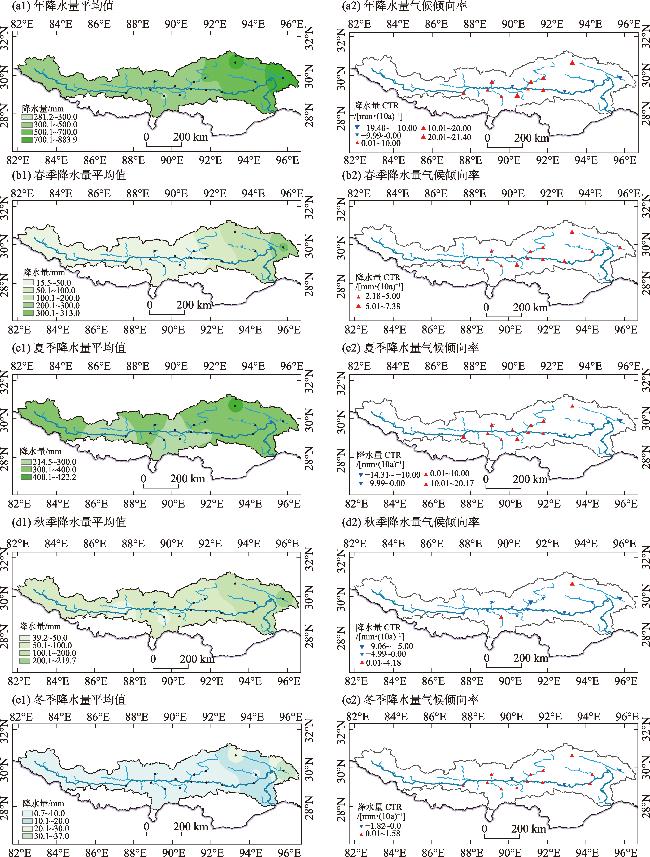
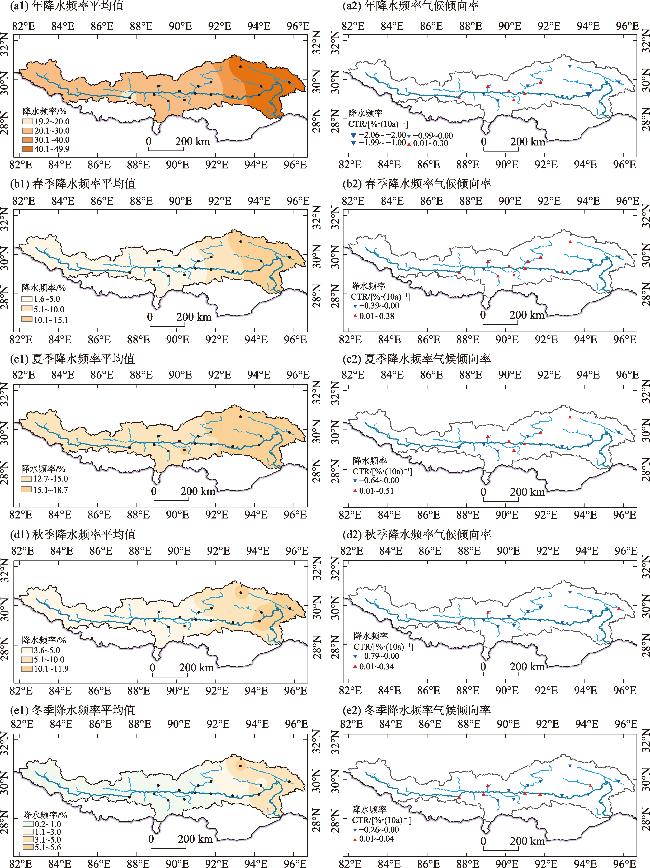
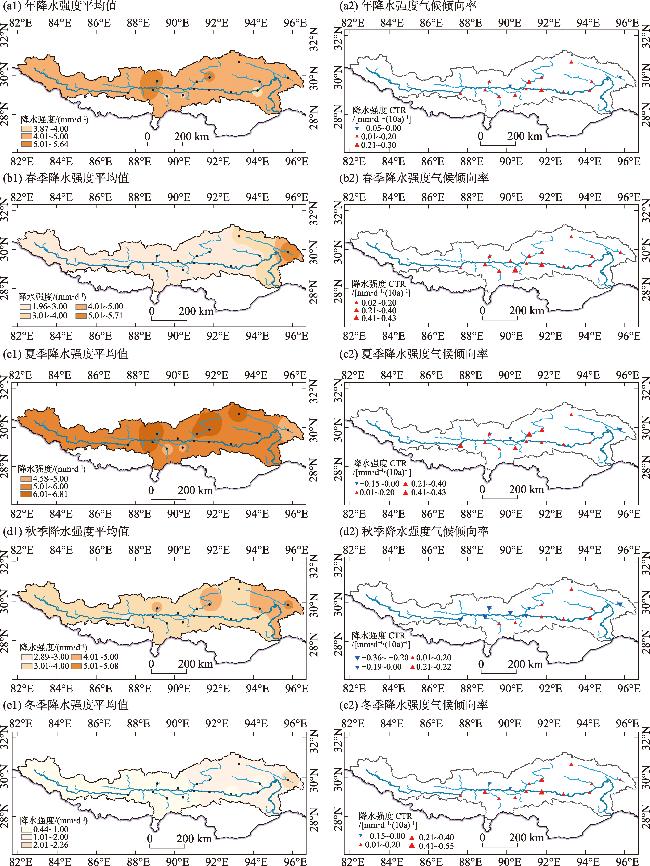
The precipitation concentration index (PCI) is a measure of precipitation during the year. Based on the monthly precipitation data of 15 meteorological stations in the Yarlung Zangbo River Basin (YZRB) from 1981 to 2024, the spatiotemporal variation characteristics of PCI, the amount of seasonal precipitation, its frequency and intensity over the last 44 years, and the reasons for a change in PCI were analyzed using a linear equation, Person coefficient, and five mutation tests, including the Mann-Kendall and Cramer tests. The results indicated that (1) The PCI increased from east to west in YZRB, whereas annual precipitation, precipitation frequency, and precipitation intensity decreased from east to west. (2) Over the past 44 years, the PCI decreased at a rate of -0.26 per decade, indicating a trend toward more evenly distributed monthly precipitation throughout the year. Precipitation exhibited an increasing trend from January to July and October (the fastest increase in July), and it decreased in other months (the most in September). Monthly precipitation accounted for the proportion of annual precipitation (MPAP), which increased in February and April-July (the largest in May). MPAP was decreased in other months (the largest decrease in September). (3) The increase of precipitation in spring, summer, and winter was primarily due to the increase in precipitation intensity, whereas the decrease of precipitation frequency played a major role in the decreased amount of precipitation during autumn. Furthermore, the increase in annual precipitation intensity resulted from the significant increase of the Tibetan Plateau-1 index and the western Pacific warm pool intensity index. The decrease in the PCI was related to a decrease in the seasonal difference under the background of warming. (4) The PCI was lower only in the 2000s, but was higher in the other three decades, although there was a sudden change in the early 1990s. The abrupt changes in annual precipitation, frequency, and intensity occurred during the first 10 years of the 2000s and the middle and late 1990s.
DU Jun , GAO Jiajia , CHEN Tao , Tsewang , Pakgordolma . Spatiotemporal variations of the precipitation concentration index and seasonal precipitation characteristics in the Yalung Zangbo River Basin from 1981 to 2024[J]. Arid Zone Research, 2025 , 42(7) : 1159 -1172 . DOI: 10.13866/j.azr.2025.07.01
图4 1981—2024年雅江流域平均月降水量及其气候倾向率(a)和各月降水量占年降水量百分比(MPAP)及其气候倾向率(b)Fig. 4 Average monthly precipitation and its climate tendency rate (a), and the monthly precipitation accounts for the proportion of annual precipitation (MPAP) and its climate tendency rate (b) in YZRB from 1981 to 2024 |
表1 1981—2020年雅江流域年、季降水量、降水频率和降水强度及PCI的年代际变化Tab. 1 Decadal anomaly of annual and seasonal precipitation amount, frequency and intensity, as well as PCI in YZRB from 1981 to 2020 |
| 时间 | 降水量/mm | 降水频 率/% | 降水强度 /(mm·d-1) | 年PCI | |
|---|---|---|---|---|---|
| 1981—1990年 | 春季 | -12.9 | -0.5 | -0.37 | 2.0 |
| 夏季 | -41.4 | -0.7 | -0.46 | ||
| 秋季 | 5.0 | 0.3 | -0.11 | ||
| 冬季 | 0.3 | 0.1 | -0.08 | ||
| 全年 | -49.1 | -0.8 | -0.35 | ||
| 1991—2000年 | 春季 | -6.4 | -0.4 | -0.21 | 0.1 |
| 夏季 | 12.7 | 0.4 | 0.03 | ||
| 秋季 | 5.1 | 0.2 | 0.25 | ||
| 冬季 | -0.2 | 0.2 | -0.19 | ||
| 全年 | 11.0 | 0.4 | 0.04 | ||
| 2001—2010年 | 春季 | 4.5 | 0.2 | 0.09 | -0.8 |
| 夏季 | -13.7 | 0.1 | -0.28 | ||
| 秋季 | 0.4 | 0.1 | -0.07 | ||
| 冬季 | 0.0 | -0.1 | -0.16 | ||
| 全年 | -8.8 | 0.3 | -0.16 | ||
| 2011—2020年 | 春季 | 1.9 | 0.1 | 0.13 | 0.4 |
| 夏季 | 1.0 | -0.4 | 0.27 | ||
| 秋季 | -5.6 | -0.3 | -0.19 | ||
| 冬季 | 0.4 | -0.2 | 0.35 | ||
| 全年 | -2.4 | -0.8 | 0.12 | ||
注:距平为与1991—2020年差值。 |
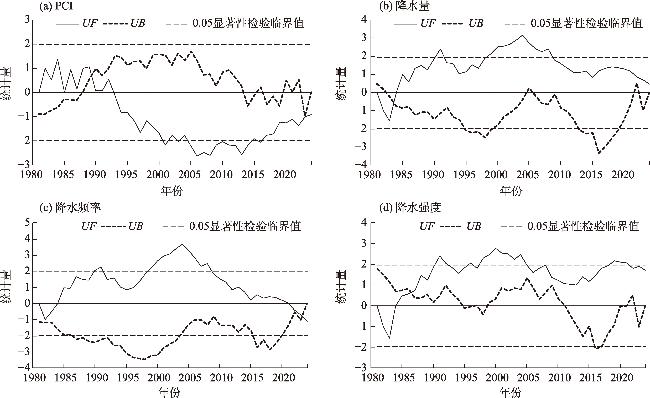
表2 基于5种突变检验法的1981—2024年雅江流域平均年PCI、降水量、降水频率和降水强度突变年份Tab. 2 Mutation years of average annual PCI, precipitation amount, frequency and intensity in YZRB from 1981 to 2024 based on five mutation tests |
| 时间 | 突变检验法 | ||||
|---|---|---|---|---|---|
| Mann-Kendall | Cramer | MTT | Yamamoto | Pettitt | |
| PCI | 1990年 | 2008年 | 1992年 | - | 1992年 |
| 降水量 | 1984年 | 2003年 | 2005年 | 2005年 | 1994年 |
| 降水频率 | - | 2003年 | 2004年 | 2004年 | 2003年 |
| 降水强度 | 1986年 | - | - | - | 1989年 |
注:MTT为滑动t检验法;“-”表示无突变年。 |
| [1] |
IPCC. Climate Change 2021: The Physical Science Basis[R]. Cambridge and New York: Cambridge University Press, 2021.
|
| [2] |
|
| [3] |
|
| [4] |
张克新, 苏志华, 刘金林, 等. 甘肃省降水集中度的变化特征及其与环流指数遥相关分析[J]. 水土保持研究, 2021, 28(5): 261-267.
[
|
| [5] |
|
| [6] |
|
| [7] |
杨军, 张会兰, 庞建壮. 嘉陵江流域降水集中度的时空变异与驱动因素研究[J]. 长江流域资源与环境, 2021, 30(4): 849-860.
[
|
| [8] |
安彬, 肖薇薇, 朱妮, 等. 近60 a黄土高原地区降水集中度与集中期时空变化特征[J]. 干旱区研究, 2022, 39(5): 1333-1344.
[
|
| [9] |
|
| [10] |
张录军, 钱永甫. 长江流域汛期降水集中程度和洪涝关系研究[J]. 地球物理学报, 2004, 51(4): 622-630.
[
|
| [11] |
|
| [12] |
|
| [13] |
|
| [14] |
王睆, 陆尔, 赵玮, 等. 一种新的反映我国降水季节内非均匀性特征的方法[J]. 热带气象学报, 2015, 31(5): 655-663.
[
|
| [15] |
刘永林, 延军平, 岑敏仪. 中国降水非均匀性综合评价[J]. 地理学报, 2015, 70(3): 392-406.
[
|
| [16] |
刘向培, 佟晓辉, 贾庆宇, 等. 1960—2017年中国降水集中程度特征分析[J]. 水科学进展, 2021, 32(1): 10-19.
[
|
| [17] |
孔锋, 方佳毅, 刘凡, 等. 1951—2012年中国降水集中度和集中期的时空格局[J]. 北京师范大学学报(自然科学版) 2015, 51(4): 404-411.
[
|
| [18] |
任志艳, 延军平, 王鹏涛. 1960—2012年内蒙古降水集中度和降水集中期时空变化[J]. 中国沙漠, 2016, 36(3): 760-766.
[
|
| [19] |
董满宇, 王磊鑫, 李洁敏, 等. 1960—2017年滦河流域降水集中度与集中期时空变化特征[J]. 北京师范大学学报(自然科学版) 2019, 55(4): 468-475.
[
|
| [20] |
高颖会, 顾斌贤, 柳一玲, 等. 山东省降水集中程度及其与旱涝的关系[J]. 水电能源科学, 2021, 39(1): 18-21.
[
|
| [21] |
吴天贻, 周玉淑, 韩芙蓉. 金华地区汛期降水集中度和集中期特征分析[J]. 气候与环境研究, 2024, 29(5): 615-628.
[
|
| [22] |
黄彩婷, 刘文英, 赵冠男. 江西省汛期降水集中度和集中期时空分布特征[J]. 气象与减灾研究, 2022, 45(2): 92-98.
[
|
| [23] |
杜娟, 于晓晶, 黎小东, 等. 近60 年三江源地区降水集中度和季节性降水特征变化分析[J]. 高原气象, 2024, 43(4): 826-840.
[
|
| [24] |
贾路, 于坤霞, 邓铭江, 等. 西北地区降雨集中度时空演变及其影响因素[J]. 农业工程学报, 2021, 37(16): 80-89.
[
|
| [25] |
鄢晓茜, 肖天贵, 王静. 西南地区暴雨灾害集中度变化特征及其与环流指数的关系[J]. 高原山地气象研究, 2024, 44(2): 91-97.
[
|
| [26] |
王腾, 孙晓光, 卓永, 等. 近36年昌都市降水集中度与集中期时空变化特征[J]. 高原山地气象研究, 2016, 36(4): 71-74, 85.
[
|
| [27] |
|
| [28] |
段亚雯, 朱克云, 马柱国, 等. 中国区域1961—2010年降水集中指数(PCI)的变化及月分配特征[J]. 大气科学, 2014, 38(6): 1124-1136.
[
|
| [29] |
|
| [30] |
段娅楠, 季漩, 郭若愚, 等. 雅鲁藏布江流域潜在蒸散发的气候敏感性及其变化的主导因子分析[J]. 水土保持研究, 2020, 27(2): 261-268.
[
|
| [31] |
徐宗学, 班春广, 张瑞. 雅鲁藏布江流域径流演变规律与归因分析[J]. 水科学进展, 2022, 33(4): 519-530.
[
|
| [32] |
陈斌, 李海东, 曹学章, 等. 雅鲁藏布江流域植被格局与NDVI分布的空间响应[J]. 中国沙漠, 2015, 35(1): 120-128.
[
|
| [33] |
|
| [34] |
|
| [35] |
黄志诚, 杜军, 白宇轩, 等. 1981—2020年西藏高原汛期降水量时空变化特征[J]. 高原山地气象研究, 2024, 44(2): 83-90.
[
|
| [36] |
杨浩, 崔春光, 王晓芳, 等. 气候变暖背景下雅鲁藏布江流域降水变化研究进展[J]. 暴雨灾害, 2019, 38(6): 565-575.
[
|
| [37] |
李晓琳. 青藏高原雪盖次季节变率的季节进程[J]. 高原山地气象研究, 2024, 44(3): 120-128.
[
|
| [38] |
|
| [39] |
张仪辉, 刘昌明, 梁康, 等. 雅鲁藏布江流域降水时空变化特征[J]. 地理学报, 2022, 77(3): 603-618.
[
|
| [40] |
边巴卓嘎, 赤曲, 周顺武, 等. 雅鲁藏布江河谷盛夏降水年际变化及其与环流的联系[J]. 大气科学学报, 2022, 45(3): 469-479.
[
|
| [41] |
高佳佳, 杜军. 雅鲁藏布江流域极端降水模拟及预估[J]. 冰川冻土, 2021, 43(2): 580-588.
[
|
| [42] |
赤曲, 周顺武, 多典洛珠, 等. 1961—2017年雅鲁藏布江河谷地区夏季气候暖干化趋势[J]. 气候与环境研究, 2020, 25(3): 281-291.
[
|
| [43] |
|
| [44] |
魏凤英. 现代气候统计诊断与预测技术(第2版)[M]. 北京: 气象出版社, 2007.
[
|
| [45] |
唐启义. DPS数据处理系统-实验设计、统计分析及数据挖掘(第2版)[M]. 北京: 科学出版社, 2010.
[
|
| [46] |
杜军, 高佳佳, 陈涛, 等. 1981—2023年雅鲁藏布江流域大气饱和水汽压差变化及影响因素[J]. 气候变化研究进展, 2024, 20 (5): 544-557.
[
|
| [47] |
徐祥德, 董李丽, 赵阳, 等. 青藏高原“亚洲水塔”效应和大气水分循环特征[J]. 科学通报, 2019, 64(27): 2830-2841.
[
|
| [48] |
朱艳欣, 桑燕芳. 青藏高原降水季节分配的空间变化特征[J]. 地理科学进展, 2018, 37(11): 1533-1544.
[
|
/
| 〈 |
|
〉 |