
Carbon density distribution pattern and its factors of the artificial forest vegetation in opencast coal mine
Received date: 2023-12-11
Revised date: 2024-03-29
Online published: 2025-08-12
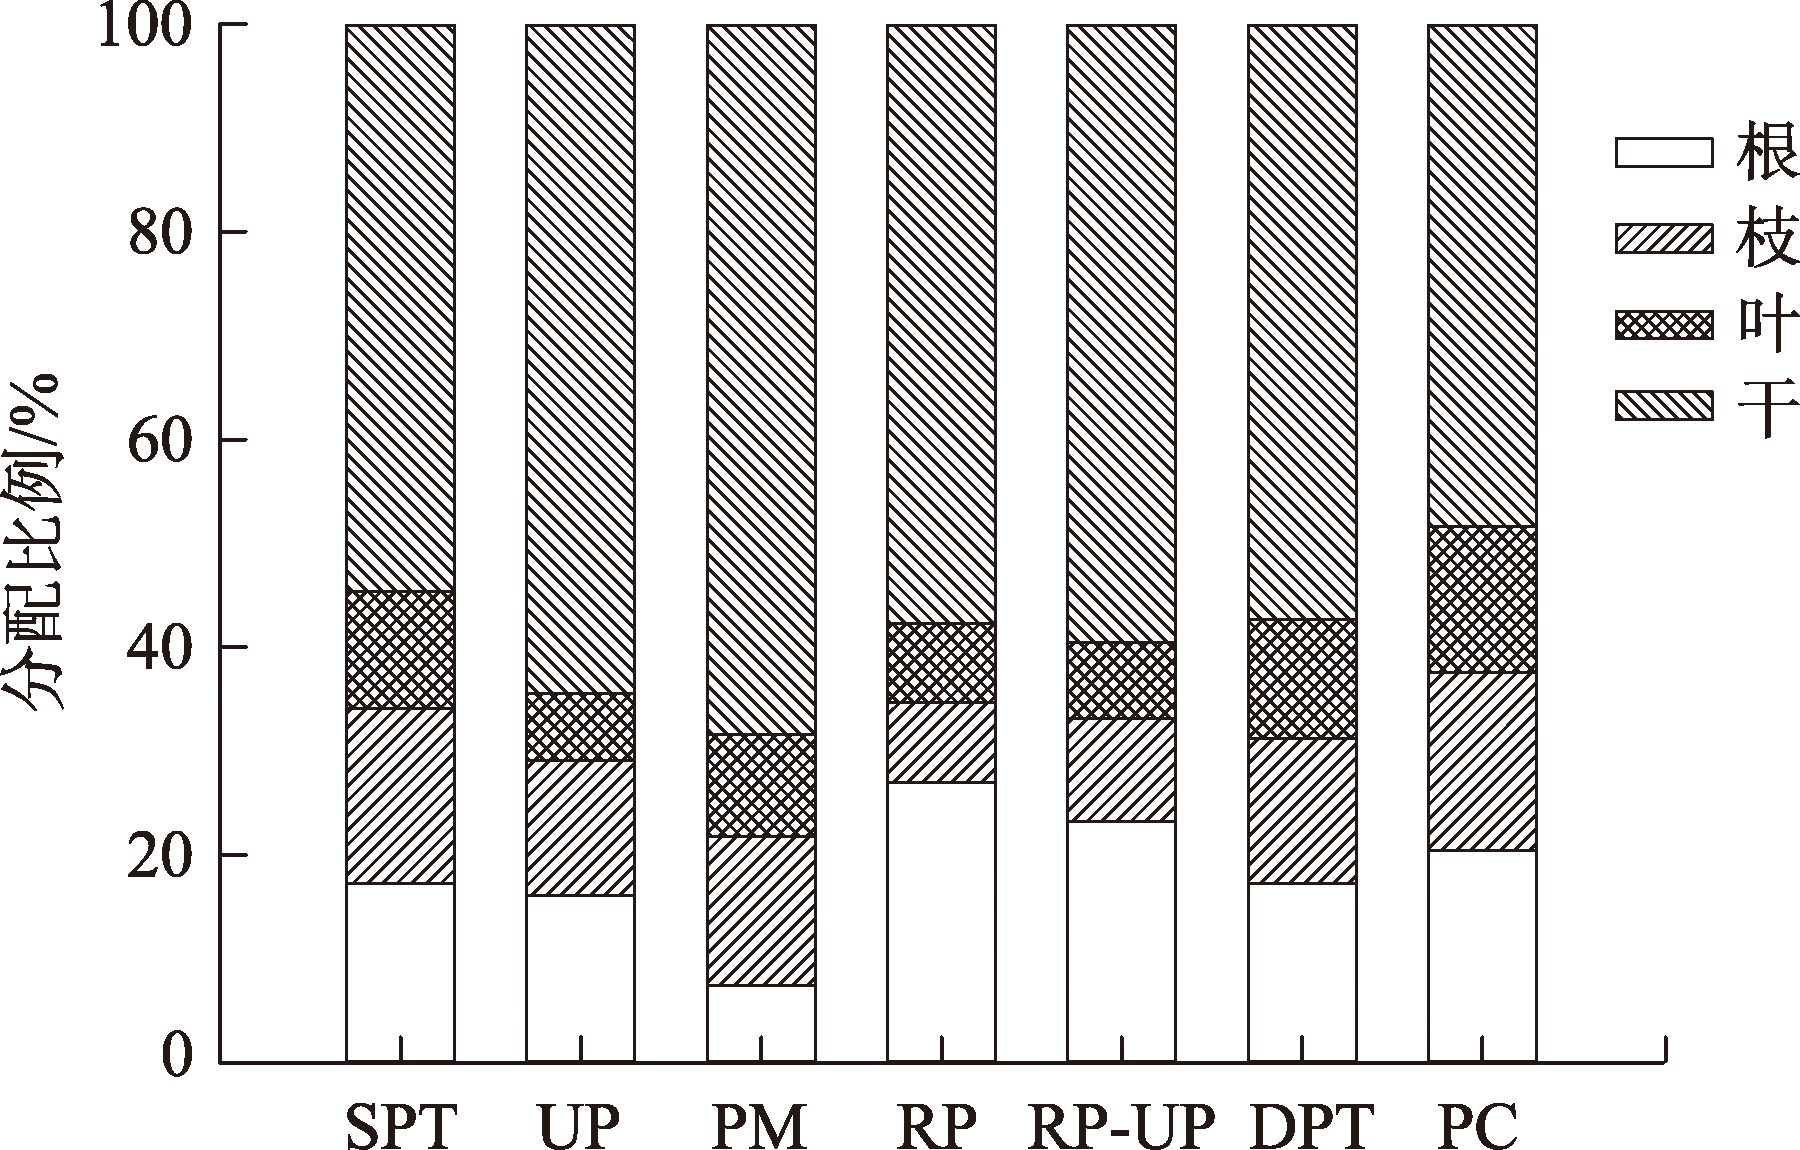
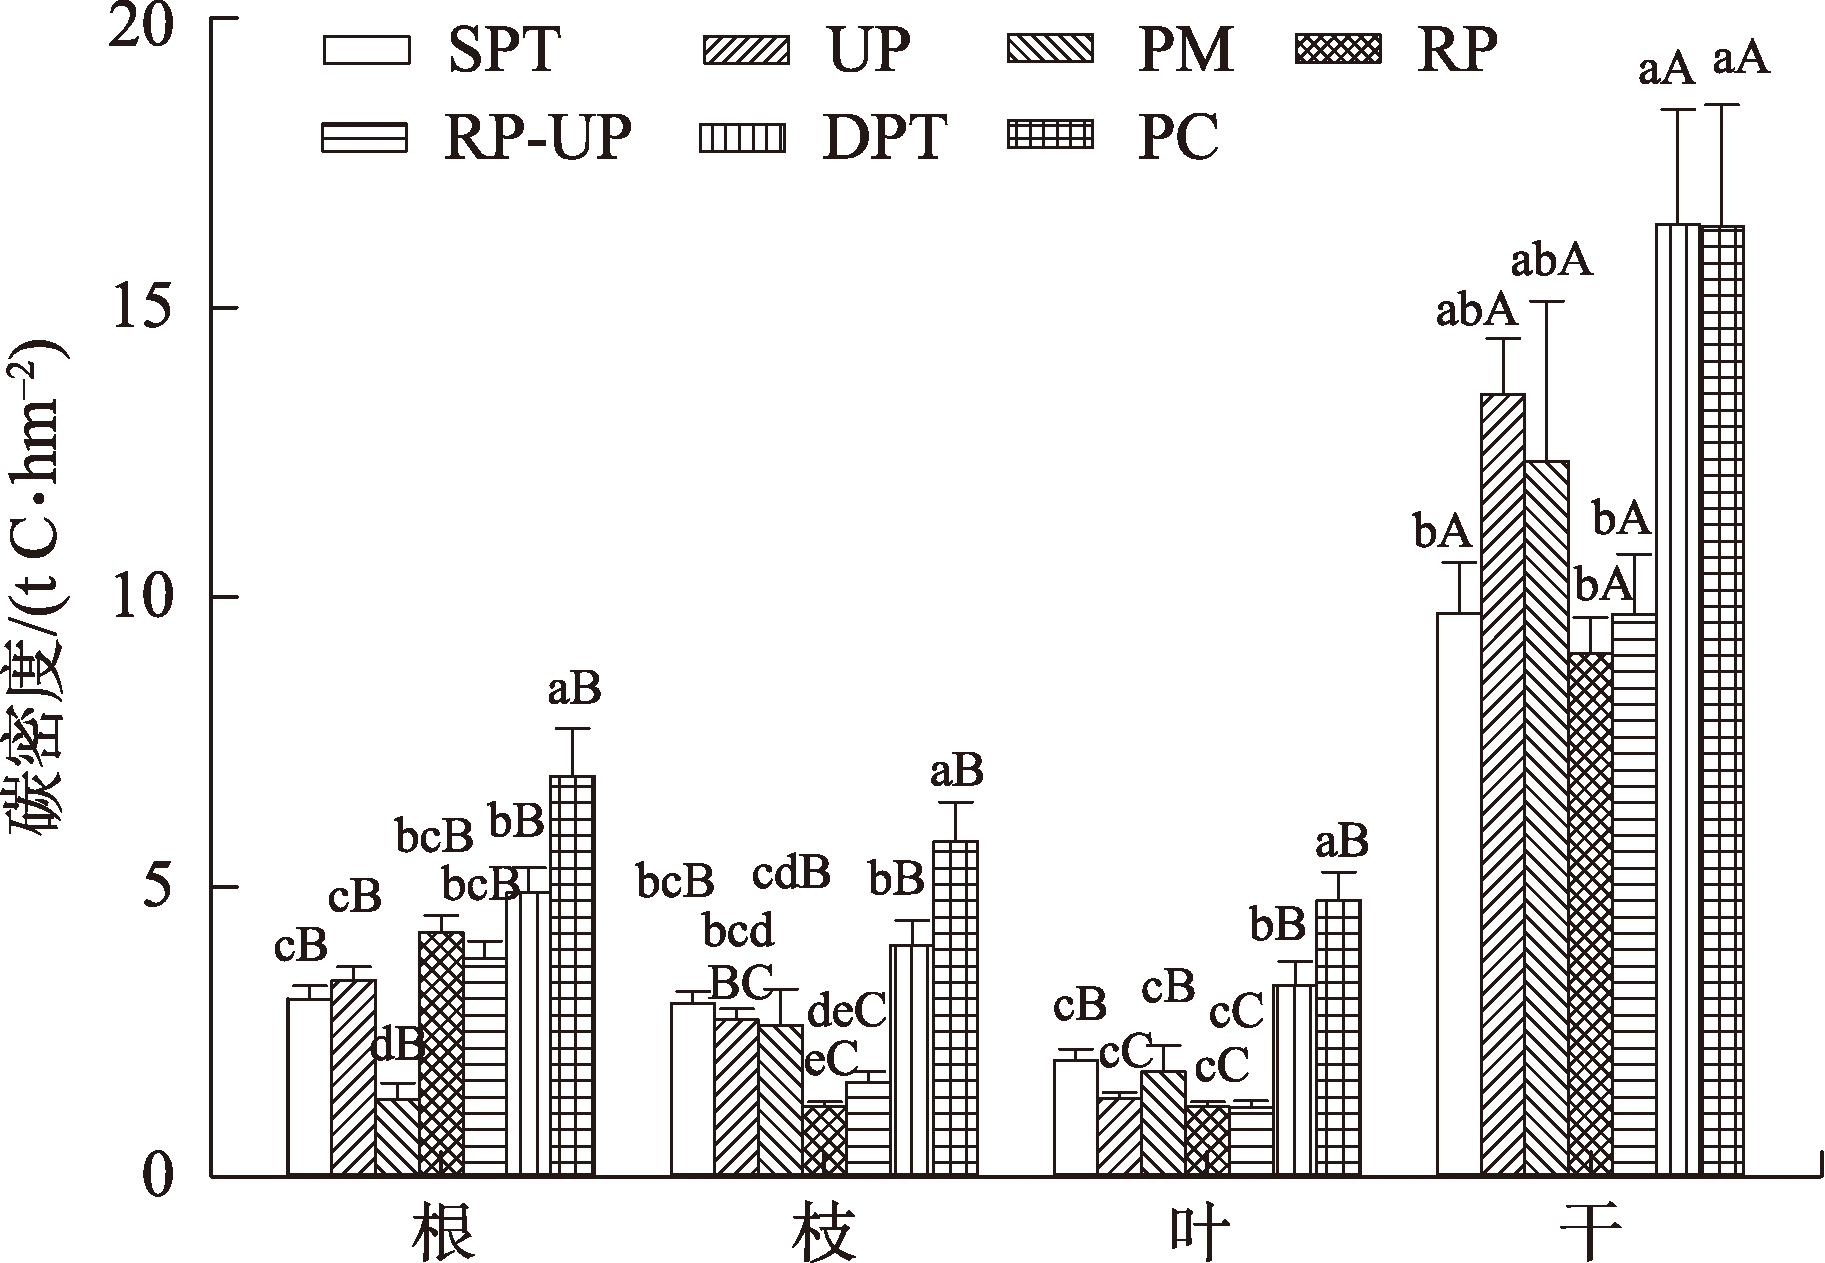
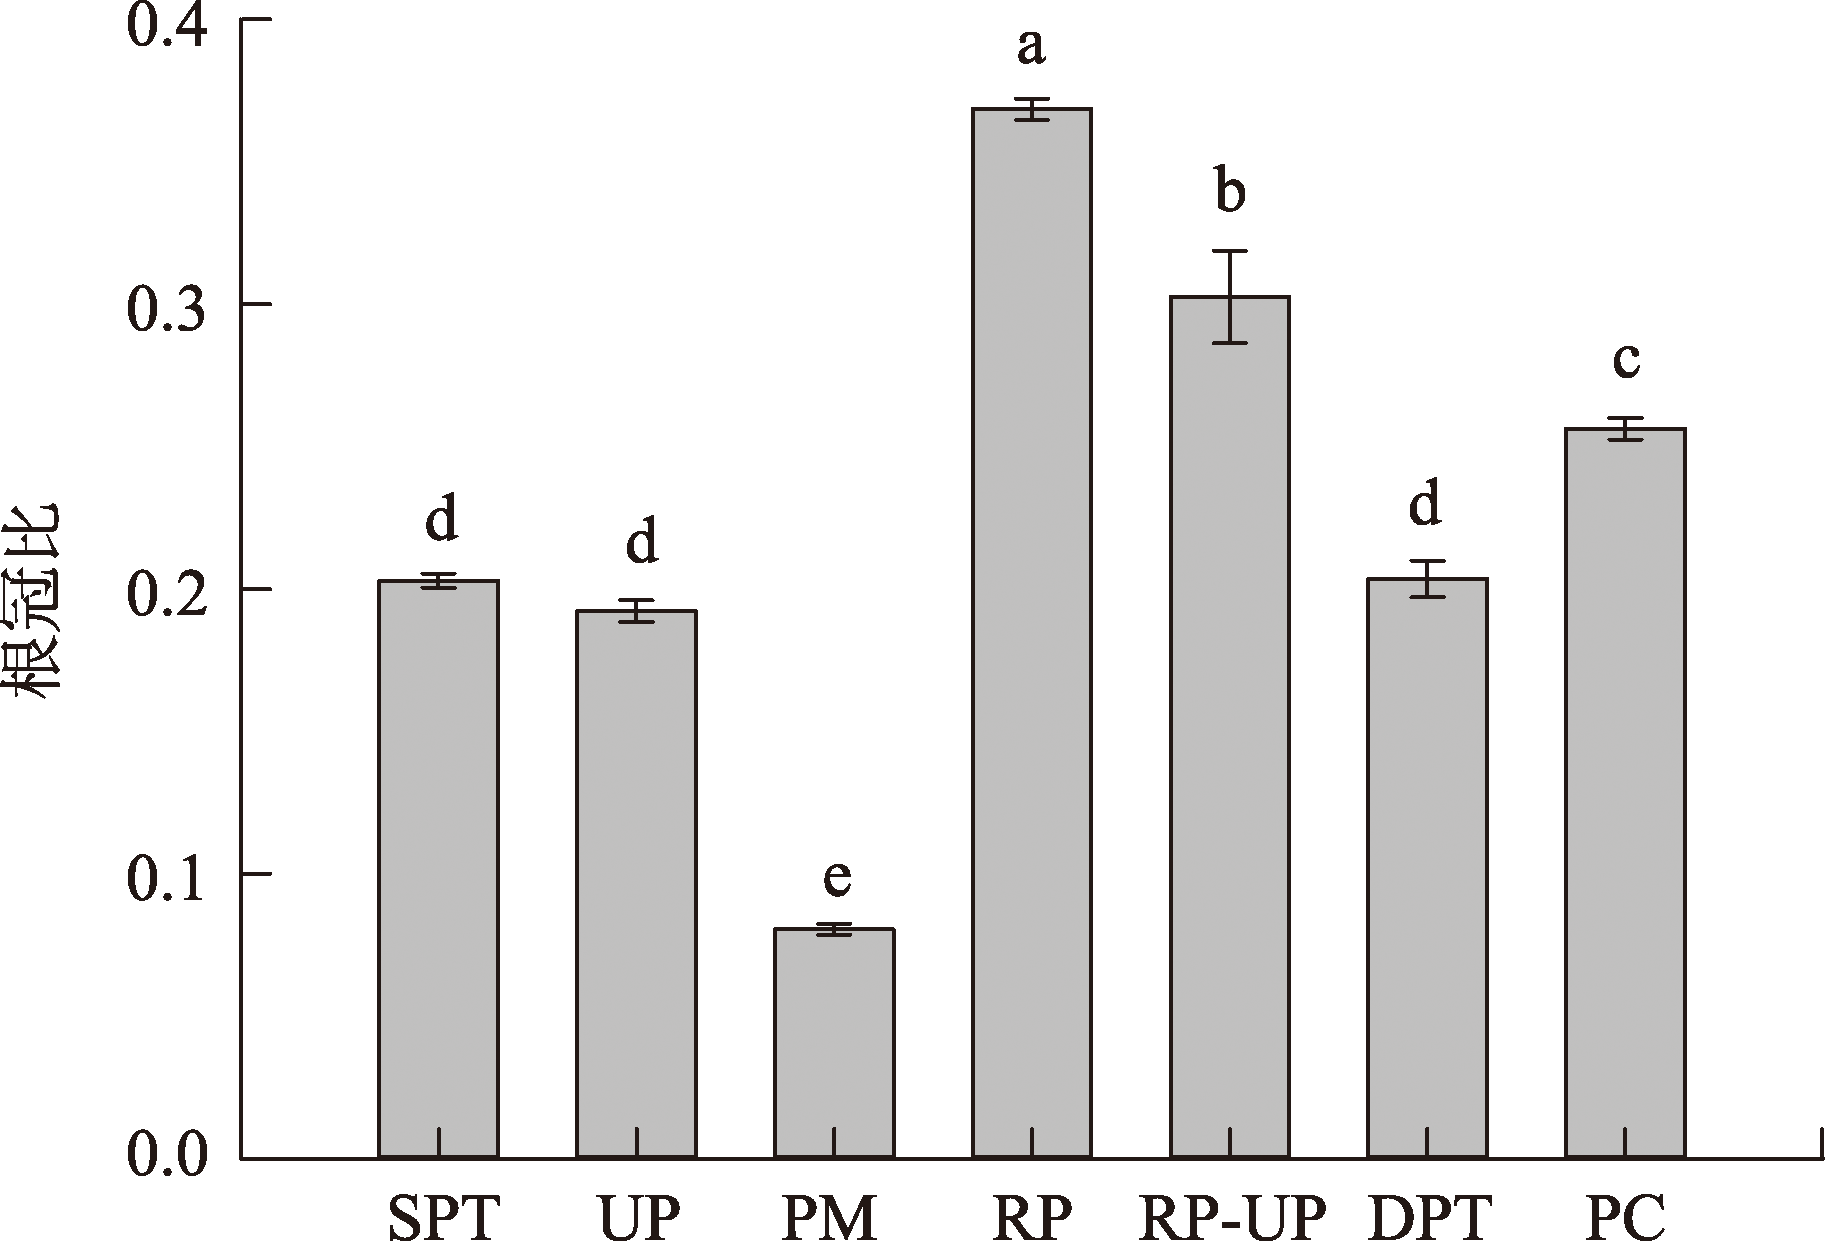
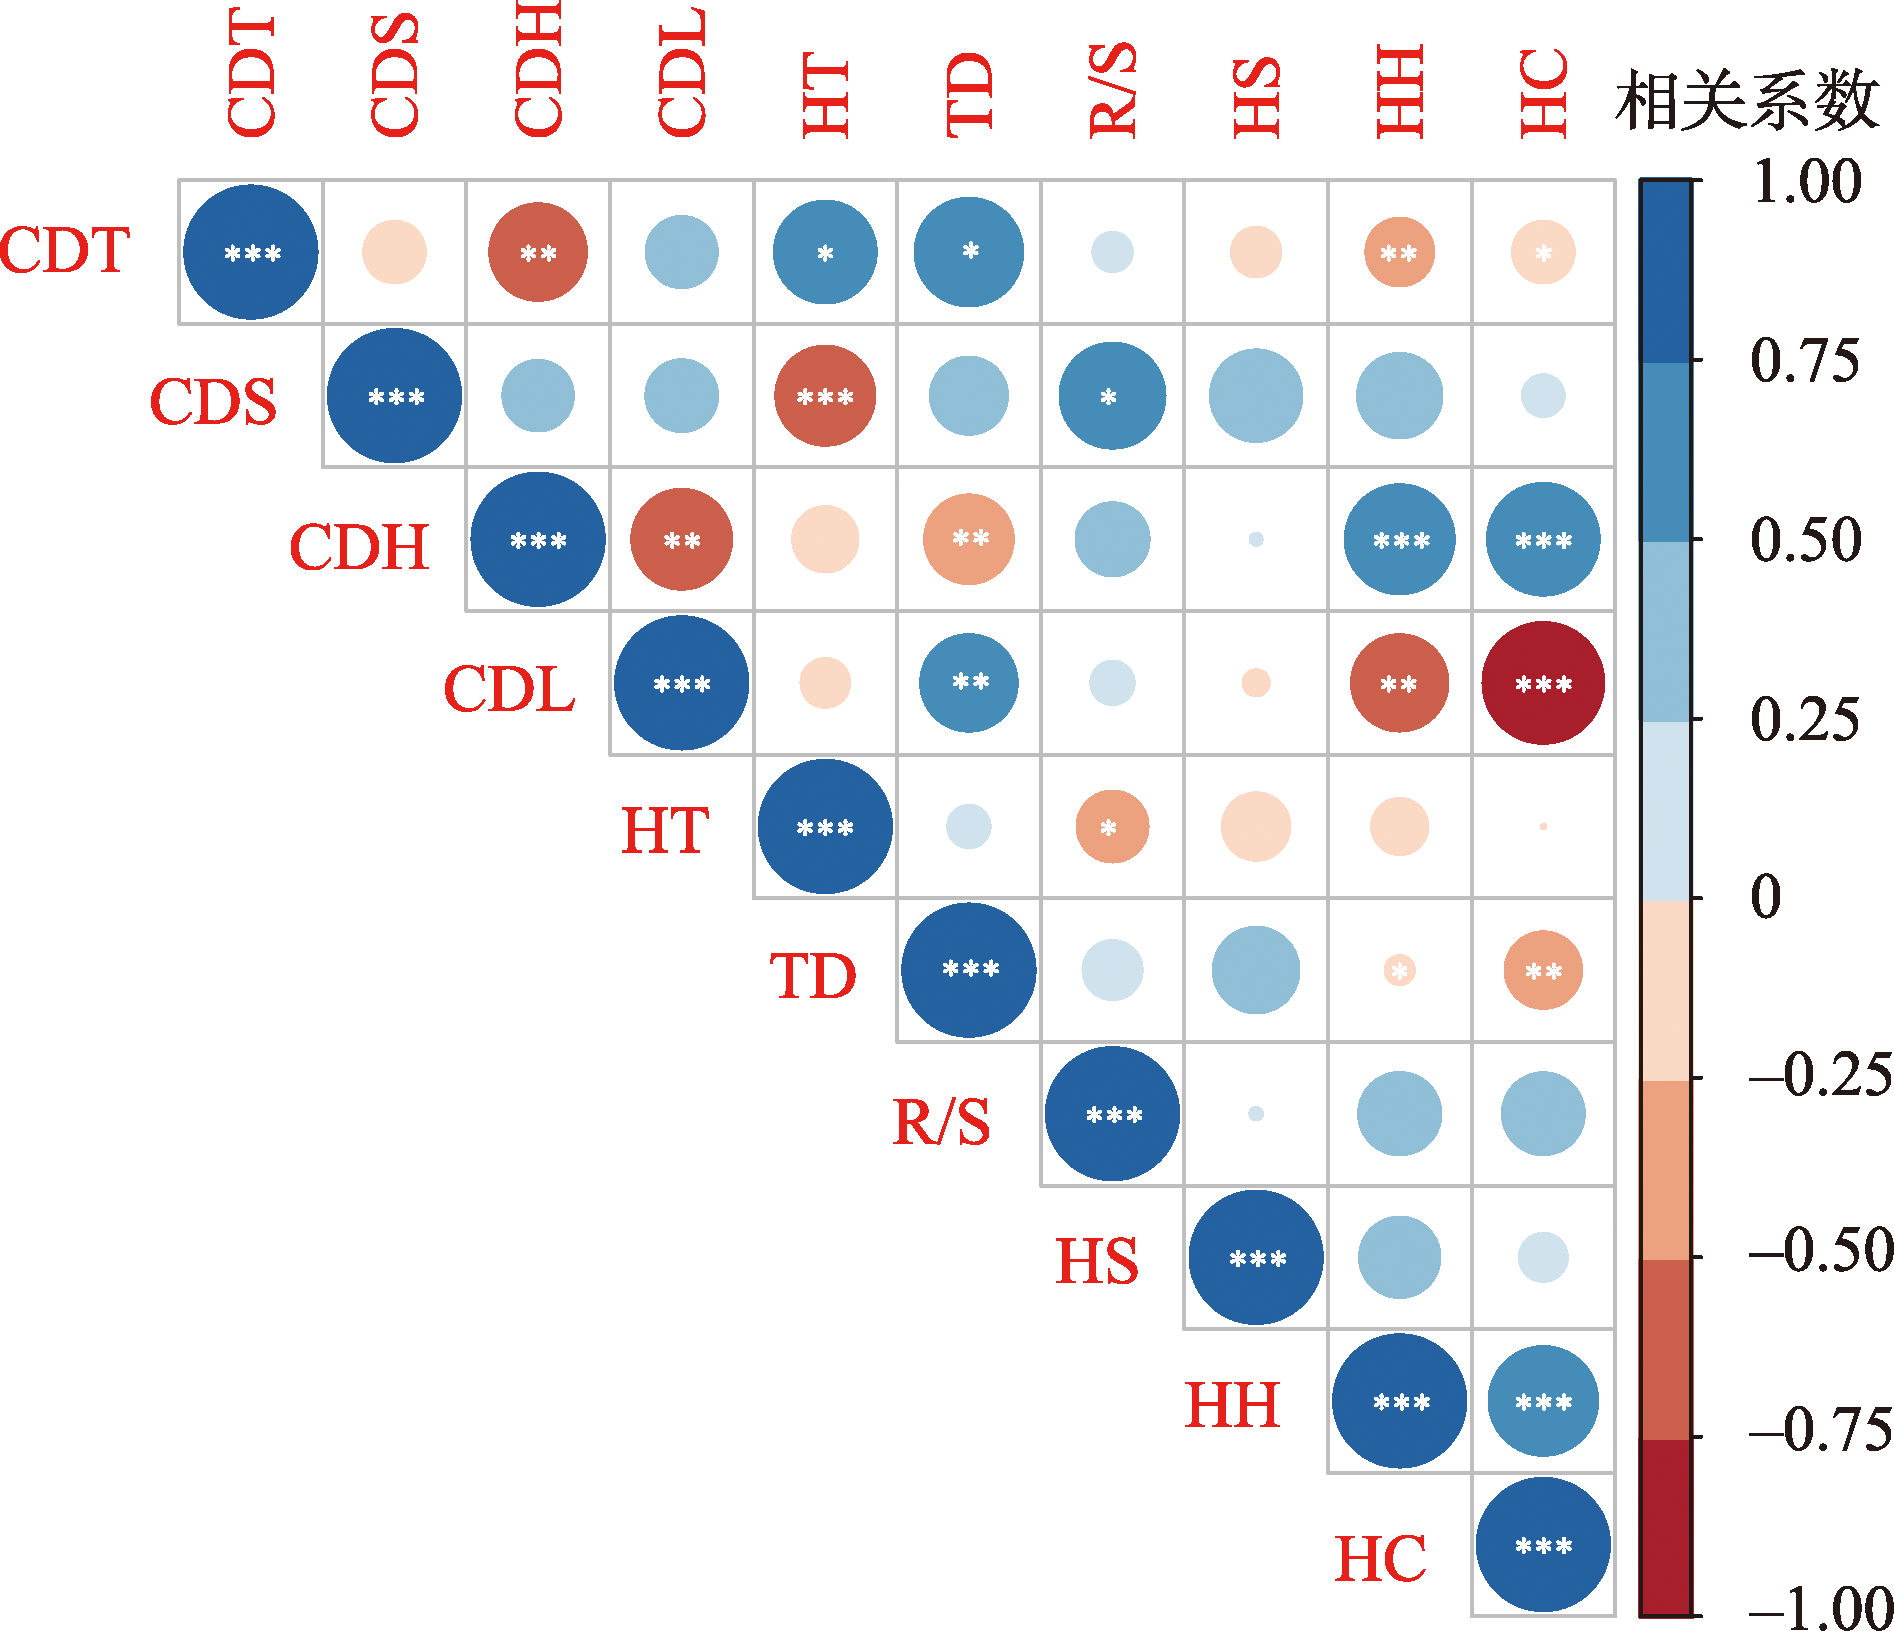
This study aimed to quantitatively analyze the distribution patterns of carbon density and its factors of artificial forest vegetation in opencast coal mines and provide a basis for improving the forest carbon (C) sink service function using available data. It selected Pinus tabulaeformis, Populus microphylla, Populus canadensis, Robinia pseudoacacia, Ulmus pumila, and mixed R. pseudoacacia-U. pumila plantations in the waste dump of the Antaibao mining area as the research objects. The biomass carbon density and spatial distribution pattern of each plantation were measured based on the field investigation data and by employing allometric approaches. The carbon density of the P. canadensis plantation was 36.95 t∙hm-2, significantly higher than others (P<0.05). The carbon density was markedly higher in the thickly planted P. tabulaeformis forest than in the sparsely planted one (P<0.05). The overall carbon density of each component in the artificial forest was as follows: tree layer>litter layer>herbaceous and shrub layers (P<0.05). The tree layer accounted for 78.3%-93.6% of the vegetation carbon density, indicating it has the highest carbon density in the artificial forest vegetation. The carbon density in the trunk of the tree layer was remarkably greater than that of the roots, branches, and leaves (P<0.05). The carbon density in the trunk of P. canadensis plantation was conspicuously higher than that of R. pseudoacacia and R. pseudoacacia-U. pumila. Similarly, the carbon density was significantly higher in the trunk of the sparsely planted P. tabulaeformis forest than in the densely planted forest. The carbon density of the tree and litter layers demonstrated a remarkable positive correlation with the stand density of artificial forests and negatively with the height and coverage of herbs. Additionally, the carbon density of the tree layer was markedly positively correlated with the tree height (P<0.05). From the perspective of carbon sequestration function, a reasonable and dense planting of P. tabulaeformis and P. canadensis in the Antaibao coal mine waste dump is beneficial for the ecological restoration of the area, thus achieving sustainable development of the ecology and environmental security.
Key words: carbon density; biomass; plantation; vegetation restoration; Antaibao mine
ZHANG Jianhua , ZHOU Xiaoyang , GUO Xuting , DU Xinxin , AN Li , QIN Hao , LIU Yong , ZHANG Hong , XU Longchao . Carbon density distribution pattern and its factors of the artificial forest vegetation in opencast coal mine[J]. Arid Zone Research, 2024 , 41(6) : 974 -983 . DOI: 10.13866/j.azr.2024.06.07
表1 林分基本特征Tab. 1 Basic characteristics of the stands |
| 林型 | 采样点 | 纬度(N) | 经度(E) | 海拔/m | 林分密度/(株·hm-2) | 林龄/a | 胸径/cm | 树高/m |
|---|---|---|---|---|---|---|---|---|
| 小叶杨林PM | 西排 | 39°29′26.15″ | 112°18′55.30″ | 1469.00 | 2.13×10³ | 20 | 10.90 | 5.50 |
| 榆树林UP | 西排 | 39°29′28.64″ | 112°18′44.41″ | 1474.00 | 1.03×10³ | 20 | 12.90 | 5.50 |
| 油松林SPT | 西排 | 39°29′29.80″ | 112°18′46.49″ | 1471.00 | 1.47×10³ | 20 | 10.70 | 4.70 |
| 刺槐林RP | 西排 | 39°29′33.35″ | 112°18′44.08″ | 1474.00 | 2.03×10³ | 20 | 9.80 | 4.80 |
| 刺槐-榆树混交林RP-UP | 南排 | 39°27′41.45″ | 112°20′04.13″ | 1391.00 | 3.40×10³ | 30 | 7.20 | 4.60 |
| 油松林DPT | 南排 | 39°27′41.54″ | 112°20′05.26″ | 1384.00 | 3.43×10³ | 30 | 8.80 | 5.60 |
| 加拿大杨PC | 南排 | 39°27′59.82″ | 112°19′39.85″ | 1348.00 | 3.23×10³ | 30 | 7.20 | 5.90 |
注:SPT为密植油松林;DPT为疏植油松林;RP为刺槐林;UP为榆树林;RP-UP为刺槐-榆树混交林;PM为小叶杨;PC为加拿大杨。下同。 |
表2 乔木生物量相对生长方程Tab. 2 Relative growth equation of tree biomass |
| 树种 | 器官 | 回归方程 | 回归系数(R2) | 备注 |
|---|---|---|---|---|
| 刺槐RP | 根 | Y=0.1145 (D2H)0.6328 [29] | - | 胸径范围:2.7~20.6 cm 树高范围:2.2~7.0 m |
| 枝 | Y=0.02425(D2H)0.7908 [29] | - | ||
| 叶 | Y=0.0545(D2H)0.4574 [29] | - | ||
| 干 | Y=0.05527(D2H)0.8576 [29] | - | ||
| 油松PT | 根 | Y=0.340D0.839e0.082D[29] | 0.947 | 胸径范围:3.4~20.6 cm 树高范围:2.7~9.0 m |
| 枝 | Y=0.483D0.870e0.060D[29] | 0.944 | ||
| 叶 | Y=0.320D0.810e0.058D[29] | 0.959 | ||
| 干 | Y=1.373D0.465e0.113D[29] | 0.978 | ||
| 总 | Y=2.905D0.549e0.097D[29] | 0.971 | ||
| 榆树UP | 根 | Y=0.0146D2.893[30] | - | 胸径范围:4.7~20.7 cm 树高范围:2.5~9.0 m |
| 枝 | Y=0.0303D2.3445[30] | - | ||
| 叶 | Y=0.033D1.7241[30] | - | ||
| 干 | Y=0.0146D2.5837[30] | - | ||
| 小叶杨PM | 根 | Y=10.5723+0.0044(D2H)[31] | 0.6691 | 胸径范围:3.8~18.3 cm 树高范围:3.0~7.5 m |
| 枝 | Y=12.5405+0.0091(D2H)[31] | 0.5595 | ||
| 叶 | Y=6.5542+0.0014(D2H)[31] | 0.1971 | ||
| 干 | Y=0.4644(D2H)0.6455[31] | 0.7517 | ||
| 总 | Y=1.9729(D2H)0.5608[31] | 0.8064 | ||
| 加拿大杨PC | 根 | Y=10-0.8268(D2H)0.5798[32] | - | 胸径范围:2.2~10.8 cm 树高范围:2.5~10.0 m |
| 枝 | Y=10-0.7804(D2H)0.5321[32] | - | ||
| 叶 | Y=10-0.4701(D2H)0.3778[32] | - | ||
| 干 | Y=10-0.7143(D2H)0.6811[32] | - |
注:D为胸径;H为株高;D2H为基径平方与树高乘积。 |
表3 安太堡煤矿复垦区人工林碳密度及其分配比例Tab. 3 Carbon density and distribution proportion of plantations in Antaibao coal mine reclamation area |
| 组分 | 项目 | SPT | DPT | RP | UP | RP-UP | PM | PC |
|---|---|---|---|---|---|---|---|---|
| 乔木层 | 碳密度/(t·hm-2) | 18.24±1.56c | 30.08±3.27ab | 19.23±1.35c | 20.93±1.50bc | 21.61±3.19bc | 18.09±4.12c | 33.84±4.09a |
| 比例/% | 80.54 | 93.60 | 84.40 | 80.80 | 83.32 | 78.34 | 91.59 | |
| 灌木层 | 碳密度/(t·hm-2) | 0.03±0.01b | 0.06±0.03b | 0.13±0.002a | 0.001±0.001b | 0.13±0.04a | 0.01±0.01b | - |
| 比例/% | 0.12 | 0.01 | 0.06 | 0.56 | 0.51 | 0.15 | - | |
| 草本层 | 碳密度/(t·hm-2) | 0.09±0.02de | 0.03±0.003e | 0.29±0.01a | 0.23±0.02ab | 0.15±0.02cd | 0.18±0.03bc | 0.11±0.04cde |
| 比例/% | 0.39 | 1.04 | 0.82 | 1.23 | 0.57 | 0.09 | 0.29 | |
| 凋落物层 | 碳密度/(t·hm-2) | 4.29±0.11b | 8.22±0.16a | 4.14±0.33b | 1.20±0.14d | 4.05±0.24b | 3.15±0.20c | 3.00±0.03c |
| 比例/% | 18.95 | 5.36 | 14.71 | 17.41 | 15.60 | 21.42 | 8.13 | |
| 总计 | 碳密度/(t·hm-2) | 22.65±1.60b | 38.39±3.43a | 23.80±1.64b | 22.36±1.61b | 25.94±3.14b | 21.43±3.96b | 36.95±4.05a |
| 比例/% | 100 | 100 | 100 | 100 | 100 | 100 | 100 |
注:同行不同小写字母表示群落类型间LSD检验显著性差异分组(α=0.05)。 |
图1 乔木层各器官碳密度分配格局注:SPT为疏植油松林;DPT为密植油松林;RP为刺槐林;UP为榆树林;RP-UP为刺槐-榆树混交林;PM为小叶杨;PC为加拿大杨。下同。 Fig. 1 Carbon density proportion of overstory components |
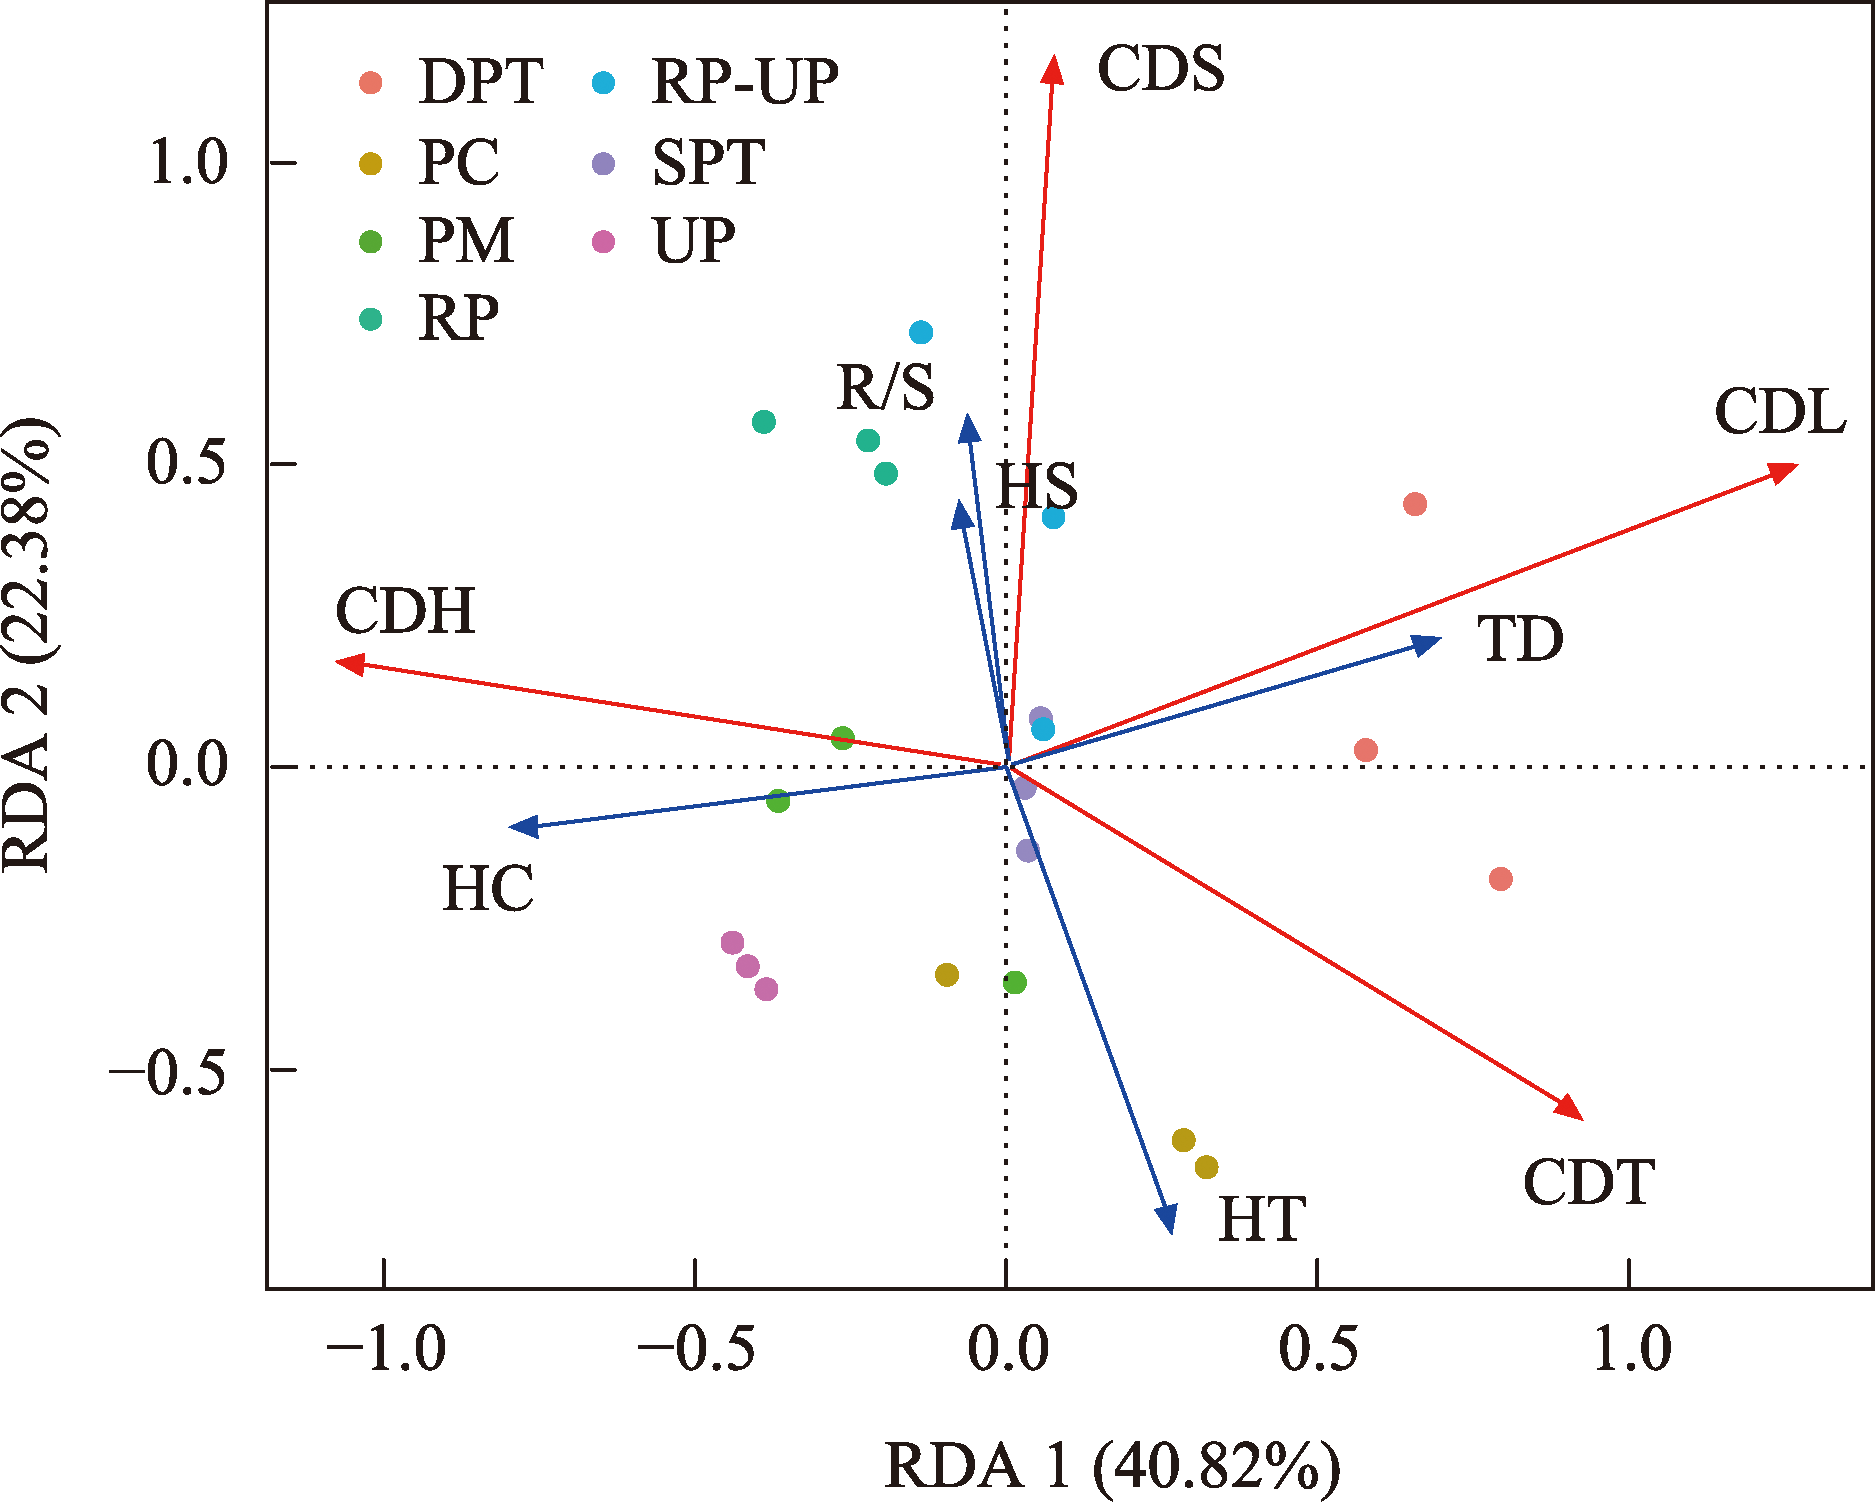
图4 人工林各组分碳密度与不同林分因子的相关关系注:CDT为乔木层碳密度;CDS为灌木层碳密度;CDH为草本层碳密度;CDL为凋落物层碳密度;HT为乔木高度;TD为林分密度;R/S为根冠比;HS为灌木高度;HH为草本高度;HC为草本盖度。下同。*、**、***分别代表在0.05、0.01和0.001水平上显著相关。 Fig. 4 Relationships between carbon density and different forest factors in artificial forests |
| [1] |
胡振琪, 赵艳玲. 矿山生态修复面临的主要问题及解决策略[J]. 中国煤炭, 2021, 47(9): 2-7.
[
|
| [2] |
王瑜, 张小平, 魏博微. 环境脆弱区大型露天煤矿开发与生态环保协调发展研究[J]. 中国煤炭, 2023, 49(S1): 15-23.
[
|
| [3] |
吕凯, 李雪飞, 智颖飙. 露天煤矿排土场生物修复与生态重建技术[J]. 内蒙古师范大学学报(自然科学汉文版), 2019, 48(5): 458-464.
[
|
| [4] |
杨勤学, 赵冰清, 郭东罡. 中国北方露天煤矿区植被恢复研究进展[J]. 生态学杂志, 2015, 34(4): 1152-1157.
[
|
| [5] |
刘英, 林家权, 岳辉, 等. 荒漠化矿区不同土地利用类型土壤呼吸及其影响因子[J]. 煤炭学报, 2023, 48(7): 2893-2905.
[
|
| [6] |
|
| [7] |
|
| [8] |
|
| [9] |
|
| [10] |
潘帅, 于澎涛, 王彦辉, 等. 六盘山森林植被碳密度空间分布特征及其成因[J]. 生态学报, 2014, 34(22): 6666-6677.
[
|
| [11] |
李智兰. 矿区复垦对土壤养分和酶活性以及微生物数量的影响[J]. 水土保持通报, 2015, 35(2): 6-13.
[
|
| [12] |
杨彦明, 刘景辉, 张铁毅, 等. 不同植被类型复垦对黑岱沟露天煤矿土壤理化性质的影响[J]. 可持续发展, 2017, 7(4): 240-247.
[
|
| [13] |
|
| [14] |
[
|
| [15] |
张建华, 张琨, 刘勇, 等. 山西省露天煤矿复垦区典型人工林凋落物持水性能研究[J]. 干旱区研究, 2023, 40(12): 2043-2052.
[
|
| [16] |
吕刚, 刘雅卓, 李叶鑫, 等. 海州露天煤矿排土场植被恢复的土壤水文效应评价[J]. 生态环境学报, 2017, 26(1): 67-72.
[
|
| [17] |
邓蕾. 黄土高原生态系统碳固持对植被恢复的响应机制[D]. 杨凌: 西北农林科技大学, 2014.
[
|
| [18] |
|
| [19] |
文月荣, 党廷辉, 唐骏, 等. 不同林地恢复模式下露天煤矿排土场土壤有机碳分布特征[J]. 应用生态学报, 2016, 27(1): 83-90.
[
|
| [20] |
陈浮, 朱燕峰, 马静, 等. 黄土高原矿区生态修复固碳机制与增汇潜力及调控[J]. 煤炭科学技术, 2023, 51(1): 502-513.
[
|
| [21] |
|
| [22] |
曹裕松, 吴风云, 肖宜安, 等. 退耕还林对土壤养分含量及其垂直分布的影响[J]. 生态环境学报, 2016, 25(2): 196-201.
[
|
| [23] |
石磊娜. 榆树用于北京山区建筑工程施工大气污染修复的可行性论述[J]. 科技创新导报, 2020, 17(31): 91-94.
[
|
| [24] |
范明彦, 田丽慧, 周海. 微地形对高寒固沙植物水分利用特征的影响[J]. 干旱区研究, 2024, 41(1): 60-70.
[
|
| [25] |
郭春燕, 李晋川, 岳建英, 等. 安太堡露天煤矿复垦区不同人工林土壤呼吸特征[J]. 水土保持通报, 2015, 35(3): 55-61.
[
|
| [26] |
张青, 毕润成, 吴兆飞, 等. 安太堡露天煤矿植被恢复区物种天然更新时空动态[J]. 生态学杂志, 2016, 35(12): 3223-3232.
[
|
| [27] |
李晋川, 白中科, 柴书杰, 等. 平朔露天煤矿土地复垦与生态重建技术研究[J]. 科技导报, 2009(17): 30-34.
[
|
| [28] |
耿冰瑾, 王舒菲, 曹银贵, 等. 山西平朔露天矿区不同年限复垦地植被重建特征对比分析[J]. 生态学报, 2022, 42(8): 3400-3419.
[
|
| [29] |
王宁, 富丰珍. 山西森林生态系统碳储量研究[M]. 北京: 中国农业科学技术出版社, 2015.
[
|
| [30] |
原野. 典型露天煤矿复垦生态系统碳固存研究: 机理与效应——以平朔露天矿为例[D]. 北京: 中国地质大学, 2018.
[
|
| [31] |
高阳. 黄土高原地区林草生态系统碳密度和碳储量研究[D]. 杨陵: 西北农林科技大学, 2014.
[
|
| [32] |
苏向阳. 潮白河实验林场规划设计资料选编(二)—加杨生物量的初步研究[J]. 林业资源管理, 1981(4): 52-55.
[
|
| [33] |
方精云, 郭兆迪, 朴世龙, 等. 1981—2000年中国陆地植被碳汇的估算[J]. 中国科学, 2007, 37(6): 804-812.
[
|
| [34] |
孙丽娜. 山西省森林生物量碳密度空间格局和影响因素研究[D]. 太原: 山西大学, 2020.
[
|
| [35] |
李海奎, 雷渊才. 中国森林植被生物量和碳储量评估[M]. 北京: 中国林业出版社, 2010.
[
|
| [36] |
FAO. Global forest resources assessment 2010. Rome (available at http://www.fao.org/forestry/fra/fra2010/en/
|
| [37] |
|
| [38] |
张耀, 周伟. 安太堡露天矿区复垦地植被覆盖度反演估算研究[J]. 中南林业科技大学学报, 2016, 36(11): 113-119.
[
|
| [39] |
郭春燕, 曹银贵, 武玉珍, 等. 安太堡露天煤矿刺槐人工林乔木层碳密度动态特征[J]. 山西大学学报(自然科学版), 2022, 45(2): 487-493.
[
|
| [40] |
李叶鑫, 吕刚, 刁立夫, 等. 露天煤矿排土场不同植被类型持水能力评价[J]. 水土保持学报, 2017, 31(5): 309-314, 320.
[
|
| [41] |
朱嘉磊, 田菊, 孙宾, 等. 北京市松山天然油松林生态系统的碳储量[J]. 水土保持通报, 2016, 36(5): 320-325.
[
|
| [42] |
丁壮, 崔若光. 红松人工林生物量碳密度[J]. 东北林业大学学报, 2018, 46(2): 17-21.
[
|
| [43] |
刘国华, 傅伯杰, 方精云. 中国森林碳动态及其对全球碳平衡的贡献[J]. 生态学报, 2000, 20(5): 733-740.
[
|
| [44] |
孙丽娜, 范晓辉, 王孟本. 山西森林植被碳储量空间分布格局[J]. 山西大学学报(自然科学版), 2018, 41(1): 226-232.
[
|
| [45] |
高述超, 陈毅青, 陈宗铸, 等. 海南岛森林生态系统碳储量及其空间分布特征[J]. 生态学报, 2023, 43(9): 3558-3570.
[
|
| [46] |
|
| [47] |
|
| [48] |
朱万泽, 盛哲良, 舒树淼, 等. 川西亚高山天然次生林生态功能恢复综合评价[J]. 应用与环境生物学报, 2021, 27(3): 694-704.
[
|
| [49] |
|
| [50] |
|
| [51] |
雷海清, 孙高球, 郑得利. 温州市森林生态系统碳储量研究[J]. 南京林业大学学报(自然科学版), 2022, 46(5): 20-22.
[
|
| [52] |
程小琴, 韩海荣, 康峰峰. 山西油松人工林生态系统生物量、碳积累及其分布[J]. 生态学杂志, 2012, 31(10): 2455-2460.
[
|
| [53] |
曹小玉, 杨文龙, 刘悦翠. 马尾松林生态系统碳贮量研究[J]. 西北林学院学报, 2012, 27(5): 45-49, 145.
[
|
| [54] |
王丽美, 姜永涛, 郭广猛. 森林生物量的根冠分配特征及其影响因子分析[J]. 南阳师范学院学报, 2020, 19(1): 44-50.
[
|
/
| 〈 |
|
〉 |