
Characteristics of the spatial and temporal evolution of Gross Primary Productivity and its influencing factors in China’s drylands
Received date: 2023-11-13
Revised date: 2024-03-15
Online published: 2025-08-12
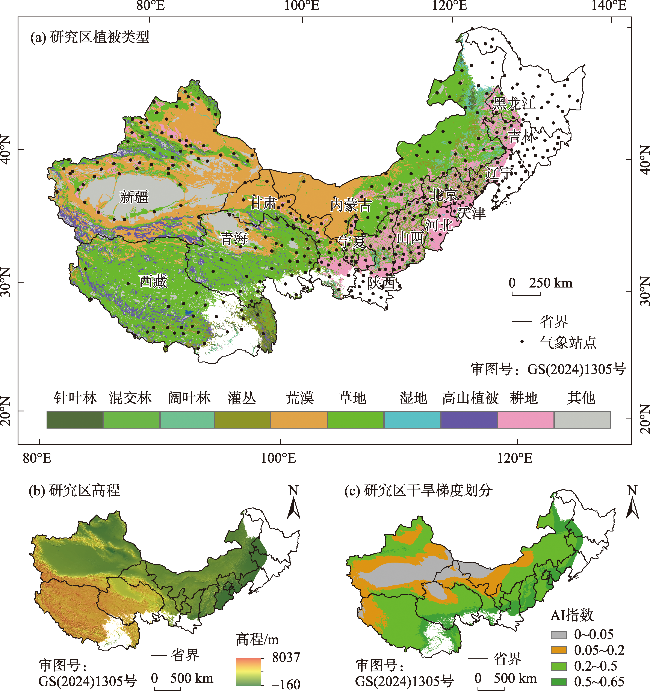
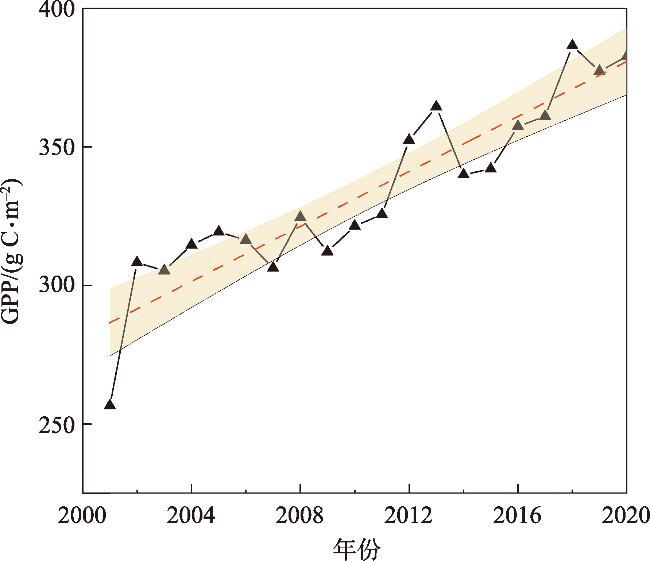
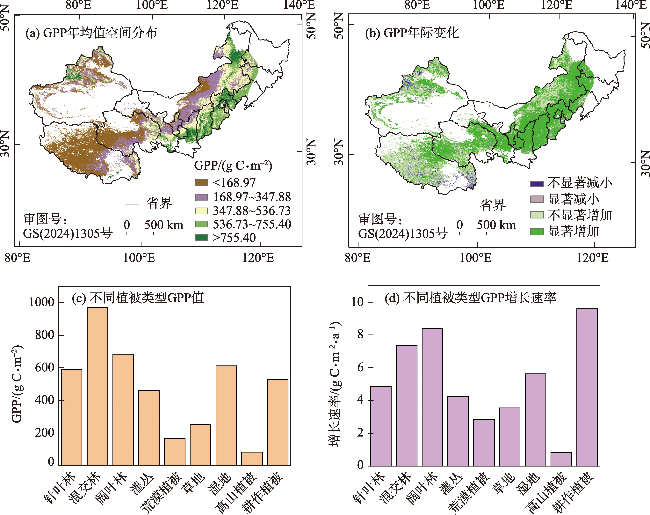
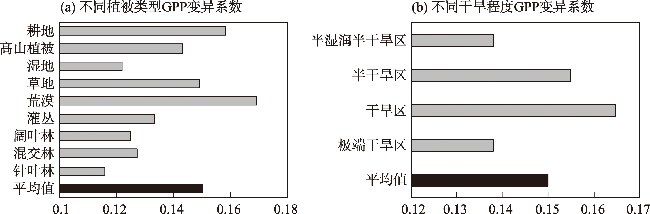
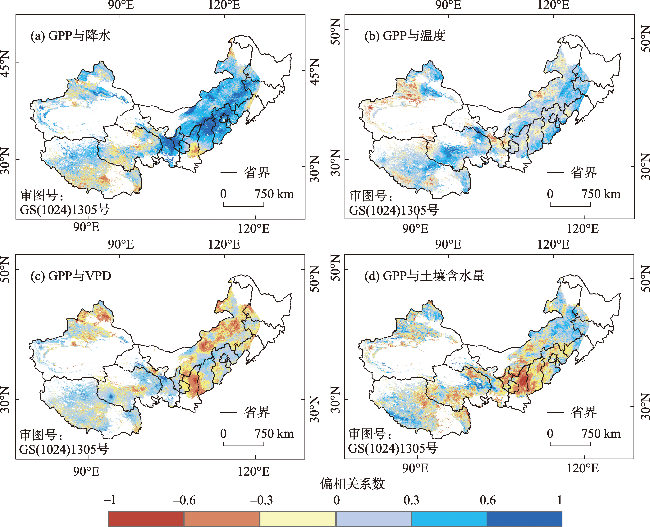
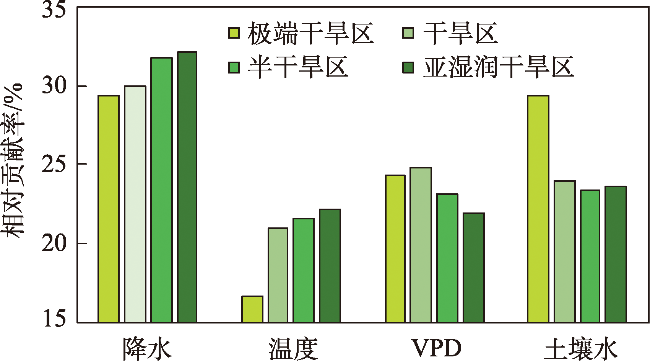
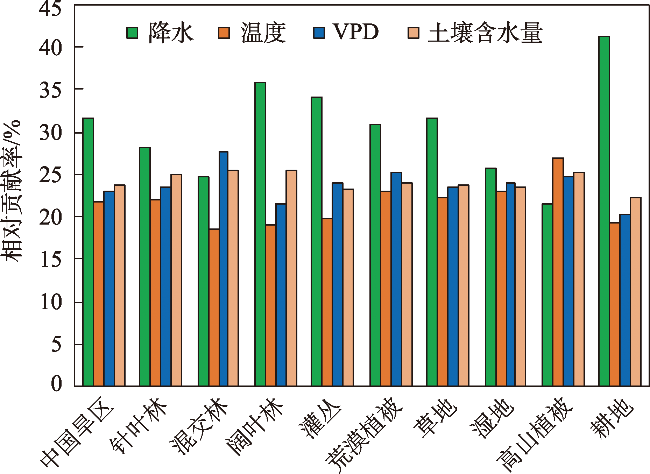
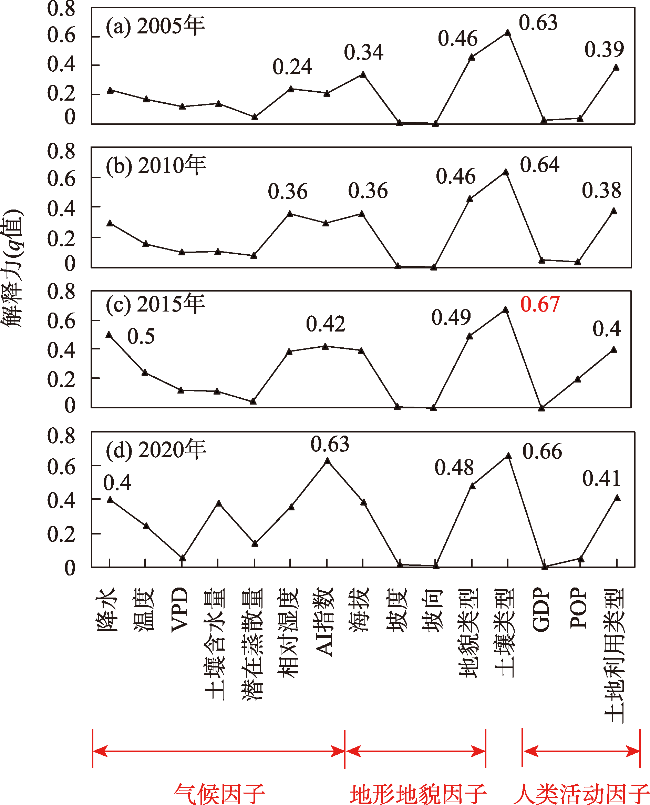
This study aimed to clarify the carbon sequestration capacity and its change mechanisms in the drylands of China. The study used the AI index to delineate the extent of drylands. Based on the MODIS Vegetation Gross Primary Productivity (GPP) dataset, the temporal and spatial characteristics of vegetation carbon sequestration capacity in China’s drylands from 2001 to 2020 were investigated. This investigation considered meteorological data, including temperature, precipitation, Vapor Pressure Deficit (VPD), soil water content, and human activities such as land use. The results reveal the following: (1) Over the 20 year period, GPP in China’s drylands elevated significantly in 64.72% of the regions. (2) Temperature had the lowest impact on GPP, with a relative contribution rate of 21.70%. Precipitation and soil water content emerged as the dominant factors driving GPP growth, with their combined contribution rate exceeding 55%. As drought intensified, the effect of water stress gradually strengthened. In different vegetation types, except for mixed forests and alpine vegetation, precipitation was the most critical climate factor influencing GPP changes. (3) Differences in soil and landform types were the dominant factors influencing the spatial variation of GPP. Moisture and land use type factors also played important roles, with the explanatory power of the interaction between any two factors exceeding that of a single factor. The interaction between soil type and the other factors was particularly remarkable. The study’s findings hold essential theoretical implications for a deeper understanding of the evolution characteristics of carbon sinks in arid ecosystems in China and their response mechanisms to external environmental factors.
TANG Kexin , GUO Jianbin , HE Liang , CHEN Lin , WAN Long . Characteristics of the spatial and temporal evolution of Gross Primary Productivity and its influencing factors in China’s drylands[J]. Arid Zone Research, 2024 , 41(6) : 964 -973 . DOI: 10.13866/j.azr.2024.06.06
表1 GPP空间格局的因子交互解释力等级排序Tab. 1 Ranking of interaction explanatory power, 2005, 2010, 2015 and 2020 |
| 年份 | 交互解释力排序(前10) |
|---|---|
| 2005年 | 土壤类型∩地貌类型=0.760>土壤类型∩降水=0.726>土地利用类型∩土壤类型=0.725>土壤类型∩海拔=0.719>土壤类型∩AI指数=0.716=土壤类型∩相对湿度=0.716 >VPD∩土壤类型=0.696>土壤类型∩温度=0.689>土壤类型∩土壤含水量=0.687 |
| 2010年 | 土壤类型∩地貌类型=0.760>土壤类型∩相对湿度=0.744>土地利用类型∩土壤类型=0.728>土壤类型∩海拔=0.725>土壤类型∩AI指数=0.724>土壤类型∩降水=0.722>土壤类型∩温度=0.703>土壤类型∩海拔=0.743>土壤类型∩VPD=0.697>土壤类型∩土壤含水量=0.695 |
| 2015年 | 土壤类型∩地貌类型=0.787>土壤类型∩AI指数=0.785> 土壤类型∩相对湿度=0.780>土壤类型∩降水=0.779>地貌类型∩海拔=0.752> 温度∩土壤类型=0.724>土壤类型∩VPD=0.721>土壤类型∩潜在蒸散发=0.714>土壤类型∩土壤含水量=0.713> 地貌类型∩降水=0.710>地貌类型∩AI指数=0.705 |
| 2020年 | 土壤类型∩AI指数=0.839>地貌类型∩AI指数=0.786>地貌类型∩土壤类型=0.776>土壤类型∩土壤含水量=0.765>土壤类型∩降水=0.764>AI指数∩海拔=0.757>土壤类型∩相对湿度=0.756>土壤类型∩土地利用类型=0.750>土壤类型∩海拔=0.740>土壤类型∩温度=0.717 |
表2 2001年、2020年土地转移矩阵Tab. 2 2001, 2020 land transfer matrix /km2 |
| 2020年 | 2001年 | ||||||||
|---|---|---|---|---|---|---|---|---|---|
| 建筑用地 | 草地 | 耕地 | 灌丛 | 林地 | 裸地 | 湿地 | 水体 | 冰/雪地 | |
| 建筑用地 | 36479.1 | 5875.9 | 21965.2 | 1.9 | 289.8 | 1880.0 | 0 | 1327.5 | 0 |
| 草地 | 281.7 | 2226644 | 84251.6 | 1826.8 | 5502.1 | 118799 | 63.8 | 2462.6 | 830.2 |
| 耕地 | 39.6 | 33231.4 | 8284.5 | 1633.6 | 234645 | 29.6 | 4.4 | 111.6 | 10.2 |
| 灌丛 | 0 | 925.9 | 17.4 | 2082.1 | 793.9 | 0 | 0 | 0.1 | 0 |
| 林地 | 2713.2 | 87477.7 | 479383 | 38.8 | 4932.5 | 13465.6 | 23.7 | 1829 | |
| 裸地 | 54.0 | 92851.3 | 1482.38 | 0 | 11.0 | 1761150 | 16.8 | 1849.2 | 8287.2 |
| 湿地 | 0 | 267.6 | 16.3 | 0 | 0.8 | 12.2 | 485.6 | 4.7 | 0.2 |
| 水体 | 589.6 | 6088.0 | 2688.4 | 0.1 | 46.8 | 9125.8 | 24.3 | 53631.8 | 619.5 |
| 冰/雪地 | 0 | 889.6 | 0.03 | 0 | 0.2 | 8902.8 | 0.1 | 70.0 | 44194.3 |
| [1] |
刘坤, 张慧, 孔令辉, 等. 陆地生态系统碳汇评估方法研究进展[J]. 生态学报, 2023, 43(10): 4294-4307.
[
|
| [2] |
陶波, 葛全胜, 李克让, 等. 陆地生态系统碳循环研究进展[J]. 地理研究, 2001, 20(5): 564-575.
[
|
| [3] |
赵宁, 周蕾, 庄杰, 等. 中国陆地生态系统碳源/汇整合分析[J]. 生态学报, 2021, 41(19): 7648-7658.
[
|
| [4] |
|
| [5] |
乌日娜, 刘步云, 包玉海. 干旱对中国北方草原总初级生产力影响的时滞和累积效应[J]. 干旱区研究, 2023, 40(10): 1644-1660.
[
|
| [6] |
杨丹, 王晓峰. 黄土高原气候和人类活动对植被NPP变化的影响[J]. 干旱区研究, 2022, 39(2): 584-593.
[
|
| [7] |
|
| [8] |
|
| [9] |
许丽. 气候变化和植被变绿对中国北方旱区土壤水分动态的影响机制[D]. 西安: 长安大学, 2023.
[
|
| [10] |
|
| [11] |
|
| [12] |
林小丁, 常乐, 冯丹. 2000—2019年青海地区植被总初级生产力遥感估算及时空变化分析[J]. 草业学报, 2021, 30(6): 16-27.
[
|
| [13] |
宋进喜, 齐贵增, 佘敦先, 等. 中国植被生产力对干湿变化的响应[J]. 地理学报, 2023, 78(7): 1764-1778.
[
|
| [14] |
|
| [15] |
高振翔, 叶剑, 丁仁惠, 等. 中国植被总初级生产力对气候变化的响应[J]. 水土保持研究, 2022, 29(4): 394-399, 414.
[
|
| [16] |
|
| [17] |
茆杨, 蒋勇军, 张彩云, 等. 近20年来西南地区植被净初级生产力时空变化与影响因素及其对生态工程响应[J]. 生态学报, 2022, 42(7): 2878-2890.
[
|
| [18] |
唐希颖, 武红, 董金玮, 等. 沙化和退化状态对甘南草地生态系统固碳的影响[J]. 生态学杂志, 2022, 41(2): 278-286.
[
|
| [19] |
王娟, 王钊, 郭斌, 等. 陕西黄河流域植被碳利用率时空特征及对气候的敏感性研究[J]. 干旱区研究, 2023, 40(12): 1959-1968.
[
|
| [20] |
范双萍. 甘肃陇中地区近55年潜在蒸散量及干旱指数演变趋势[J]. 地球环境学报, 2018, 9(2): 172-181.
[
|
| [21] |
|
| [22] |
许丽, 高光耀, 王晓峰, 等. 气候变化和人类活动对中国北方旱区植被变绿的定量贡献[J]. 生态学报, 2023, 43(17): 7274-7283.
[
|
| [23] |
|
| [24] |
|
| [25] |
王永锋, 靖娟利, 马炳鑫. 滇黔桂岩溶区ET时空特征及气候因子驱动[J]. 水土保持研究, 2022, 29(5): 235-243.
[
|
| [26] |
|
| [27] |
|
| [28] |
陈雪萍, 赵学勇, 张晶, 等. 基于地理探测器的科尔沁沙地植被NDVI时空变化特征及其驱动因素[J]. 植物生态学报, 2023, 47(8): 1082-1093.
[
|
| [29] |
张玉. 退耕还林政策增汇效果的测度模型、空间分异及影响因素分析[D]. 杨凌: 西北农林科技大学, 2023.
[
|
| [30] |
张雷明, 上官周平. 黄土高原土壤水分与植被生产力的关系[J]. 干旱区研究, 2002, 19(4): 59-63.
[
|
| [31] |
石志华, 刘梦云, 吴健力, 等. 基于CASA模型的陕西省植被净初级生产力时空分析[J]. 水土保持通报, 2016, 36(1): 206-211.
[
|
| [32] |
刘洪顺, 布仁仓, 王正文, 等. 辽西北沙化土地植被生产力关键影响因素[J]. 应用生态学报, 2024, 35(1): 49-54.
[
|
| [33] |
|
/
| 〈 |
|
〉 |