
Sustainable dynamics and driving factors of the global virtual water trade in crops
Received date: 2024-11-29
Revised date: 2024-12-25
Online published: 2025-08-12
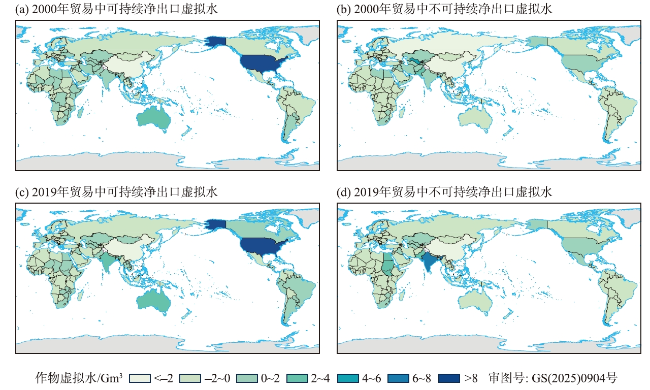
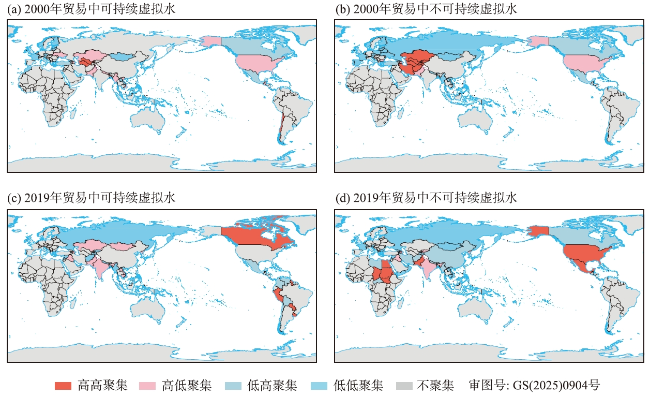
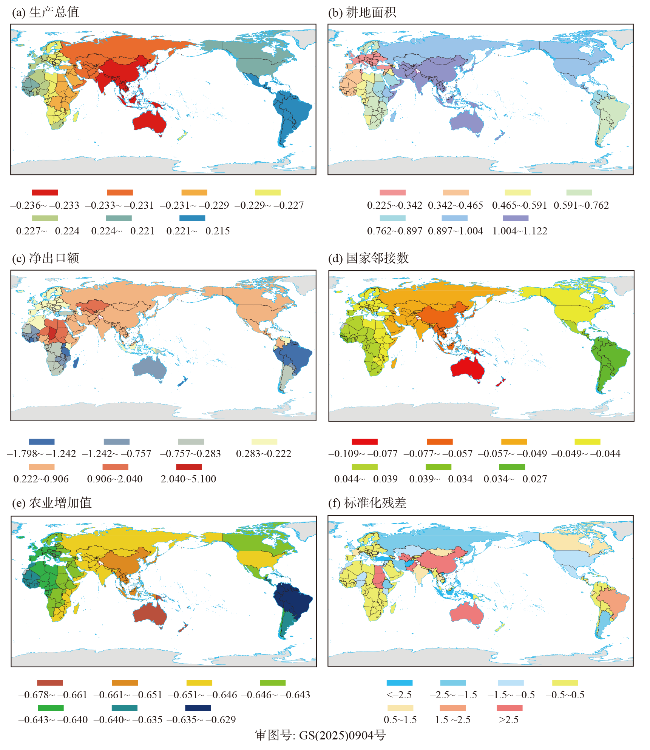
Incorporating agricultural irrigation water into the global trade chain and determining its sustainability is vital for ensuring water and food security. However, the issue of sustainability in the virtual water of crop trade has received limited attention, due to the conflict between economic benefits and water resource utilization. Thus, based on the crop production and trade matrix data from the Food and Agriculture Organization, this study conducted physical trade flow and spatial correlation analyses as well as multiscale geographically weighted regression to systematically analyze the spatiotemporal distribution, the spatial correlation characteristics, and the driving factors of net exported virtual water sustainability in global crop trade from 2000 to 2019. Based on the findings, the sustainable and unsustainable net exported virtual water volumes in global crop trade (especially cotton) exhibited a fluctuating upward trend (approximately 0.20 Gm3 per year) over the past two decades. However, due to agricultural technological advancements, the proportion of unsustainable virtual water in the total virtual water trade volume decreased from 42.31% to 41.40%. Although the spatial analysis revealed considerable spatial clustering of unsustainable net exported virtual water volumes between 2000 and 2009, as shown by global and local Moran’s I statistics, this clustering trend weakened and became more dispersed over the past decade. Moreover, the increase in net exported virtual water was mainly driven by changes in cultivated land area, with agricultural value-added having a significant negative impact on virtual water in trade. Overall, these results highlight the importance of implementing stringent food security policies in order to facilitate the sustainable development of the global virtual water trade in crops and to further reduce the proportion of unsustainable water use.
Key words: global; crops; virtual water; sustainability; driving factors
DI Yanfeng , DUAN Weili , ZHOU Yiqi , HE Chao . Sustainable dynamics and driving factors of the global virtual water trade in crops[J]. Arid Zone Research, 2025 , 42(6) : 993 -1003 . DOI: 10.13866/j.azr.2025.06.04
表1 本研究选取的35种农作物种类Tab. 1 35 selected crop types in this study |
| FAO 编码 | 作物 名称 | 作物 类别 | FAO 编码 | 作物 名称 | 作物 类别 |
|---|---|---|---|---|---|
| 15 | 小麦 | 谷物 | 242 | 生花生 | 油料作物 |
| 27 | 大米 | 谷物 | 249 | 椰子 | 油料作物 |
| 56 | 玉米 | 谷物 | 254 | 油棕果 | 油料作物 |
| 44 | 大麦 | 谷物 | 267 | 葵花籽 | 油料作物 |
| 79 | 小米 | 谷物 | 270 | 油菜籽 | 油料作物 |
| 83 | 高粱 | 谷物 | 289 | 芝麻籽 | 油料作物 |
| 116 | 土豆 | 根茎类 | 328 | 棉花 | 纤维作物 |
| 122 | 红薯 | 根茎类 | 656 | 生咖啡 | 兴奋剂类作物 |
| 137 | 山药 | 根茎类 | 661 | 可可豆 | 兴奋剂类作物 |
| 125 | 木薯 | 根茎类 | 667 | 茶叶 | 兴奋剂类作物 |
| 156 | 甘蔗 | 糖类作物 | 486 | 香蕉 | 水果 |
| 157 | 甜菜根 | 糖类作物 | 489 | 大蕉 | 水果 |
| 176 | 干豆 | 豆类 | 512 | 柑橘 | 水果 |
| 191 | 干鹰嘴豆 | 豆类 | 388 | 番茄 | 蔬菜 |
| 195 | 干豇豆 | 豆类 | 403 | 洋葱 | 蔬菜 |
| 197 | 干鸽豆 | 豆类 | 826 | 烟草 | 其他作物 |
| 201 | 干扁豆 | 豆类 | 836 | 橡胶 | 其他作物 |
| 236 | 大豆 | 油料作物 |
表2 农作物贸易虚拟水驱动因素指标选取Tab. 2 Selection of indicators for drivers of virtual water in crop trade |
| 维度 | 序号 | 指标 | 单位 |
|---|---|---|---|
| 经济因素 | 1 | 国内生产总值 | $ |
| 2 | 消费者物价指数 | - | |
| 3 | 农林渔业增加值 | $ | |
| 社会因素 | 4 | 物流绩效指数 | - |
| 5 | 商品净出口总额 | $ | |
| 6 | 总人口 | - | |
| 自然因素 | 7 | 耕地面积 | hm2 |
| 8 | 森林面积 | km2 | |
| 9 | 人均可再生内陆淡水资源量 | m3 | |
| 10 | 水资源压力水平 | - | |
| 地理因素 | 11 | 是否为内陆国 | - |
| 12 | 国家邻接数 | - |
表3 2000—2019年全球农作物贸易净出口虚拟水Moran’s I估计值Tab. 3 Estimated Moran’s I values for net exports of virtual crop trade water from 2000 to 2019 |
| 指标 | 指数 | 2000年 | 2004年 | 2009年 | 2014年 | 2019年 |
|---|---|---|---|---|---|---|
| 农作物可持续净出口虚拟水 | Moran’s I值 | 0.00 | 0.00 | 0.00 | 0.00 | 0.00 |
| Z得分 | -0.18 | -0.16 | 0.38 | 0.36 | -0.08 | |
| P值 | 0.57 | 0.56 | 0.35 | 0.36 | 0.53 | |
| 农作物不可持续净出口虚拟水 | Moran’s I值 | 0.14 | 0.10 | 0.09 | 0.06 | 0.04 |
| Z得分 | 5.58 | 3.90 | 4.29 | 2.48 | 1.66 | |
| P值 | 0.00 | 0.00 | 0.00 | 0.01 | 0.05 |
表4 MGWR模型与线性回归模型结果对比Tab. 4 Comparison of MGWR Model and Linear Regression Model Results |
| R2 | 调整R2 | AIC | |
|---|---|---|---|
| OLS | 0.74 | 0.72 | 465.88 |
| MGWR | 0.83 | 0.80 | 289.00 |
| [1] |
|
| [2] |
徐东来, 孙秀秀, 李文良, 等. 自然变化和人类活动影响下区域虚拟水贸易定量分析[J]. 人民黄河, 2023, 45(9): 90-95.
[
|
| [3] |
邓光耀, 毛颖. 黄河流域虚拟水贸易核算及影响因素研究[J]. 人民黄河, 2024, 46(4): 68-72, 85.
[
|
| [4] |
|
| [5] |
沈晓梅, 孔千慧, 于欣鑫, 等. 长三角地区农业虚拟水流动格局研究——基于水资源拓展的多地区投入产出分析[J]. 中国农村水利水电, 2023(9): 17-25.
[
|
| [6] |
孙才志, 张佳亮. 中国与“一带一路”沿线国家农产品贸易的水资源压力效应[J]. 水利水电科技进展, 2023, 43(4): 1-8.
[
|
| [7] |
|
| [8] |
王宁, 董小刚, 钟耀, 等. 陕西省虚拟水产业配置及省际贸易时空变化[J]. 人民黄河, 2023, 45(3): 66-72.
[
|
| [9] |
洪思扬, 王红瑞, 程涛, 等. 国际及省际贸易视角下的中国虚拟水和隐含能源流通规律分析[J]. 地理科学, 2022, 42(10): 1735-1746.
[
|
| [10] |
|
| [11] |
韩宇平, 李想, 苏潇雅, 等. 基于多区域投入产出模型的京津冀地区虚拟水贸易分析[J]. 华北水利水电大学学报(自然科学版), 2022, 43(5): 45-52.
[
|
| [12] |
王珊珊, 刘小慧. 新发展理念下安徽省虚拟水贸易测算与分析[J]. 黑龙江工程学院学报, 2022, 36(3): 51-58.
[
|
| [13] |
刘叶, 张馨戈, 王镇岳. 河南省农产品虚拟水贸易发展水平测度及其驱动因素分析[J]. 华北水利水电大学学报(自然科学版), 2022, 43(4): 29-35.
[
|
| [14] |
杨晨, 马育军, 谢婷. 基于粮食作物的广州市虚拟水贸易研究[J]. 水文, 2022, 42(4): 96-100, 107.
[
|
| [15] |
杨婷婷, 张雪妮, 高翔, 等. 中国粮食省份间流通及对虚拟水土资源的影响[J]. 草业科学, 2022, 39(8): 1686-1697.
[
|
| [16] |
谢维维, 马忠. 黄河流域9个省(区)虚拟水流动格局及趋势研究[J]. 人民黄河, 2022, 44(10): 78-83.
[
|
| [17] |
|
| [18] |
|
| [19] |
|
| [20] |
|
| [21] |
|
| [22] |
|
| [23] |
|
| [24] |
|
| [25] |
|
| [26] |
|
| [27] |
|
| [28] |
|
| [29] |
|
| [30] |
|
| [31] |
|
| [32] |
|
| [33] |
|
| [34] |
|
| [35] |
|
| [36] |
杨春, 韩正清. 农产品虚拟水实证研究——基于中国30个省市区主要农作物生产、消费、贸易数据[J]. 重庆工商大学学报(社会科学版), 2016, 33(3): 25-31.
[
|
| [37] |
|
| [38] |
|
| [39] |
|
| [40] |
|
| [41] |
|
| [42] |
|
| [43] |
|
| [44] |
|
| [45] |
|
| [46] |
|
| [47] |
|
| [48] |
|
| [49] |
|
| [50] |
朱启荣, 孙雪洁, 杨媛媛. 虚拟水视角下中国农产品进出口贸易节水问题研究[J]. 世界经济研究, 2016, 32(1): 87-98.
[
|
/
| 〈 |
|
〉 |