Weather and Climate

Simulation of climate characteristics in the Qinghai-Tibet Plateau by regional climate models at different horizontal resolutions

  • WANG Xueying , 1, 2 ,
  • GU Huanghe , 1, 2 ,
  • DAI Bin 3 ,
  • ZHANG Hanwen 3 ,
  • YU Zhongbo 1, 2
Expand
  • 1. State Key Laboratory of Hydrology-Water Resources and Hydraulic Engineering, Hohai University, Nanjing 210098, Jiangsu, China
  • 2. College of Hydrology and Water Resources, Hohai University, Nanjing 210098, Jiangsu, China
  • 3. Shanghai Investigation, Design and Research Institute Co., Ltd., Shanghai 200335, China

Received date: 2023-10-18

  Revised date: 2023-12-24

  Online published: 2024-06-20

Abstract

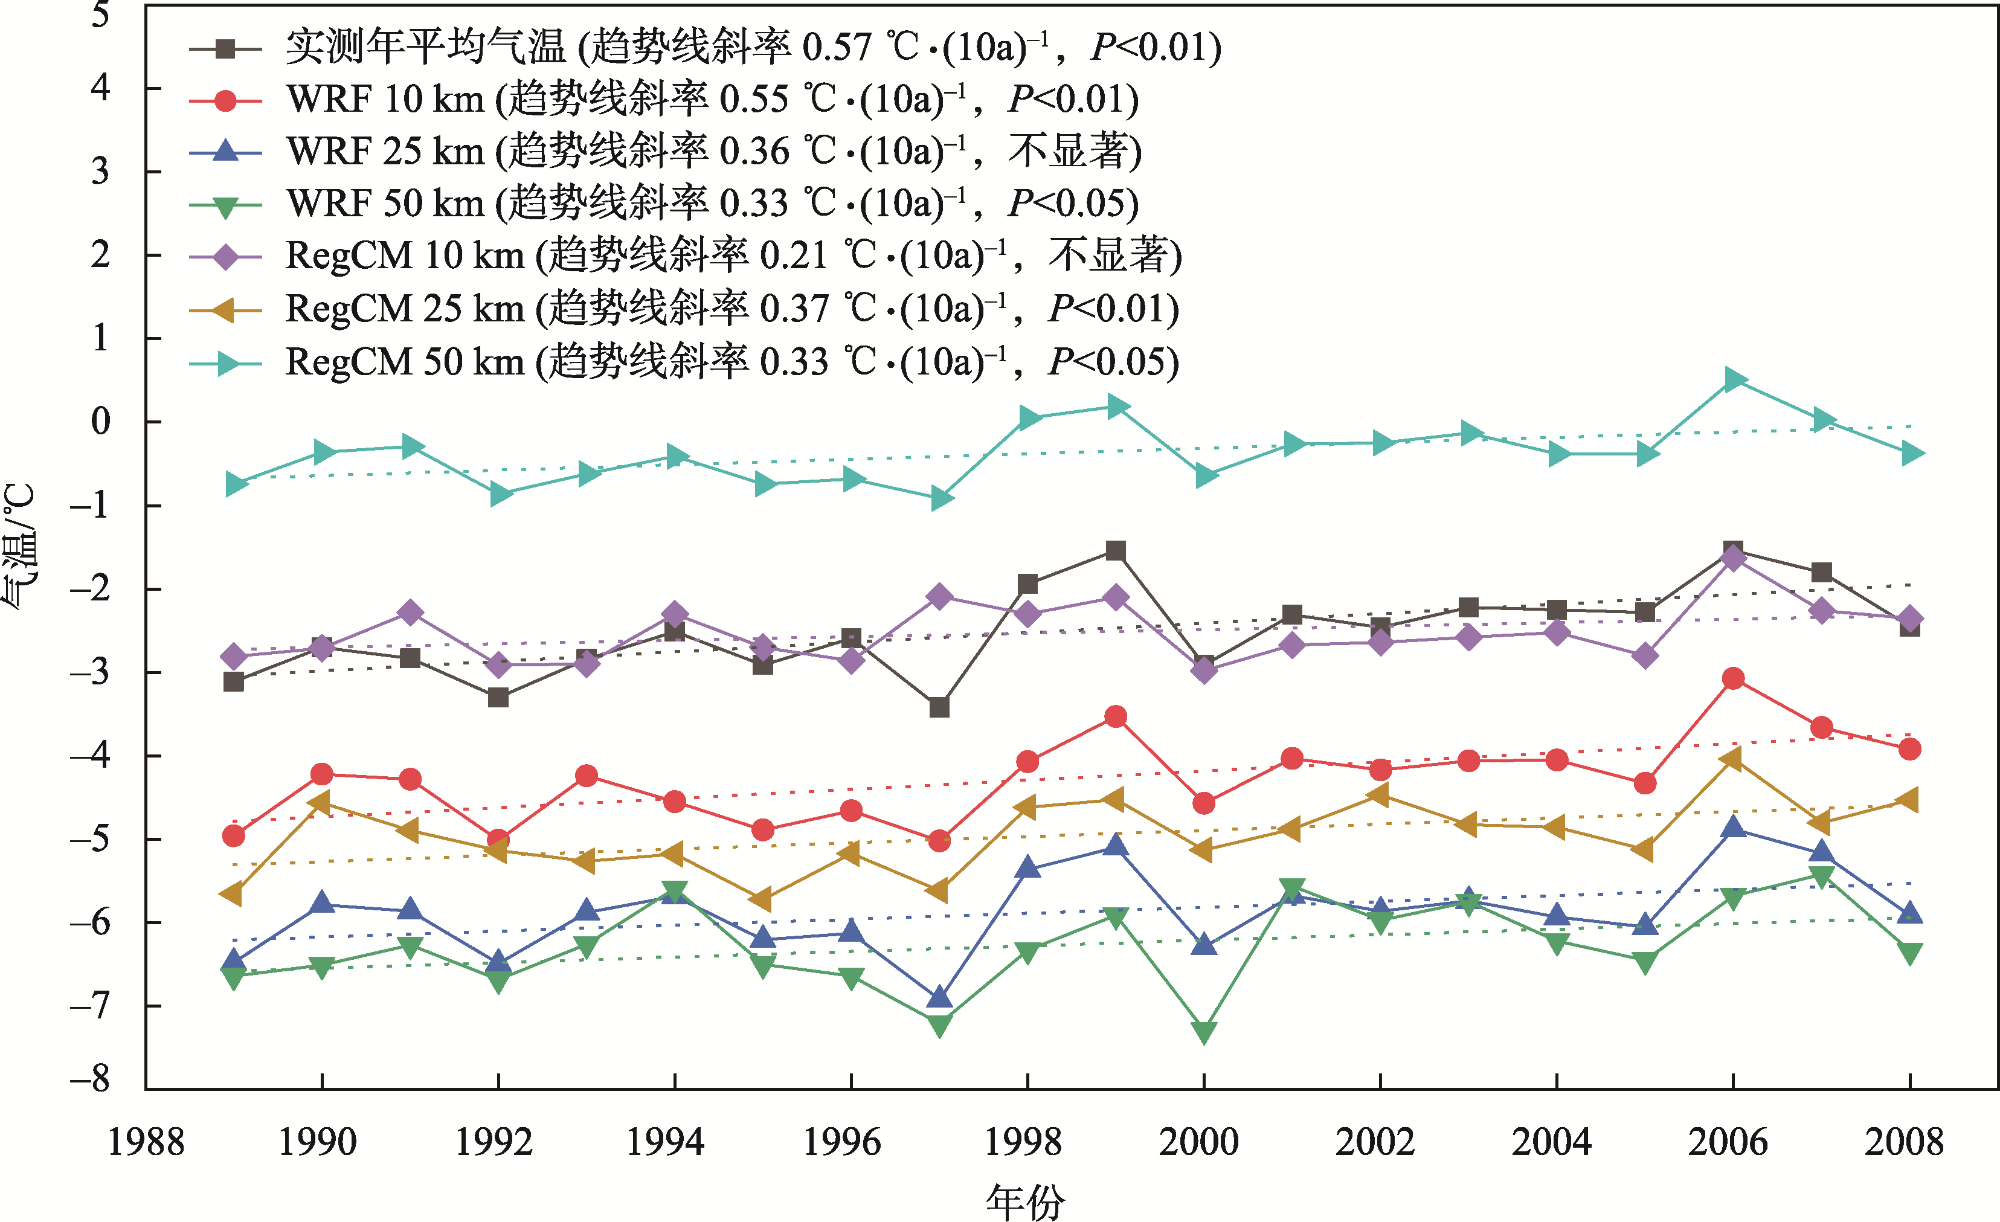
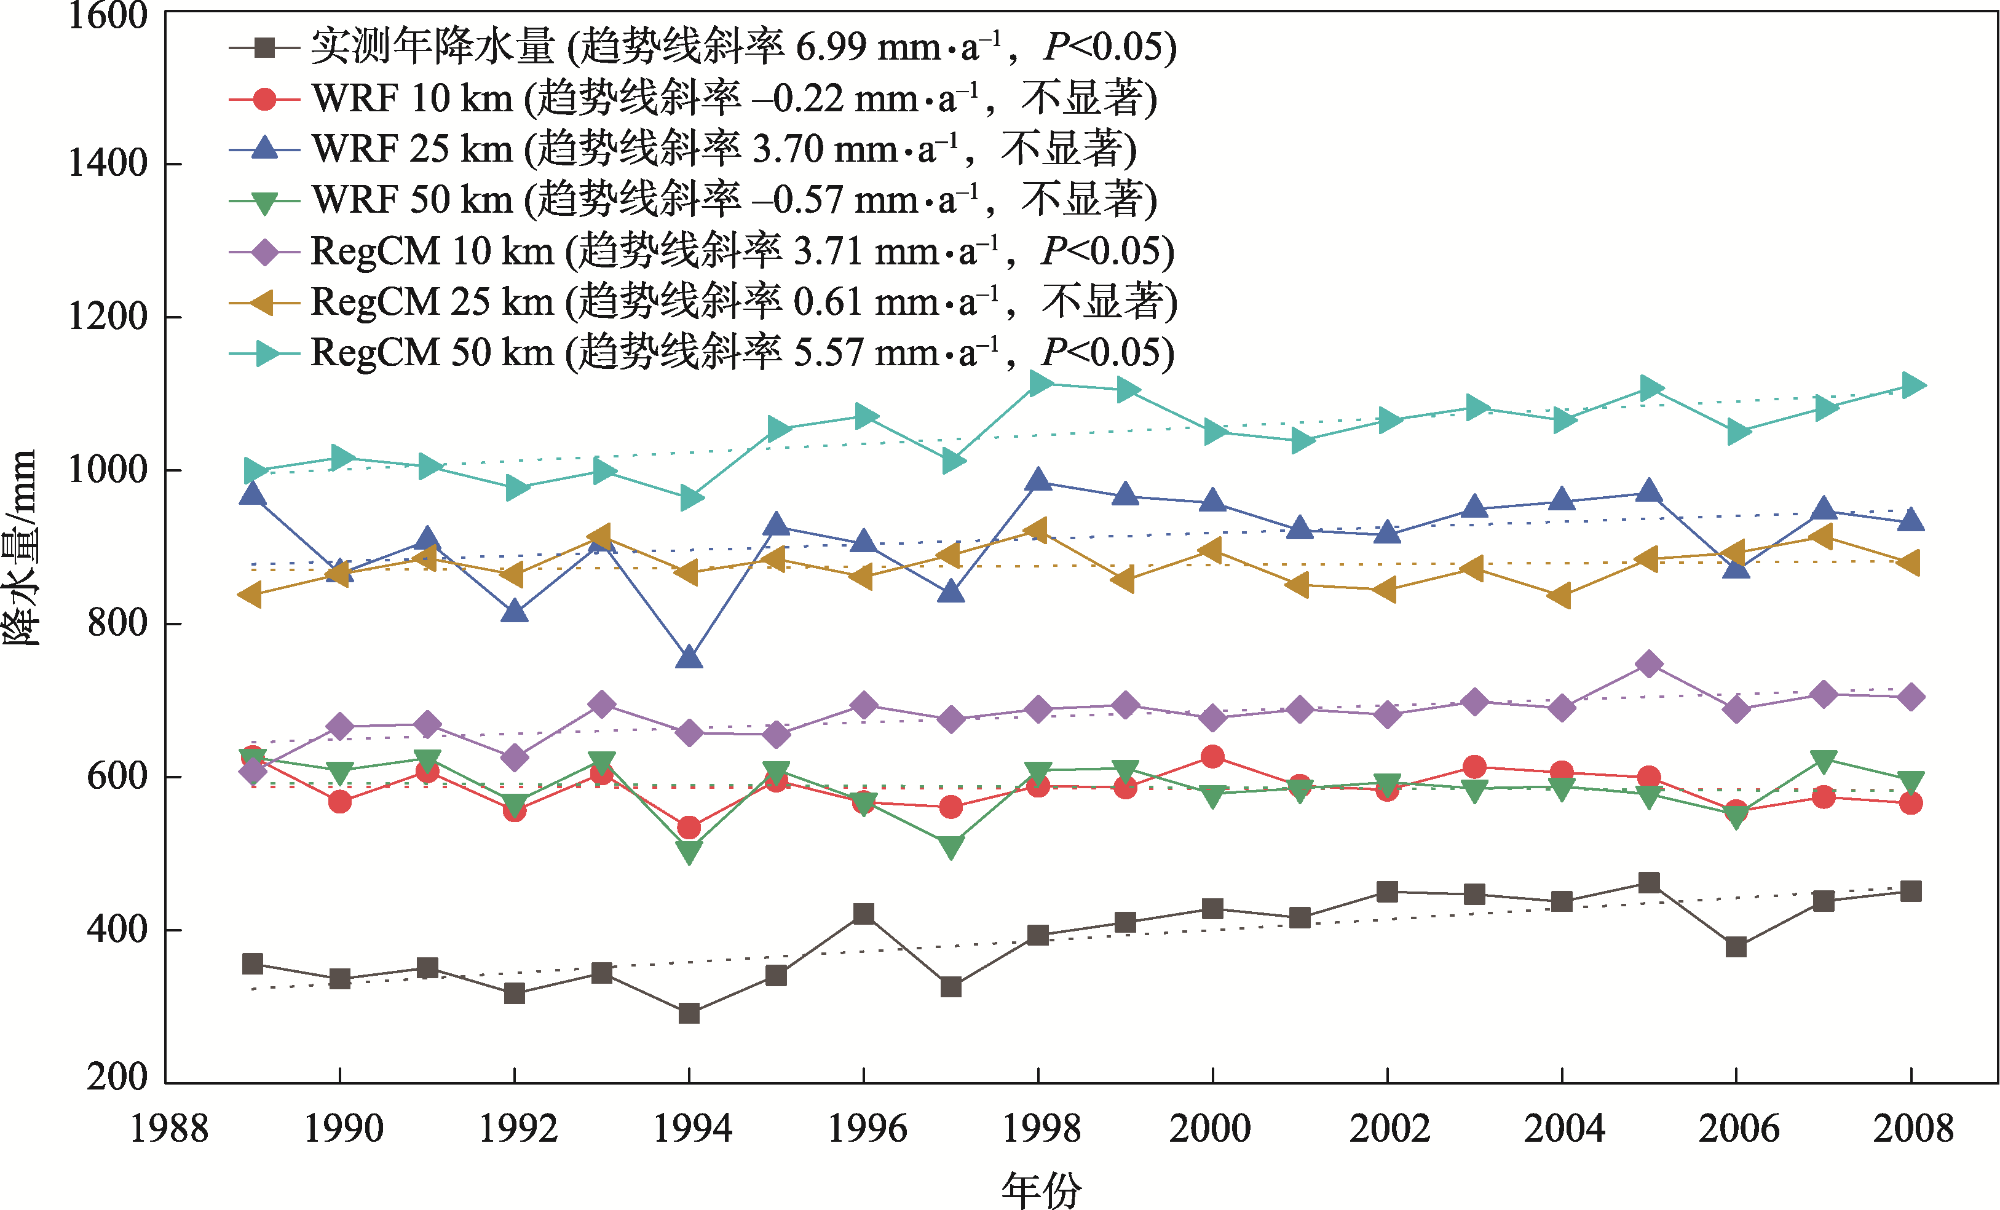
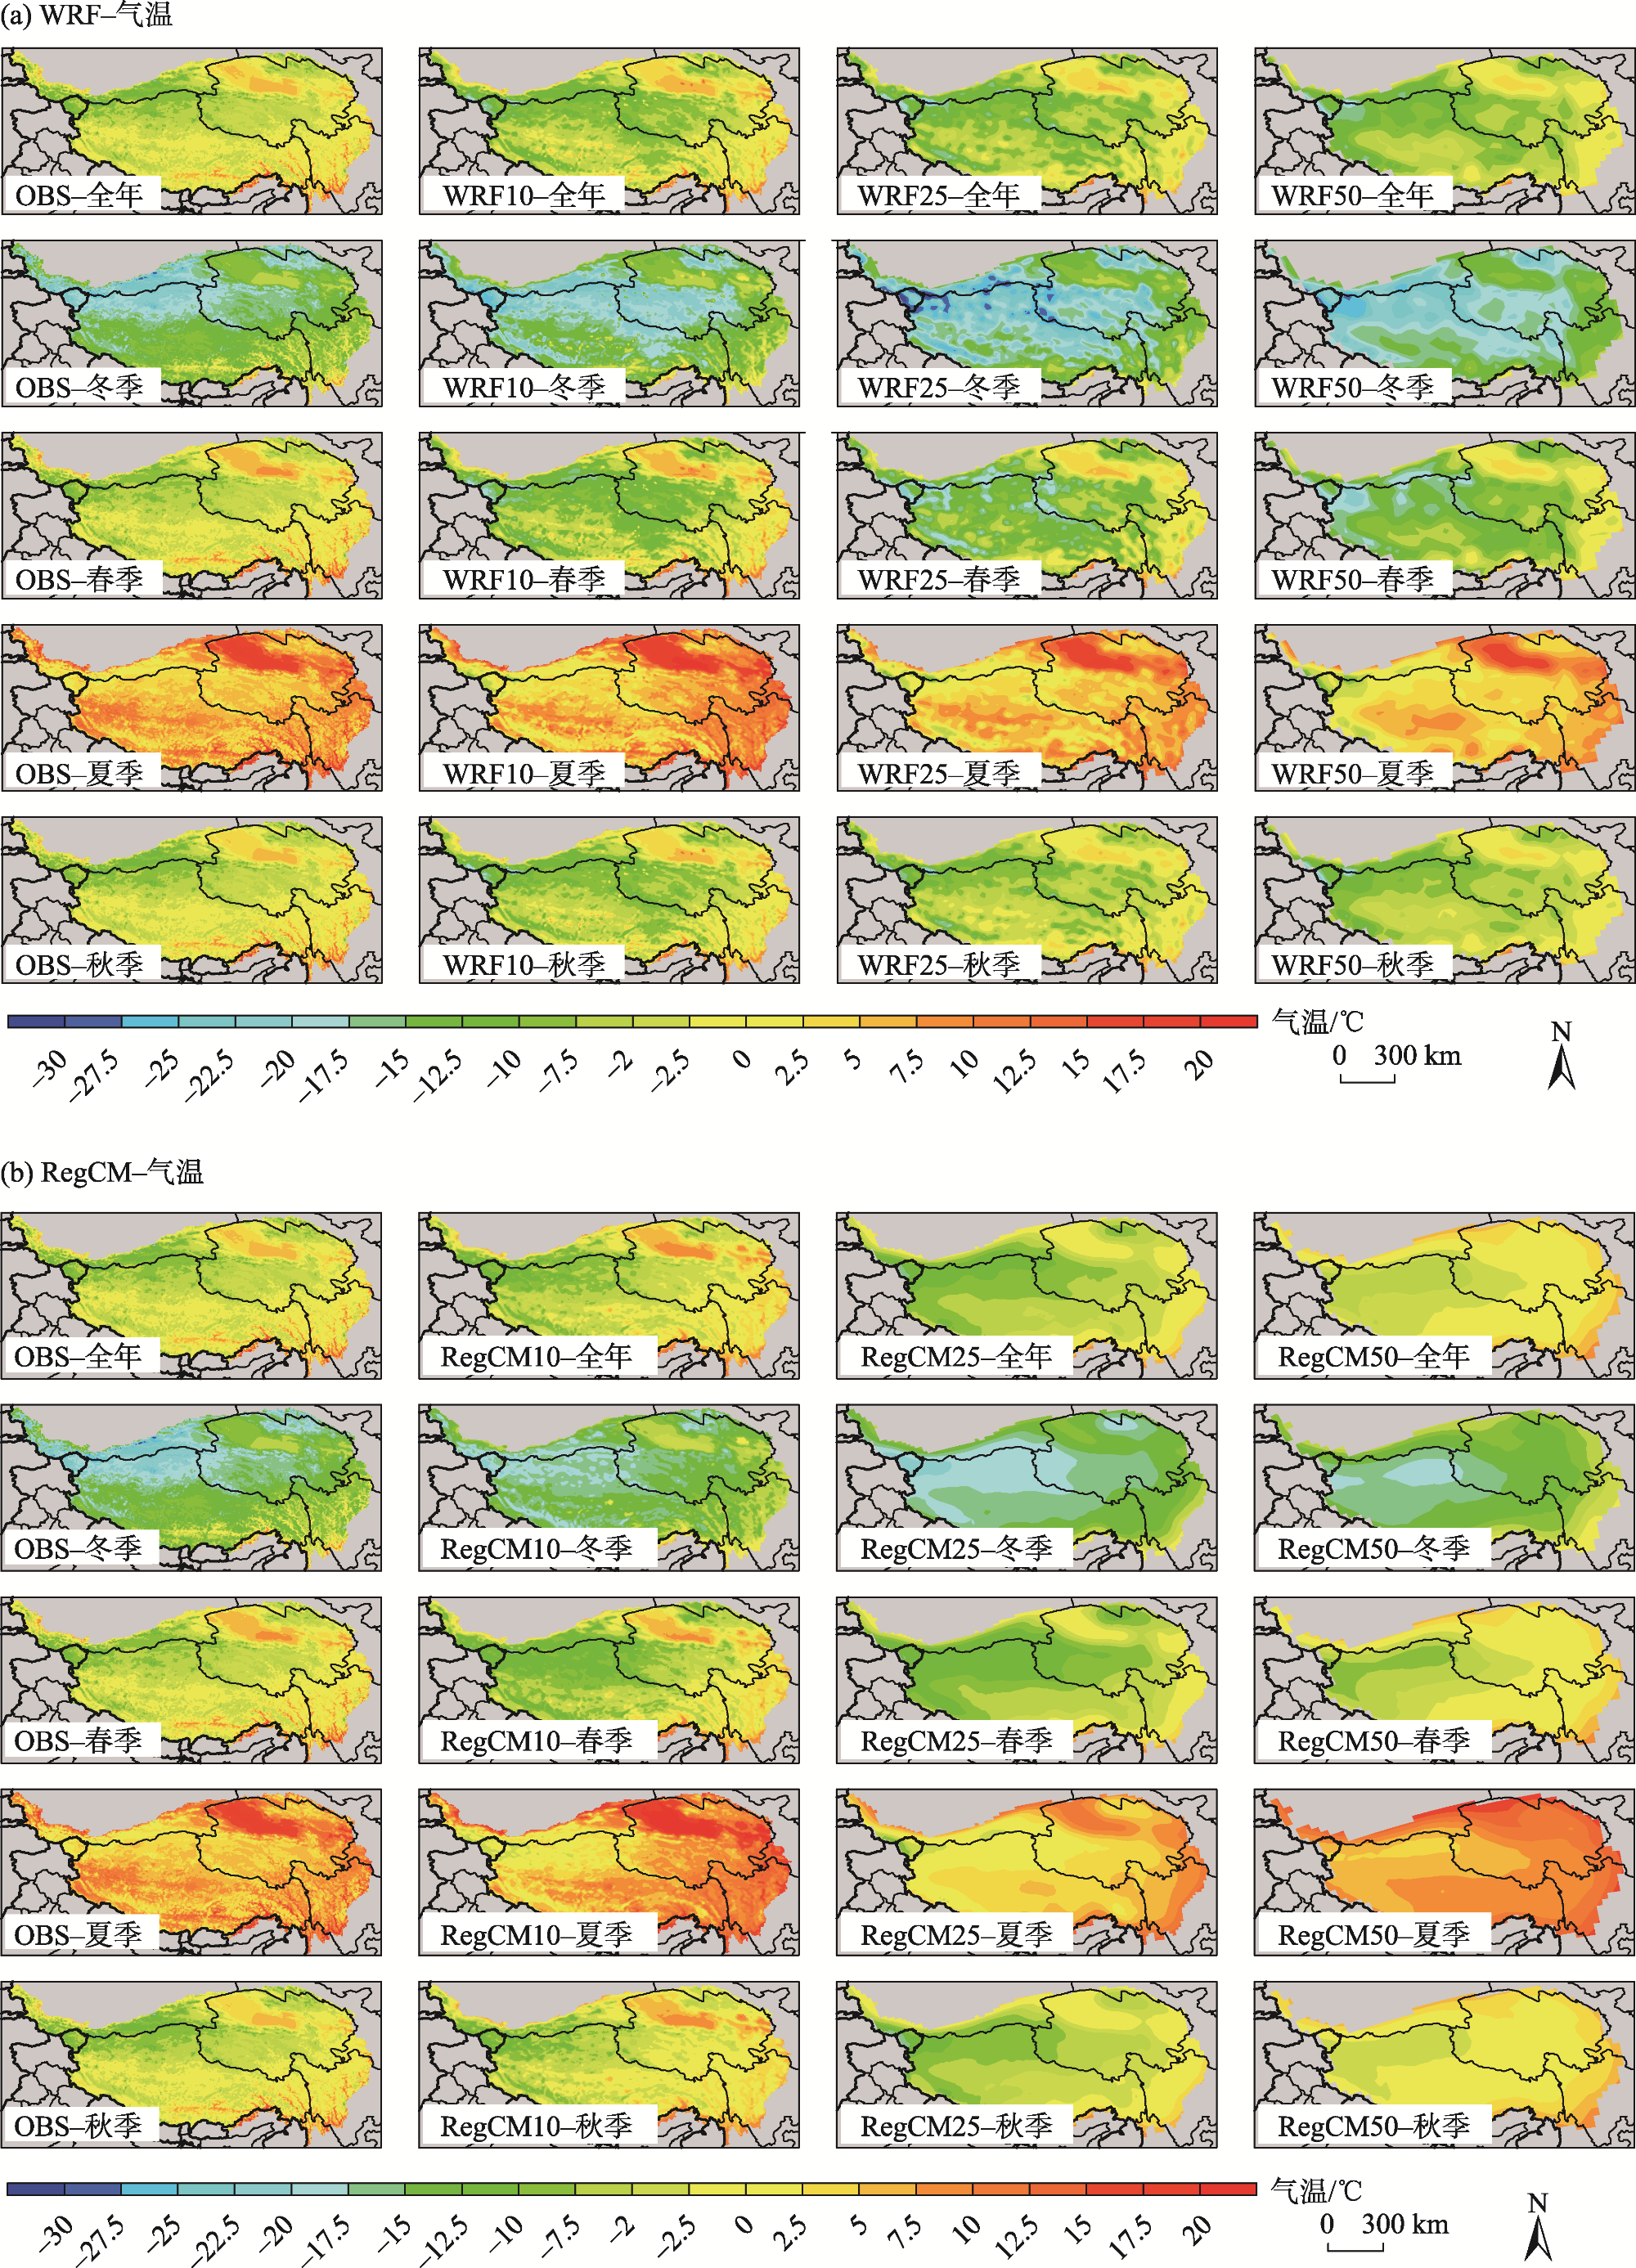
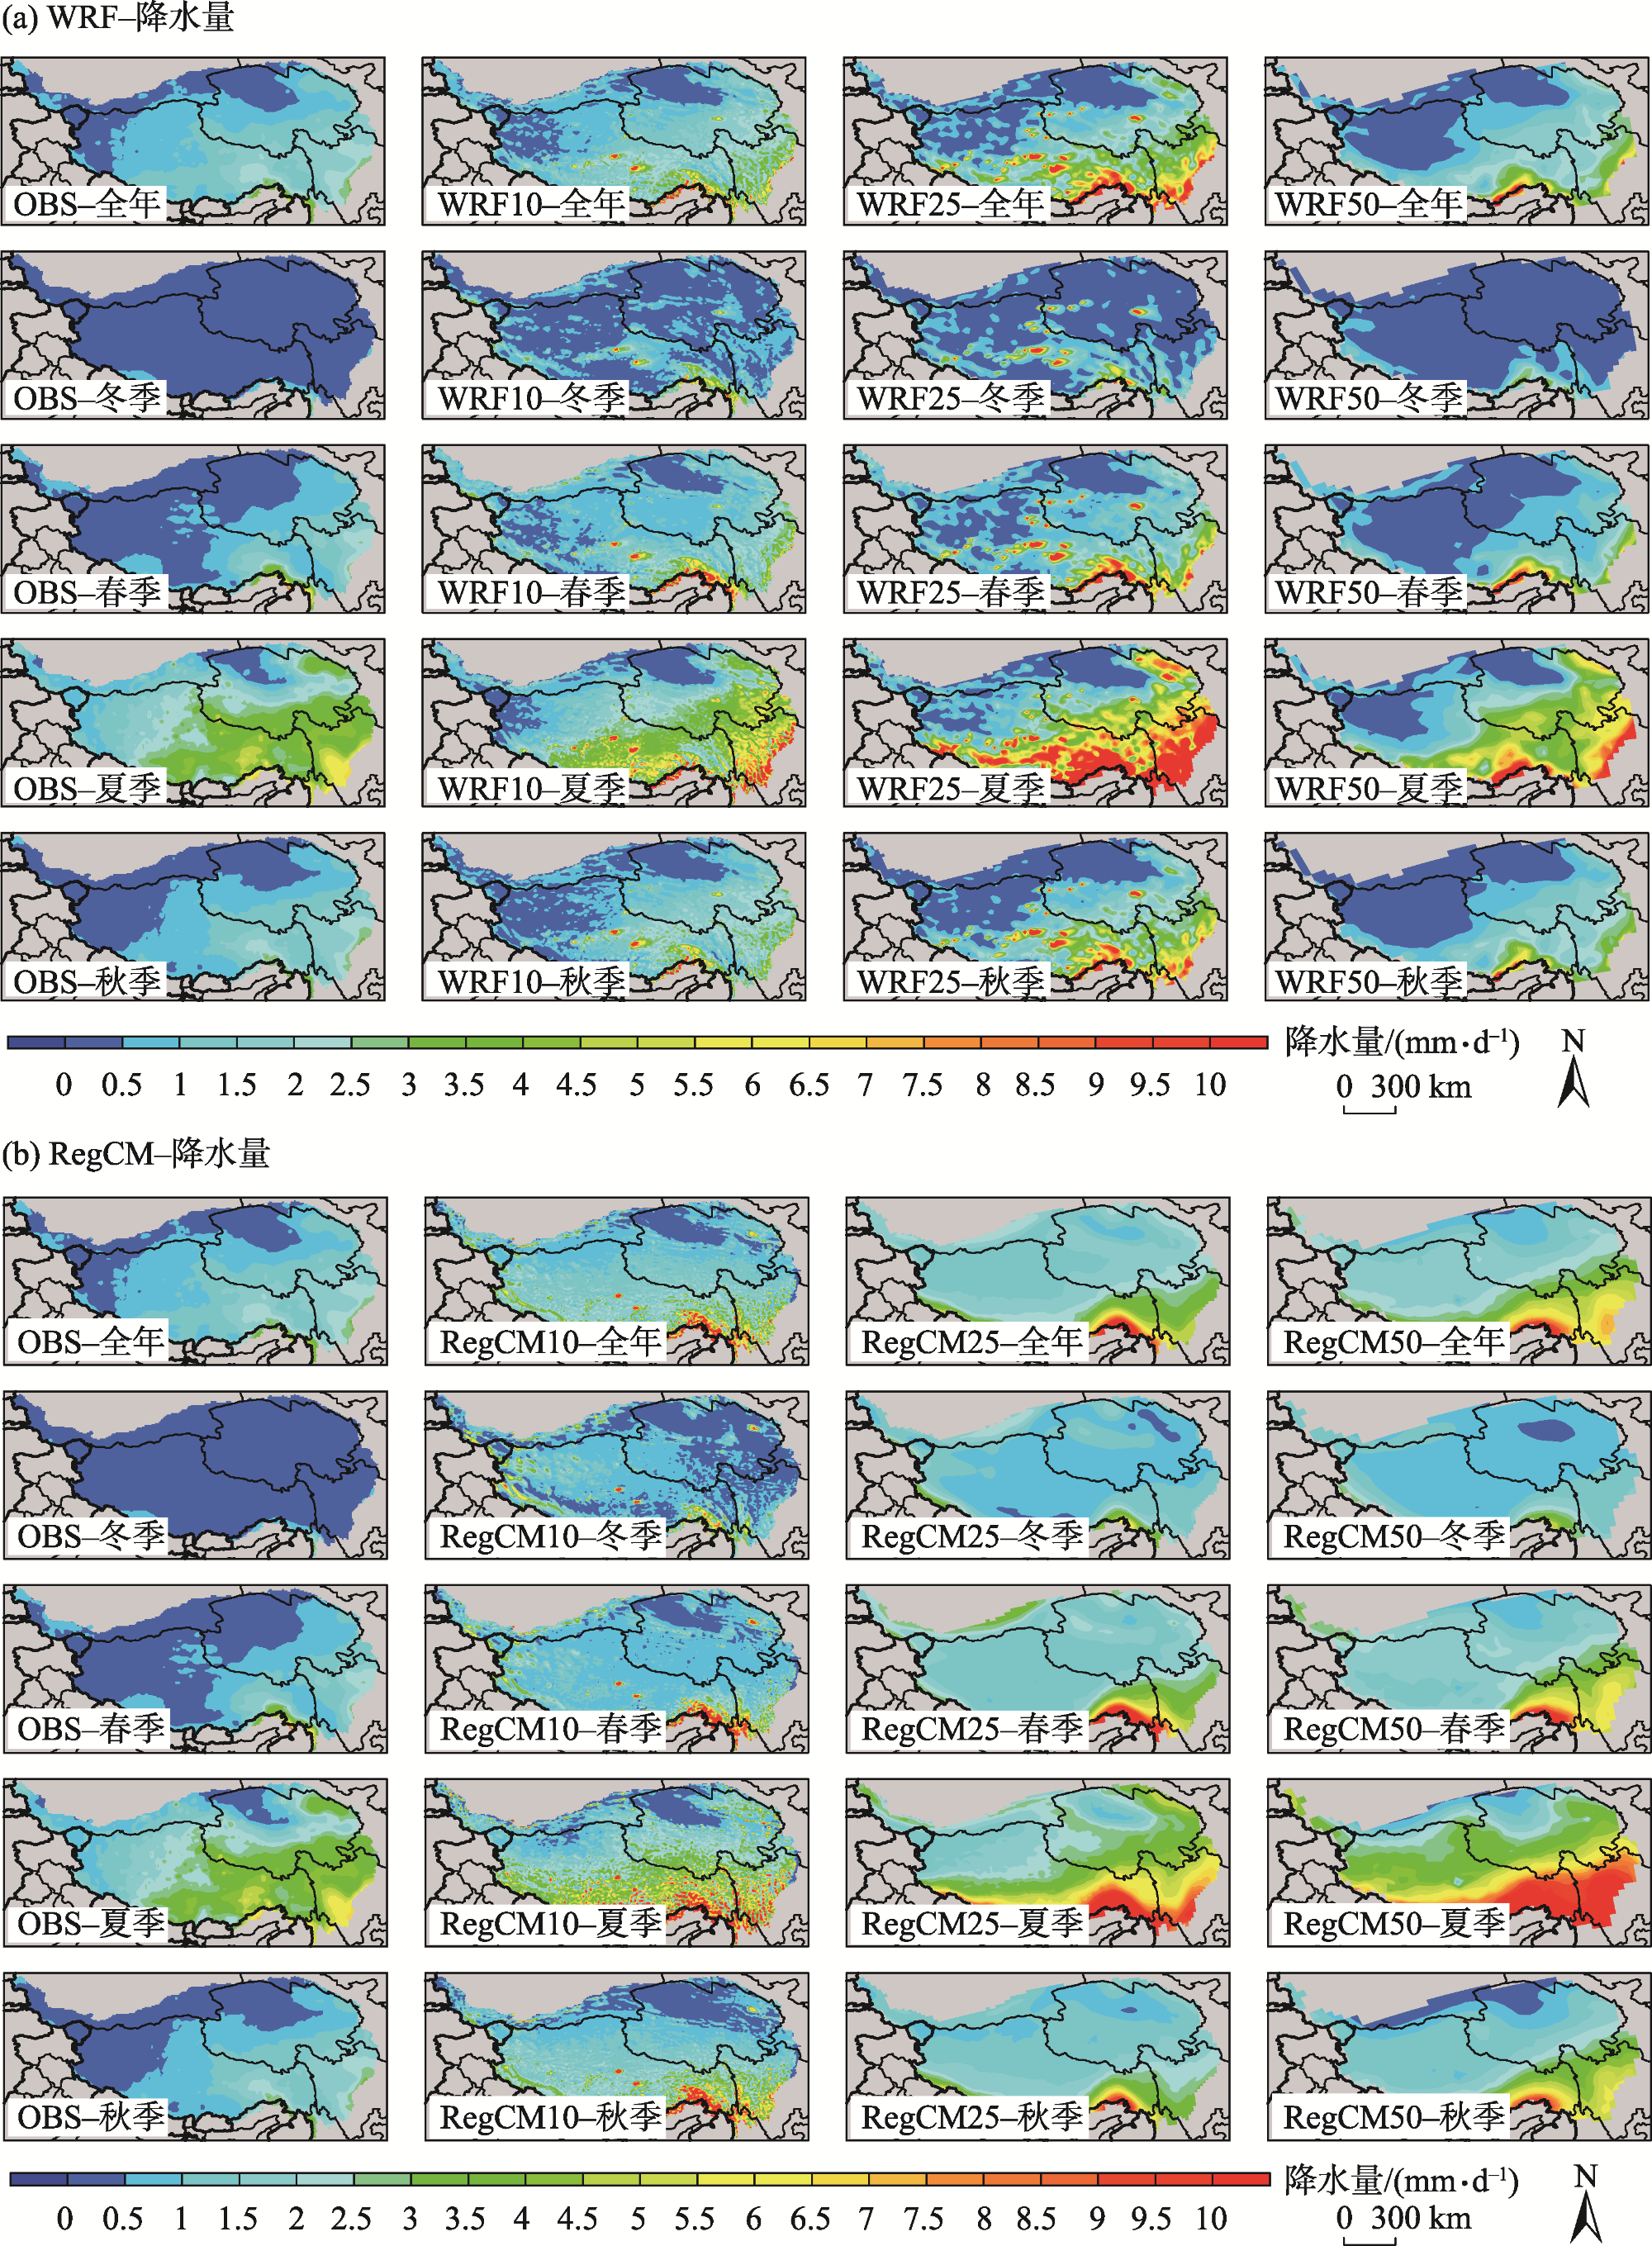
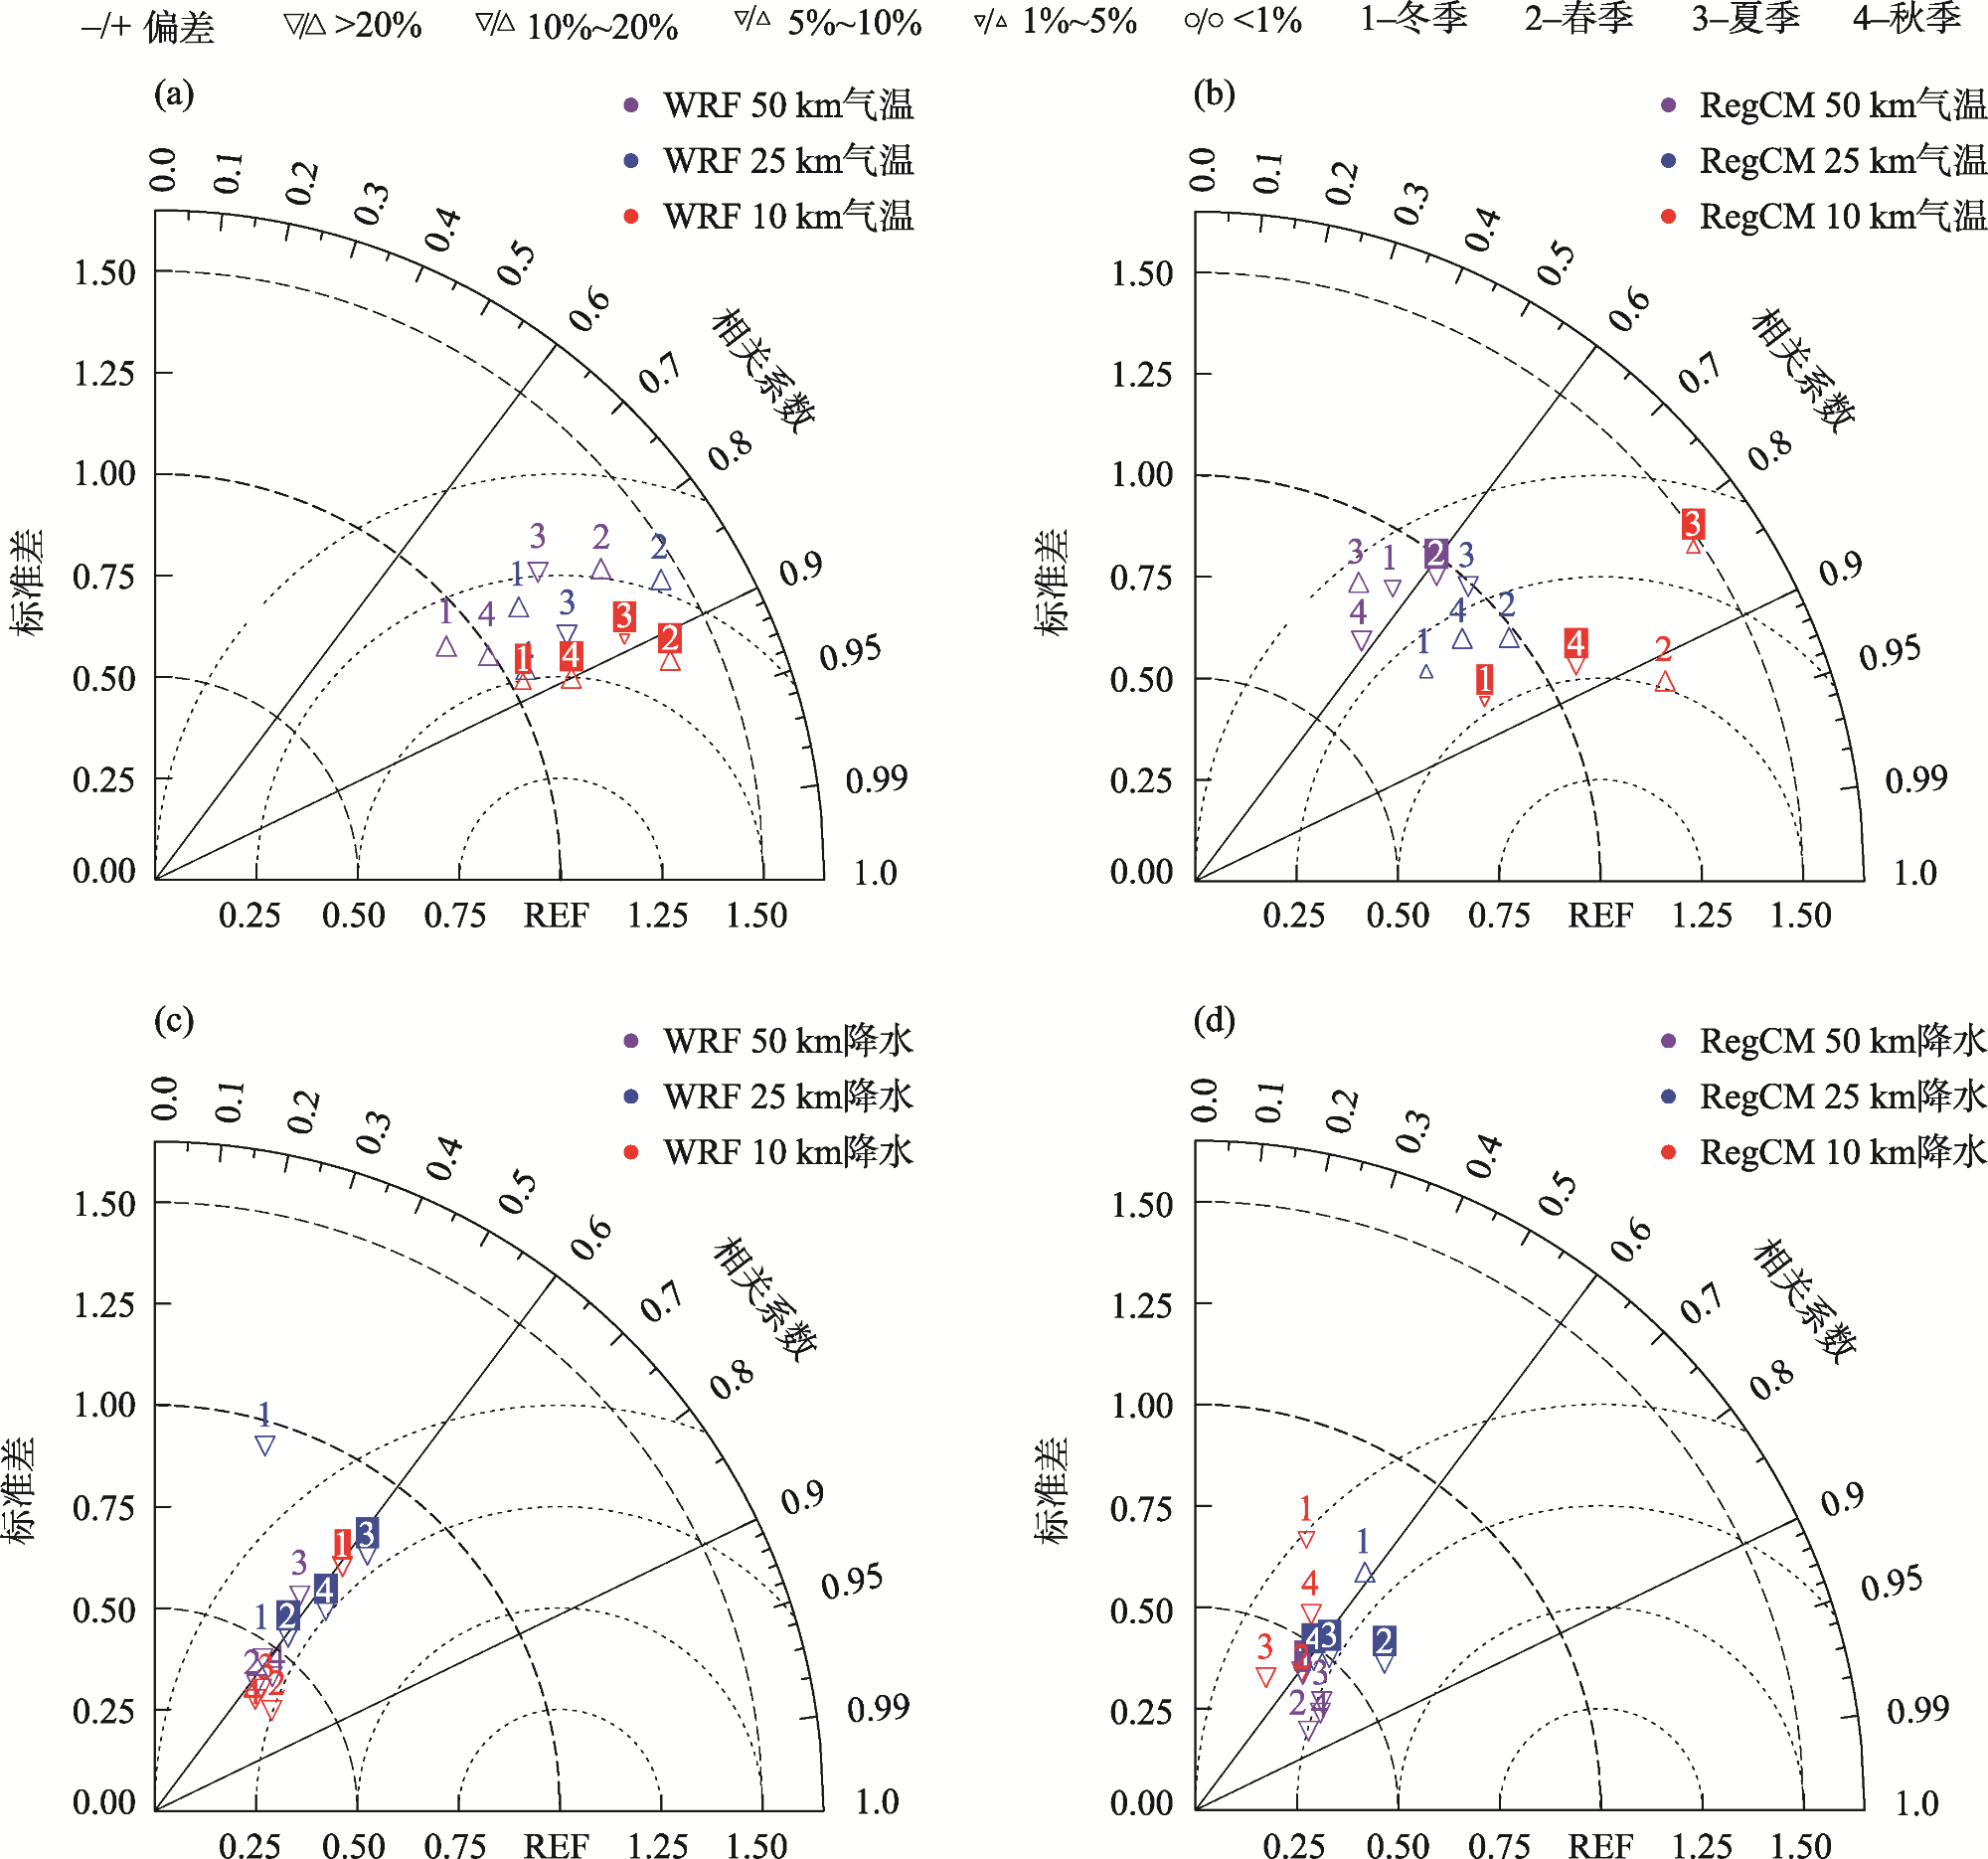
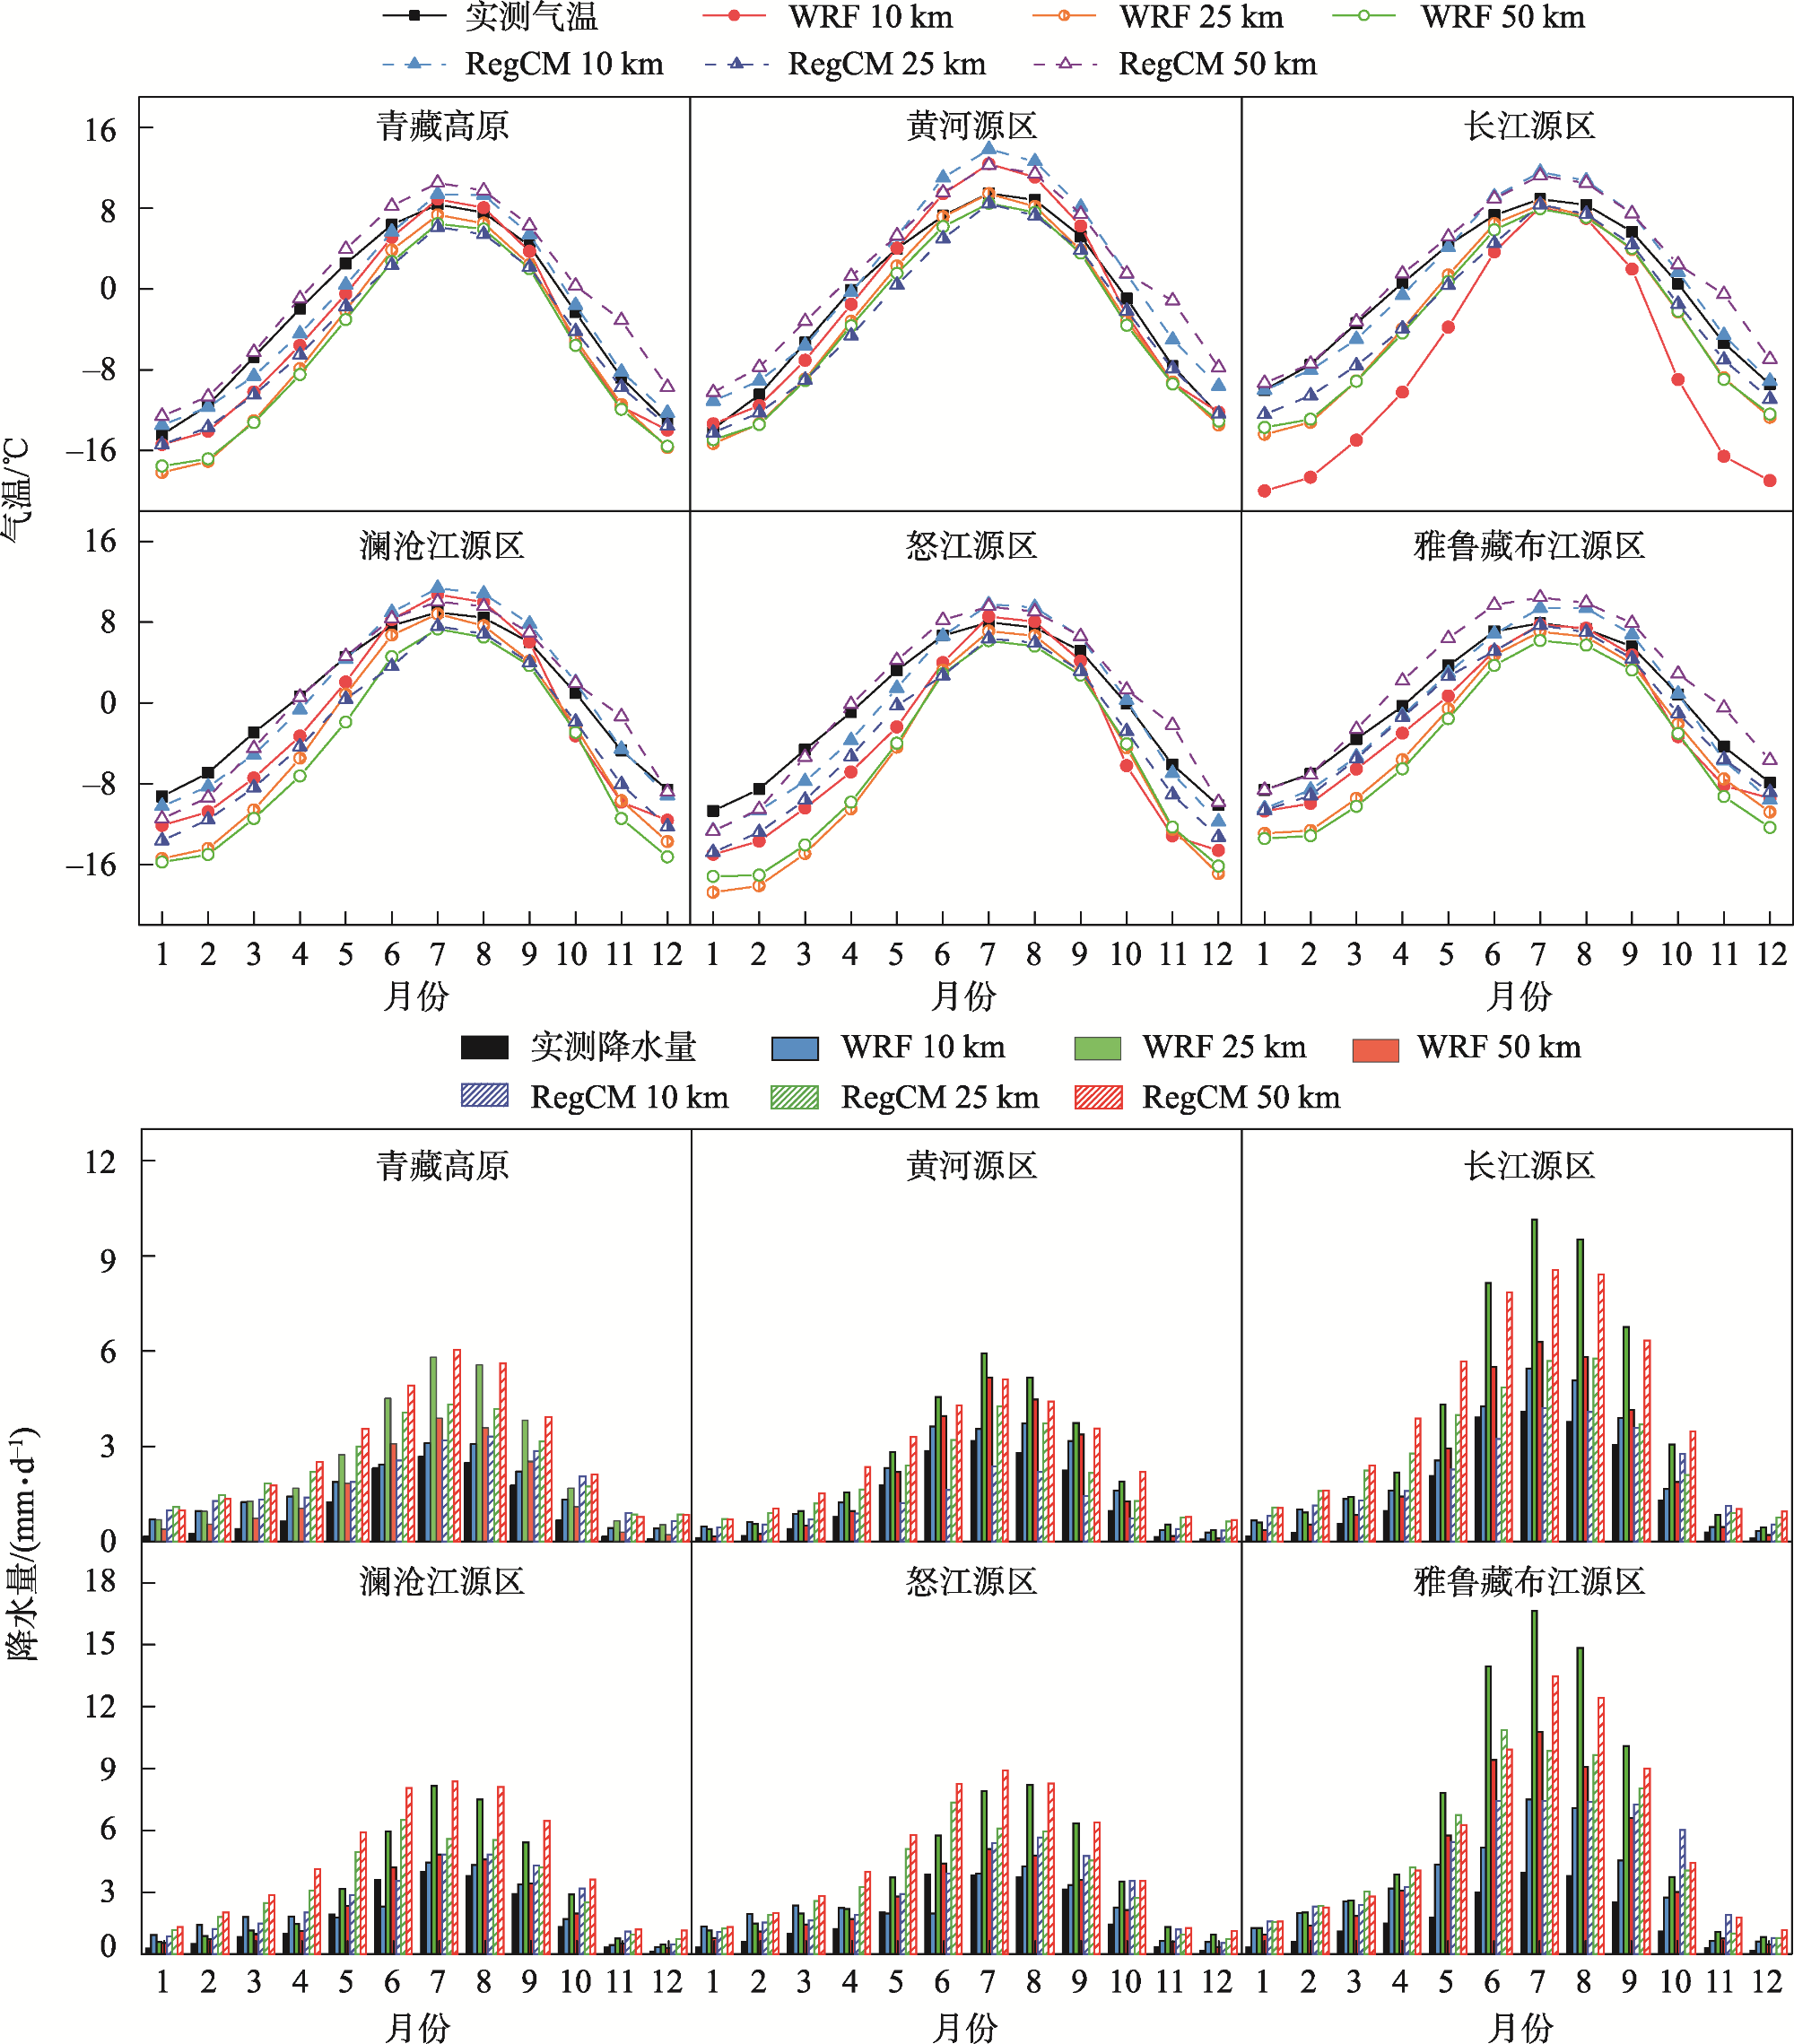
The Qinghai-Tibet Plateau has a unique climate, complex topography, and few meteorological observation stations, which makes it difficult to observe and simulate its regional climate and water cycle processes. Using the regional climate models RegCM and WRF, the spatial and temporal distribution of the climate in this region from 1989 to 2008 was systematically analyzed, and the simulation capability of the RegCM and WRF models was investigated at 10, 25, and 50 km horizontal resolutions in the Qinghai-Tibet Plateau. Results show that the trend of annual average temperature simulated by both models at 10 km horizontal resolution is 1.60-2.12 ℃ lower than the multiyear average temperature simulation at 25 and 50 km horizontal resolution. With increasing horizontal resolution, the simulation biases of annual and seasonal temperatures simulated by the WRF model decrease, and the cold bias of temperature in the central and western parts of the Qinghai-Tibet Plateau improves. The simulated temperature in the RegCM model at a 10 km horizontal resolution has the lowest error, and it is significantly better for simulating the spatial distribution of temperature in the Qinghai-Tibet Plateau. The correlation between the simulated temperature of both models in different seasons and the observation data has been improved. In the precipitation simulation, the WRF model at a horizontal resolution of 25 km has the best correlation with the observed data but has the largest error. With the increase of horizontal resolution, the overestimation of precipitation in the southeastern and southern Qinghai-Tibet Plateau by the WRF model has been significantly improved, and the annual precipitation simulated by the RegCM model gradually approaches the measured values (the overestimation decreases from about 2.73 times to 1.77 times). However, the overall overestimation of precipitation by both models still exists. In the simulation of the five major river sources on the Qinghai-Tibet Plateau, with increasing horizontal spatial resolution, the WRF model reduces the biases of the air temperature in the source region of the Mekong river and Salween River, whereas the RegCM model reduces the biases of the air temperature in the source region of the Brahmaputra River and Mekong river. The largest reduction in precipitation bias was achieved in the Brahmaputra River source region at 10 km horizontal resolution by the WRF and RegCM models. This study can lay the foundation for understanding the impact of climate change on the water cycle process in the Qighai-Tibet Plateau.

Cite this article

WANG Xueying , GU Huanghe , DAI Bin , ZHANG Hanwen , YU Zhongbo . Simulation of climate characteristics in the Qinghai-Tibet Plateau by regional climate models at different horizontal resolutions[J]. Arid Zone Research, 2024 , 41(3) : 363 -374 . DOI: 10.13866/j.azr.2024.03.02

气候变化已经成为世界各国共同关注的重大问题。作为全球增暖的敏感区之一[1-2],青藏高原增暖发生时间较早并且增温速率大于北半球同纬度的其他区域[3]。青藏高原显著影响着亚洲季风系统、北半球大气环流和“亚洲水塔”的水资源补给[4],故研究其气候变化具有重大意义。青藏高原地区气象站点主要分布在东部和东南部,而中部和西北部少有站点,是典型的资料稀缺地区[5]。由于其复杂的地形条件和特殊的气候特征,对青藏高原地区水循环的观测和模拟仍然存在很大的困难。
全球气候模式(GCM)是对气候系统进行量化模拟研究的主要工具,区域气候模式(RCM)具有较高的水平分辨率,可以细化局地气候特征和极端事件的物理过程[6],能够更好地重现东亚区域气候的主要特征[7],对青藏高原的温度和降水模拟能力要明显优于GCM模式[8]。但以上气候模式在青藏高原地区均存在较大的偏差[9]。因此,如何改进模式在该地区的模拟效果一直以来都是研究的重点。模式的水平分辨率是影响模拟能力的一项重要因素。研究发现,提高模式水平分辨率,能够显著改善WRF模式对青藏高原东南部夏季降水[9]和因地形引起的降水异常[10]的模拟能力,也能改善RegCM3模式对陡峭地形附近的温度分布形势的模拟[11]。但模式对水平分辨率的敏感性较为复杂。本文将依据多源观测数据,系统分析1989—2008年青藏高原区域气候的时空分布特征和变化规律,评估不同水平分辨率10 km、25 km和50 km下区域气候模式WRF模式和RegCM模式对青藏高原地区气候的模拟能力。

1 模式和方法介绍

1.1 WRF和RegCM区域气候模式

作为新一代中尺度数值大气模式,WRF模式具有广泛的物理选择,可以根据研究区域选择以获得最佳性能[12],能够较为成功地模拟出中尺度过程中环流形势的演变和雨带的分布特征[13]等。RegCM模式通过与海洋、湖泊、气溶胶、沙尘、水文和陆地过程的模式耦合,发展成为完全耦合的区域气候模式[7]。相关研究证明:WRF模式基本能够重建青藏高原强降水过程的中心、强度及降水范围[14]并能很好地模拟出高原湿季的气温变化[15];RegCM模式能较好地再现青藏高原地区大尺度的环流特征,具备对该地区温度和降水分布特征的模拟能力[16]。与其他区域气候模式相比,WRF模式和RegCM模式在我国青藏高原地区得到了最为广泛的应用。
两个模式的试验设计方案如下表1所示,其中两个模式在25 km和50 km水平分辨率的模拟范围与东亚区域联合降尺度计划(CORDEX-EA)的区域设置一致,覆盖整个东亚区域[17],但为减少计算量,10 km水平分辨率模拟范围则仅覆盖整个青藏高原[18]
表1 试验设计方案

Tab. 1 The design scheme of the test

RegCM WRF
水平分辨率 10 km、25 km、50 km 10 km、25 km、50 km
经纬度范围 70 °~106 °E,
23 °~42 °N;
49 °~180 °E,
0 °~61 °N;
33 °E~180 °E,
24 °S~67 °N
74 °~106 °E,
22 °~42 °N;
50 °~180 °E,
0 °~49 °N;
40 °E~180 °E,
24 °S~65 °N
格点数 297×189、394×249、
243×197
277×216、395×250、
233×197
对流参数化方案 MIT-Emanuel Kain-Fritch Ⅱ
陆面参数化方案 CLM 3.5 NOAH LSM
行星边界层 Hotslag YSU
谱逼近方法 选用 选用

1.2 观测资料

采用由中国科学院青藏高原研究所开发的中国区域地面气象要素数据集(China Meteorological Forcing Dataset,CMFD)作为地面实际观测资料[19-21]。CMFD数据集将中国气象局常规气象观测数据与国际上再分析资料、卫星资料等其他多源数据融合而成,数据集时间分辨率为3 h,水平空间分辨率为0.1°。数据整体准确度较高,已被广泛应用于水文和气候模拟研究[22]。为方便与区域气候模式空间结果比较分析,将观测资料分别重采样到10 km、25 km、50 km三种不同的水平分辨率。

1.3 评价指标

本文采用相对误差(BIAS)、平均绝对误差(Mean Absolute Error,MAE)、均方根误差(Root Mean Square Error,RMSE)和相关系数(Correlation Coefficient,R)等检验模式相对于观测的偏离程度[23]。其计算公式如下:
B I A S = i = 1 N M i - O i i = 1 N O i
M A E = 1 N i = 1 N M i - O i
R M S E = 1 N i = 1 N M i - O i 2
R = 1 N i = 1 N M i - M - O i - O - 1 N i = 1 N M i - M - 2 1 N i = 1 N O i - O - 2
式中:N为空间或时间点的总个数;Oi为时空点i处的观测值;Mi为该处模拟值; O -表示在N个时空点上观测值的平均值; M -表示在N个时空点上模拟值的平均值。
本文使用泰勒图[24]评估模式性能,其综合了空间相关系数、均方根误差和标准差三种量值。
本文采用Manner-Kendall(M-K)非参数趋势分析方法,用于检验分析降水、气温等气象要素的季节及年际的趋势变化规律,其方程如下:
S = i = 2 n j = 1 i - 1 s g n x i - x j
式中:sgn(*)为符号函数,当xi-xj小于、等于或大于零时,sgn(xi-xj)分别为-1、0或1。
M-K统计量公式如下:
Z = S - 1 n ( n - 1 ) ( 2 n + 5 ) 18 ,                     S > 0                                     0                       ,                     S = 0 S + 1 n ( n - 1 ) ( 2 n + 5 ) 18 ,                     S < 0
选用信度为0.01、0.05的显著性检验(P),即检验Z的绝对值是否大于等于2.32、1.64,以确定气温、降水的变化趋势显著程度[25]

2 不同水平分辨率区域气候模式模拟结果

2.1 年际变化模拟结果

WRF模式和RegCM模式不同水平分辨率下对1989—2008年青藏高原年平均气温模拟结果见图1表2,年降水量模拟结果见图2表3。青藏高原实测多年平均气温为-2.50 ℃,整个高原各季节气温均呈现显著上升的趋势但升温幅度不同,冬季温度上升幅度最大,夏季温度上升幅度最小且未通过信度为0.05的显著性检验。WRF模式10 km水平分辨率下模拟气温年际变化趋势与实测气温年际变化趋势最相似。水平分辨率从50 km提高到25 km,WRF模式模拟年平均气温的相关系数R由0.72提升至0.93。而RegCM模式随着水平分辨率的提高,模拟年平均气温的相关系数R却由0.93降至0.55。本研究选取20 a的气候时空分布规律进行研究,时间序列较短且青藏高原气温变化存在波动性,导致了一定的模拟难度和模拟误差。
图1 WRF模式、RegCM模式不同水平分辨率下对青藏高原年平均气温模拟结果

Fig. 1 The annual average temperature on the Qinghai-Tibet Plateau simulated by WRF and RegCM at different horizontal resolutions

表2 青藏高原年均、四季气温模拟结果误差分析

Tab. 2 Error analysis of annual and seasonal temperature in Qinghai-Tibet Plateau based on the simulation results

年均 春季 夏季 秋季 冬季
RegCM模式10 km MAE/℃ 0.33 2.17 0.69 0.80 0.82
RMSE/℃ 0.44 2.27 0.79 1.00 1.04
R 0.55 0.47 0.65 0.47 0.55
WRF模式10 km MAE/℃ 1.77 3.38 0.27 2.20 1.41
RMSE/℃ 1.78 3.40 0.34 2.24 1.47
R 0.91 0.87 0.71 0.73 0.93
RegCM模式25 km MAE/℃ 2.45 4.20 2.80 1.67 1.14
RMSE/℃ 2.48 4.24 2.86 1.83 1.29
R 0.75 0.67 0.50 0.19 0.81
WRF模式25 km MAE/℃ 3.37 5.65 1.54 2.40 3.92
RMSE/℃ 3.38 5.65 1.55 2.43 3.95
R 0.93 0.96 0.92 0.84 0.91
RegCM模式50 km MAE/℃ 2.13 0.96 2.06 3.44 2.42
RMSE/℃ 2.15 1.00 2.07 3.47 2.82
R 0.93 0.89 0.87 0.15 0.70
WRF模式50 km MAE/℃ 3.77 6.20 2.39 2.91 3.74
RMSE/℃ 3.79 6.24 2.41 2.95 3.86
R 0.72 0.73 0.79 0.01 0.63
图2 WRF模式、RegCM模式不同水平分辨率下对青藏高原年降水量模拟结果

Fig. 2 The annual precipitation on the Qinghai-Tibet Plateau simulated by WRF model and RegCM model at different horizontal resolutions

表3 青藏高原年均、四季降水量模拟结果误差分析

Tab. 3 Error analysis of annual and seasonal precipitation in Qinghai-Tibet Plateau based on the simulation results

年均 春季 夏季 秋季 冬季
RegCM模式10 km BIAS/% 75 102 22 126 532
MAE/mm 290.7 70.6 49.3 98.3 73.3
RMSE/mm 293.1 72.2 55.3 99.0 74.5
R 0.69 0.28 0.60 0.48 0.62
WRF模式10 km BIAS/% 50 101 15 55 342
MAE/mm 195.4 69.9 35.4 42.5 47.2
RMSE/mm 201.3 71.2 43.0 44.5 47.7
R 0.37 0.08 0.63 0.03 0.50
RegCM模式25 km BIAS/% 125 210 68 123 640
MAE/mm 486.0 145.9 156.4 96.1 88.1
RMSE/mm 489.5 146.8 161.1 97.2 88.5
R -0.08 0.09 -0.05 0.03 0.57
WRF模式25 km BIAS/% 134 151 113 139 365
MAE/mm 523.0 104.9 259.0 108.2 50.3
RMSE/mm 524.6 105.4 261.1 108.9 51.0
R 0.73 0.65 0.80 0.55 0.21
RegCM模式50 km BIAS/% 169 246 122 165 565
MAE/mm 658.8 170.5 279.5 128.4 77.9
RMSE/mm 659.5 170.8 280.1 129.3 79.8
R 0.83 0.76 0.83 0.52 0.29
WRF模式50 km BIAS/% 51 60 42 51 135
MAE/mm 197.2 41.6 95.4 40.1 18.5
RMSE/mm 204.2 44.3 99.1 42.2 20.4
R 0.28 0.05 0.57 0.45 0.19
WRF模式模拟气温始终偏低,随着水平分辨率提高,WRF模式对年、四季气温的模拟结果多年平均绝对误差和均方根误差值逐渐减小(50 km水平分辨率下误差范围为2.39~6.24 ℃,10 km水平分辨率下误差范围为0.27~3.38 ℃)。RegCM模式50 km水平分辨率下模拟气温明显偏高,而25 km水平分辨率下模拟气温偏低,10 km水平分辨率下模拟的年平均气温误差最小。RegCM模式从25 km到10 km水平分辨率模拟四季气温的多年平均绝对误差和均方根误差值明显降低,10 km水平分辨率下模拟效果最好。
青藏高原1989—2008年多年平均降水量为389.9 mm,年降水量和四季降水量呈现上升趋势(置信度为95%),夏季降水量上升幅度最大而冬季降水量上升幅度最小,夏季对年降水量增加的贡献最突出。模式模拟降水量均比实测值偏大,这也是气候模式在青藏高原降水模拟中普遍存在的误差,CMIP5全球气候模式在青藏高原的模式等权重集合平均模拟值与观测场的标准差之比为2.02[26]。RegCM模式50 km水平分辨率模拟年降水量年际变化趋势(线性趋势5.57 mm·a-1P<0.05)与实测降水量(线性趋势6.99 mm·a-1P<0.05)年际变化趋势最相似。WRF模式在25 km水平分辨率模拟年降水量与实测年降水量的相关程度(相关系数R=0.73)最好。RegCM模式对全年降水量的模拟随着水平分辨率的提高,误差明显减小,高估情况由高估约2.73倍降至1.77倍。青藏高原地区降水量的年际波动大,其模拟本身比较困难,所以两个模式在降水的年际变化方面模拟能力依然面临着明显不足。
WRF模式在四季降水量模拟中,25 km水平分辨率下模拟值与实测数据的误差最大。10 km和50 km水平分辨率下对降水量的模拟效果基本一致,与实测值较接近。10 km水平分辨率下模拟夏季降水量改善明显。随着水平分辨率的提高,RegCM模式在春、夏、冬三季模拟降水量与实测数据的相对误差、平均绝对误差和均方根误差明显降低,而秋季模拟误差减少不明显。

2.2 空间分布模拟结果

WRF模式、RegCM模式不同水平分辨率下对青藏高原全年和四季气候模拟空间分布如图3图4。WRF模式能够很好地模拟出气温从东南向西北递减的空间分布规律以及气温高值区和低值区。50 km水平分辨率对青藏高原整体气温的模拟略低。随着水平分辨率的提高,WRF模式对青藏高原中部和西部气温低估的情况有所改善。相较而言,RegCM模式在25 km和50 km水平分辨率下对气温空间分布的模拟较粗糙,难以准确模拟气温的高值和低值区。10 km水平分辨率下,RegCM模式对青藏高原气温空间分布的模拟能力有了明显提高,但气温高值区存在高估现象,而对高原西部地区气温存在低估。青藏高原实测站点稀疏,且山区站点多建于海拔较低的温度较高的山谷地带,因此观测气温本身也存在一定的误差[27]
图3 WRF模式(a)、RegCM模式(b)不同水平分辨率下对青藏高原年平均、四季气温模拟空间分布

Fig. 3 Spatial distribution map of the annual average and seasonal temperature on the Qinghai-Tibet Plateau simulated by WRF model (a) and RegCM model (b) at different horizontal resolutions

图4 WRF模式(a)、RegCM模式(b)不同水平分辨率下对青藏高原年、四季降水量模拟空间分布

Fig. 4 Spatial distribution map of the annual and seasonal precipitation on the Qinghai-Tibet Plateau simulated by WRF model (a) and RegCM model (b) at different horizontal resolutions

WRF模式能够大体上模拟出降水量的空间分布特征,但对东南部降水量存在明显高估,25 km水平分辨率下对其高估最为严重,青藏高原南坡陡峭的地形和极高的海拔使得南来的湿空气在此处很容易被地形强迫抬升,产生降水,模式在此处可能会过度强化这种地形强迫作用[9],提高模式的水平分辨率至10 km后高估情况有效改善。比较而言,RegCM模式对高原整体降水量的高估更为严重,其模拟严重高估区仍为高原东南部且模拟降水量分布和观测值的分布并不一致,在10 km水平分辨率下对高原整体降水量的模拟有所改善。一些研究也确定了在青藏高原地区模拟降水湿偏差的原因,例如,相对粗糙的模式分辨率和复杂地形而导致的不合理的水汽输送[28]、积云参数化方案导致的过度对流活动[29]、以及与土壤水分和土壤冻融相关的不准确的陆气相互作用等[30-31]
图5通过泰勒图进一步量化分析WRF模式和RegCM模式不同水平分辨率下对青藏高原四季气候空间分布特征的模拟能力。在气温模拟中,模式水平分辨率的提高对冬季气温的模拟效果有所提升。WRF模式对四季气温的模拟在10 km水平分辨率下较接近观测。随着水平分辨率的提高,WRF模式模拟四季气温空间相关系数R由0.75~0.85提升至0.85~0.93,RegCM模式模拟四季气温空间相关系数R由0.45~0.65提升至0.8~0.93。在降水量模拟中,模式水平分辨率的提高对两个模式四季降水量的模拟效果没有明显提升,模拟降水量与实测数据的标准差均小于1,空间方差偏小。WRF模式在25 km水平分辨率下的模拟更接近观测,模拟降水量与实测数据的空间相关系数R在0.6左右。
图5 不同水平分辨率下区域气候模式模拟的四季气温(a、b)、四季降水量(c、d)泰勒分析

注:图中点标记底色为彩色、字体为白色即代表该点模拟偏差的绝对值为3种分辨率中此季节模拟偏差绝对值的最小值。

Fig. 5 Taylor analysis diagram of seasonal temperature (a, b), seasonal precipitation (c, d) simulated by WRF model and RegCM model at different horizontal resolutions

2.3 不同江河源区模拟结果

青藏高原是亚洲主要河流的发源地,探究区域气候模式在青藏高原主要江河源区(黄河、长江、澜沧江、怒江、雅鲁藏布江)的模拟能力,将对其未来水循环过程的研究奠定良好基础。图6通过对比各月份平均气温和降水量的模拟分析WRF模式、RegCM模式不同水平分辨率下对青藏高原五大江河源区的模拟能力。
图6 不同水平分辨率下区域气候模式在青藏高原五大江河源区模拟的多年月平均气温(上)、多年月平均降水量(下)

Fig. 6 Annual monthly mean temperature (top) and annual monthly mean precipitation (bottom) in the five source rivers of Qinghai-Tibet Plateau simulated by WRF model and RegCM model at different horizontal resolutions

在气温模拟中,WRF模式由50 km提升为25 km水平分辨率后,平均绝对误差减少0.33~1.28 ℃,均方根误差减少0.25~1.09 ℃,其中澜沧江源区改善程度最大。WRF模式由25 km提升为10 km水平分辨率后,模拟平均绝对误差减少0.25~1.72 ℃,均方根误差减少0.36~2.01 ℃,其中怒江源区改善程度最大。RegCM模式由25 km提升为10 km水平分辨率后平均绝对误差减少0.08~2.23 ℃,均方根误差减少0.09~2.26 ℃,其中澜沧江源区改善程度最大。WRF模式对各源区夏季气温模拟误差较小,对3月气温模拟误差较大。RegCM模式对各月模拟区别不明显。
在降水量模拟中,水平分辨率的提高对五个源区的模拟都有所改善。RegCM模式由50 km提升为25 km水平分辨率后模拟相对误差减少35%~77%,平均绝对误差减少0.58~1.32 mm·d-1,均方根误差分别减少0.60~1.57 mm·d-1,改善程度最大的为长江源区。两个模式由25 km提升为10 km水平分辨率后,模拟相对误差减少31%~186%,平均绝对误差减少0.14~3.10 mm·d-1,均方根误差减少0.10~4.53 mm·d-1,改善程度最大的均为雅鲁藏布江源区(模拟相对误差由约252%降至137%)。WRF模式对各源区冬季降水量模拟误差较小,对夏季降水量模拟误差较大。RegCM模式对各月模拟区别不明显。
通过提高区域气候模式水平分辨率,WRF模式和RegCM模式在青藏高原地区的气候模拟都有不同程度的改善,尤其在地形起伏最大的雅鲁藏布江源区。在水平网格间距为10 km或更粗分辨率的情况下,尺度对流过程无法明确解析,从而导致较大的降水误差[32],有必要提高水平分辨率至4 km以内,构建对流解析分辨率区域气候模式,进一步提高青藏高原复杂地形区的气候模拟能力。但仅提高水平分辨率并不能全面解决青藏高原地区气候模拟误差,模式的气象驱动数据、复杂下垫面特征对气候的反馈作用、模式物理过程参数化方案等方面的改进也尤为重要[33]

3 结论

本文评估10 km、25 km和50 km水平分辨率下,区域气候模式WRF模式和RegCM模式对青藏高原地区1989—2008年的气候变化模拟优劣程度,探究水平分辨率的提高对两个模式在青藏高原地区气候模拟能力的影响,得到主要结论如下。
(1) WRF模式模拟气温始终存在冷偏差,但随着水平分辨率的提高其低估量有所减小且对青藏高原中部和西部气温低估的情况有所改善。50 km水平分辨率下RegCM模式模拟气温明显偏高,而在25 km水平分辨率模拟气温偏低。提高至10 km水平分辨率RegCM模式模拟气温误差最小且对青藏高原气温空间分布的模拟效果有所改善。随着水平分辨率的提高,WRF模式和RegCM模式四季气温模拟与实测数据的相关性提高。
(2) WRF模式25 km水平分辨率模拟年、四季降水量与实测降水量的相关程度最好,且该模式对青藏高原东南部降水量存在明显高估,10 km水平分辨率下对东南部和南部的降水量高估有所改善。RegCM模式随着水平分辨率的提高对全年降水量的模拟逐渐接近实测值,并对整体降水量的空间分布模拟有所改善。高水平分辨率有助于模式对青藏高原降水的模拟,尤其是在地形起伏更大的高山区域。
(3) 在气温模拟中,随着水平分辨率的提高,WRF模式对澜沧江源区、怒江源区的模拟误差减少程度最大;RegCM模式对雅鲁藏布江源区、澜沧江源区的模拟误差减少程度最大。在降水量模拟中,水平分辨率的提高对五个源区的模拟能力都有所改善。WRF模式、RegCM模式由25 km提升为10 km水平分辨率后,误差减少程度最大的均为雅鲁藏布江源区。
[1]
Duan A, Wu G. Change of cloud amount and the climate warming on the Tibetan Plateau[J]. Geophysical Research Letters, 2006, 33(22): 217-234.

[2]
杨昭明, 张调风. 1961—2017年青藏高原东北部雨季降水量变化及其贡献度分析[J]. 干旱区研究, 2021, 38(1): 22-28.

[Yang Zhaoming, Zhang Tiaofeng. Analysis of precipitation change and its contribution in the rainy season in the northeast Qinghai-Tibet Plateau from 1961 to 2017[J]. Arid Zone Research, 2021, 38(1): 22-28.]

[3]
Liu X, Chen B. Climatic warming in the Tibetan Plateau during recent decades[J]. International Journal of Climatology, 2000, 20(14): 1729-1742.

DOI

[4]
杨耀先, 胡泽勇, 路富全, 等. 青藏高原近60年来气候变化及其环境影响研究进展[J]. 高原气象, 2022, 41(1): 1-10.

DOI

[Yang Yaoxian, Hu Zeyong, Lu Fuquan, et al. Progress of recent 60 years’ climate change and its environmental impacts on the Qinghai-Xizang Plateau[J]. Plateau Meteorology, 2022, 41(1): 1-10.]

DOI

[5]
Wang A, Zeng X. Evaluation of multireanalysis products with in situ observations over the Tibetan Plateau[J]. Journal of Geophysical Research: Atmospheres, 2012, 117(D5): 2011JD016553.

[6]
Giorgi F, Gutowski W J. Regional dynamical downscaling and the CORDEX initiative[J]. Annual Review of Environment and Resources, 2015, 40: 467-490.

DOI

[7]
Gao X, Giorgi F. Use of the RegCM system over east Asia: Review and Perspectives[J]. Engineering, 2017, 3(5): 766-772.

DOI

[8]
王澄海, 余莲. 区域气候模式对不同的积云参数化方案在青藏高原地区气候模拟中的敏感性研究[J]. 大气科学, 2011, 35(6): 1132.

[Wang Chenghai, Yu Lian. Sensitivity of regional climate model to different cumulus parameterization schemes in simulation of the Tibetan Plateau climate[J]. Chinese Journal of Atmospheric Sciences, 2011, 35(6): 1132-1144.]

[9]
吴遥, 李跃清, 蒋兴文, 等. WRF模拟青藏高原东南部极端旱涝年降水的参数敏感性研究[J]. 高原气象, 2017, 36(3): 619-631.

DOI

[Wu Yao, Li Yueqing, Jiang Xingwen, et al. Parameters sensitivity analysis on simulation of rainfall in drought-flood year on Qinghai-Tibetan Plateau by WRF model[J]. Plateau Meteorology, 2017, 36(3): 619-631.]

DOI

[10]
吕光辉, 于恩涛, 向伟玲, 等. WRF模式分辨率对新疆异常降雨天气要素模拟的影响[J]. 气候与环境研究, 2009, 14(1): 85-96.

[ Guanghui, Yu Entao, Xiang Weiling, et al. Effect of horizontal and vertical resolution on WRF simulation of the unusual rainfall event in Xinjiang[J]. Climatic and Environmental Research, 2009, 14(1): 85-96.]

[11]
刘金波, 曾新民, 郑益群. 区域气候模式分辨率对中国夏季气温模拟影响的评估[J]. 气象学报, 2011, 69(3): 534-543.

[Liu Jinbo, Zeng Xinmin, Zheng Yiqun. An assessment of the effects of the resolution of a regional climate model on simulated summer temperatures in China[J]. Acta Meteorologica Sinica, 2011, 69(3): 534-543.]

[12]
Xuan Q, Qian X, Yao Y, et al. Validation of the WRF model for estimating precipitable water vapor at the Ali observatory on the Tibetan Plateau[J]. Publications of the Astronomical Society of the Pacific, 2020, 132(1018): 125003.

DOI

[13]
张芳华, 马旭林, 杨克明. 2003年6月24—25日江南特大暴雨数值模拟和诊断分析[J]. 气象, 2004, 30(1): 28-33.

[Zhang Fanghua, Ma Xulin, Yang Keming. Numerical simulation and diagnostic analysis of a heavy rainfall in Jiangnan area during 24-25 June 2003[J]. Meteorological Monthly, 2004, 30(1): 28-33.]

[14]
何由, 阳坤, 姚檀栋, 等. 基于WRF模式对青藏高原一次强降水的模拟[J]. 高原气象, 2012, 31(5): 1183-1191.

[He You, Yang Kun, Yao Tandong, et al. Numerical simulation of a heavy precipitation in Qinghai-Xizang Plateau based on WRF model[J]. Plateau Meteorology, 2012, 31(5): 1183.]

[15]
Gao Y H, Xu J W, Chen D L, et al. Evaluation of WRF mesoscale climate simulations over the Tibetan Plateau during 1979-2011[J]. Journal of Climate, 2015, 28: 2823-2841.

DOI

[16]
梁玲, 李跃清, 胡豪然, 等. RegCM3模式对青藏高原温度和降水的模拟及检验[J]. 气象科学, 2009, 29(5): 611-617.

[Liang Ling, Li Yueqing, Hu Haoran, et al. Simulation of air temperature and precipitation over Qinghai-Xizang Plateau with RegCM3 model[J]. Journal of the Meteorological Sciences, 2009, 29(5): 611-617.]

[17]
韩振宇, 高学杰, 徐影. 多区域模式集合的东亚陆地区域的平均和极端降水未来预估[J]. 地球物理学报, 2021, 64(6): 1869-1884.

DOI

[Han Zhenyu, Gao Xuejie, Xu Ying. Mean and extreme precipitation projection over land area of East Asia based on multiple regional climate models[J]. Chinese Journal of Geophysics, 2021, 64(6): 1869-1884.]

[18]
Gu H, Yu Z, Peltier W R, et al. Sensitivity studies and comprehensive evaluation of RegCM4.6.1 high-resolution climate simulations over the Tibetan Plateau[J]. Climate Dynamics, 2020, 54(7-8): 3781-3801.

DOI

[19]
He J, Yang K, Tang W, et al. The first high-resolution meteorological forcing dataset for land process studies over China[J]. Scientific Data, 2020, 7: 25.

DOI PMID

[20]
Yang K, He J, Tang W J, et al. On downward shortwave and longwave radiations over high altitude regions: Observation and modeling in the Tibetan Plateau[J]. Agricultural and Forest Meteorology, 2010, 150: 38-46.

DOI

[21]
阳坤, 何杰, 唐文君, 等. 中国区域地面气象要素驱动数据集(1979-2018)[DB/OL]. 国家青藏高原科学数据中心, 2019. https://doi.org/10.11888/AtmosphericPhysics.tpe.249369.file.

[Yang Kun, He Jie, Tang Wenjun, et al. China meteorological forcing dataset (1979-2018)[DB/OL]. National Tibetan Plateau/ Third Pole Environment Data Center, 2019. https://doi.org/10.11888/AtmosphericPhysics.tpe.249369.file.]

[22]
温婷婷, 郭英香, 董少睿, 等. 1979—2017年CRU、ERA5、CMFD格点降水数据在青藏高原适用性评估[J]. 干旱区研究, 2022, 39(3): 684-697.

[Wen Tingting, Guo Yingxiang, Dong Shaorui, et al. Assessment of CRU, ERA5, CMFD grid precipitation data for the Tibetan Plateau from 1979 to 2017[J]. Arid Zone Research, 2022, 39(3): 684-697.]

[23]
吴阳. 夏季青藏高原湖泊群区域气候效应及其作用机理的数值模拟研究[D]. 南京: 南京大学, 2018.

[Wu Yang. Numerical Study of the Regional Climate Effect of Lake Clusters in Tibetan Plateau and Its Working Mechanisms during Summer[D]. Nanjing: Nanjing University, 2008.]

[24]
Taylor K E. Summarizing multiple aspects of model performance in a single diagram[J]. Journal of Geophysical Research: Atmospheres, 2001, 106(D7): 7183-7192.

DOI

[25]
胡清静. 甘肃省1959-2006年气候及主要河流径流特征分析[D]. 兰州: 兰州大学, 2011.

[Hu Qingjing. Characteristic of Climate and Runoff of Main Rivers in Gansu during 1959-2006[D]. Lanzhou: Lanzhou University, 2011.]

[26]
胡芩, 姜大膀, 范广洲. CMIP5全球气候模式对青藏高原地区气候模拟能力评估[J]. 大气科学, 2014, 38(5): 924-938.

[Hu Qin, Jiang Dabang, Fan Guangzhou. Evaluation of CMIP5 models over the Qinghai-Tibetan Plateau[J]. Chinese Journal of Atmospheric Sciences, 2014, 38(5): 924-938.]

[27]
New M, Hulme M, Jones P. Representing twentieth-century space-time climate variability. Part I: Development of a 1961-90 mean monthly terrestrial climatology[J]. Journal of Climate, 1999, 12(3): 829-856.

DOI

[28]
Rahimi S R, Wu C, Liu X, et al. Exploring a variable-resolution approach for simulating regional climate over the Tibetan Plateau using VR-CESM[J]. Journal of Geophysical Research: Atmospheres, 2019, 124(8): 4490-4513.

DOI

[29]
Ou T, Chen D, Chen X, et al. Simulation of summer precipitation diurnal cycles over the Tibetan Plateau at the gray-zone grid spacing for cumulus parameterization[J]. Climate Dynamics, 2020, 54: 3525-3539.

DOI

[30]
Fu Y, Ma Y, Zhong L, et al. Land-surface processes and summer-cloud-precipitation characteristics in the Tibetan Plateau and their effects on downstream weather: A review and perspective[J]. National Science Review, 2020, 7(3): 500-515.

DOI PMID

[31]
Zhao D, Lin Y, Dong W, et al. Alleviated WRF summer wet bias over the Tibetan Plateau using a new cloud macrophysics scheme[J]. Journal of Advances in Modeling Earth Systems, 2023, 15(10): e2023MS003616.

[32]
熊喆, 宋长青. 对流解析区域气候模式对青藏高原降水模拟能力的研究[J]. 北京师范大学学报(自然科学版), 2022, 58(2): 337-347.

[Xiong Zhe, Song Changqing. Convection-permitting regional climate model to simulate precipitation in the Qinghai-Tibet Plateau[J]. Journal of Beijing Normal University (Natural Science), 2022, 58(2): 337-347.]

[33]
高艳红, 许建伟, 张萌, 等. 青藏高原气候动力降尺度——从1/4度到公里尺度[J]. 中国科学: 地球科学, 2022, 32(12): 2342-2352.

[Gao Yanhong, Xu Jianwei, Zhang Meng, et al. Regional climate dynamical downscaling over the Tibetan Plateau—From quarter-degree to kilometer-scale[J]. Scientia Sinica (Terrae), 2022, 32(12): 2237-2247.]

Outlines

/