
Characteristics of soil moisture dynamics and influencing factors of three landscape types at the oasis edge in the middle reaches of the Heihe River
Received date: 2023-11-27
Revised date: 2024-01-18
Online published: 2024-06-20
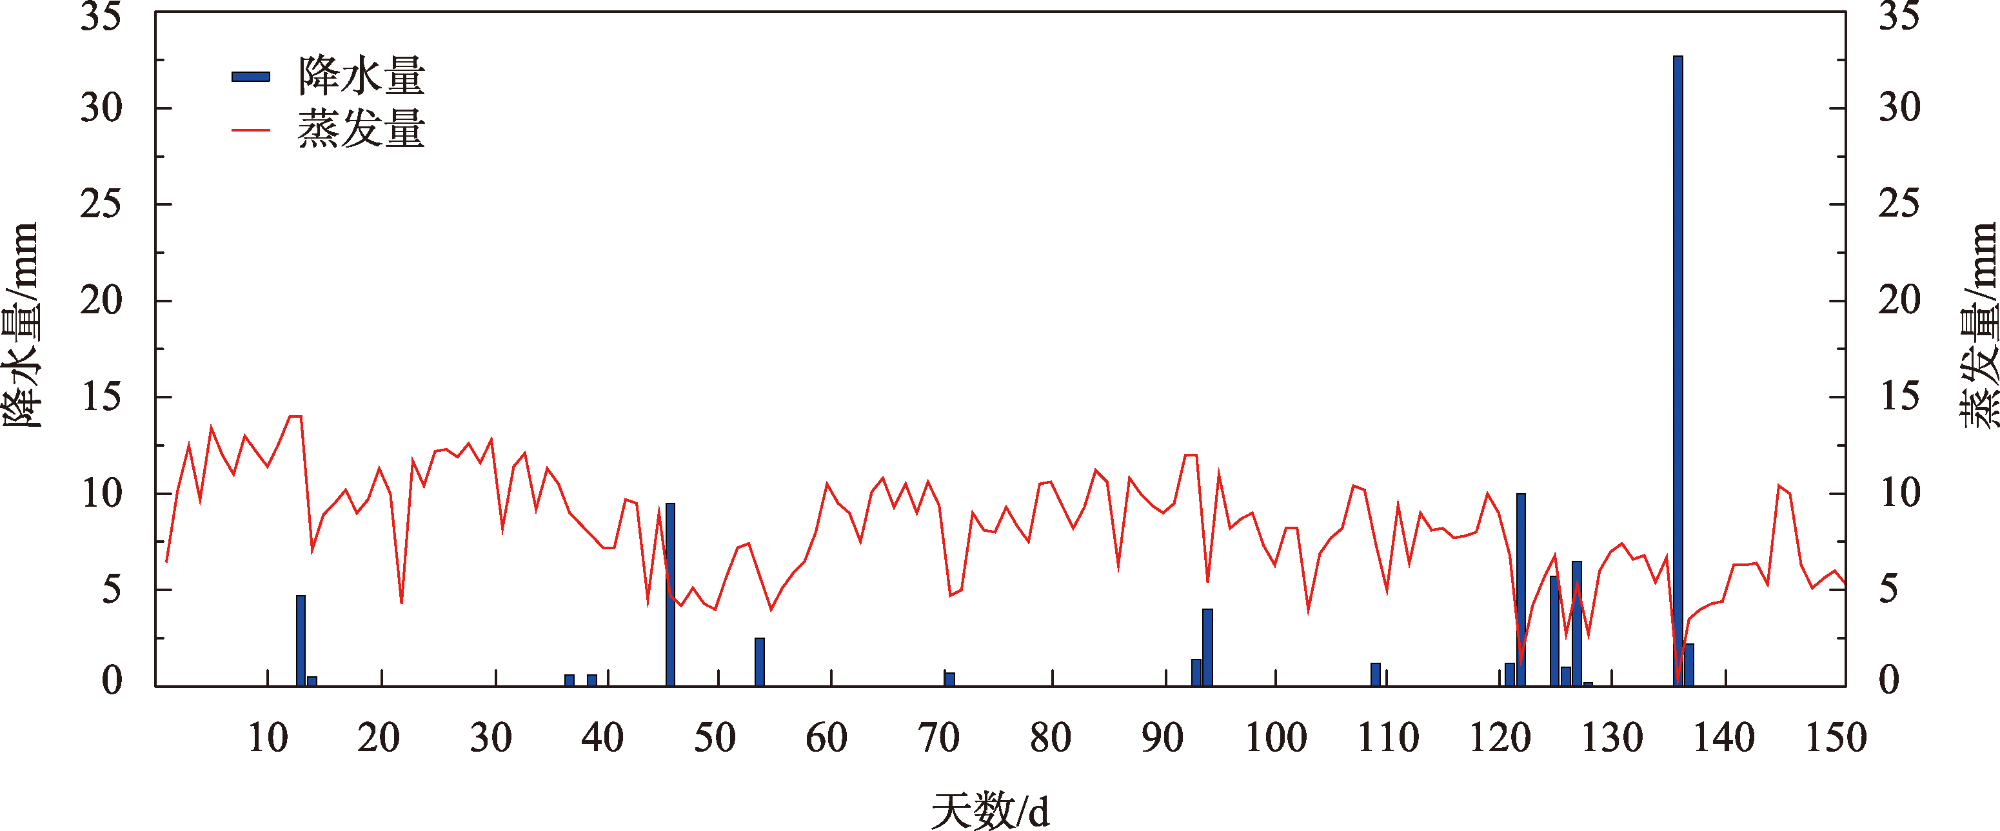
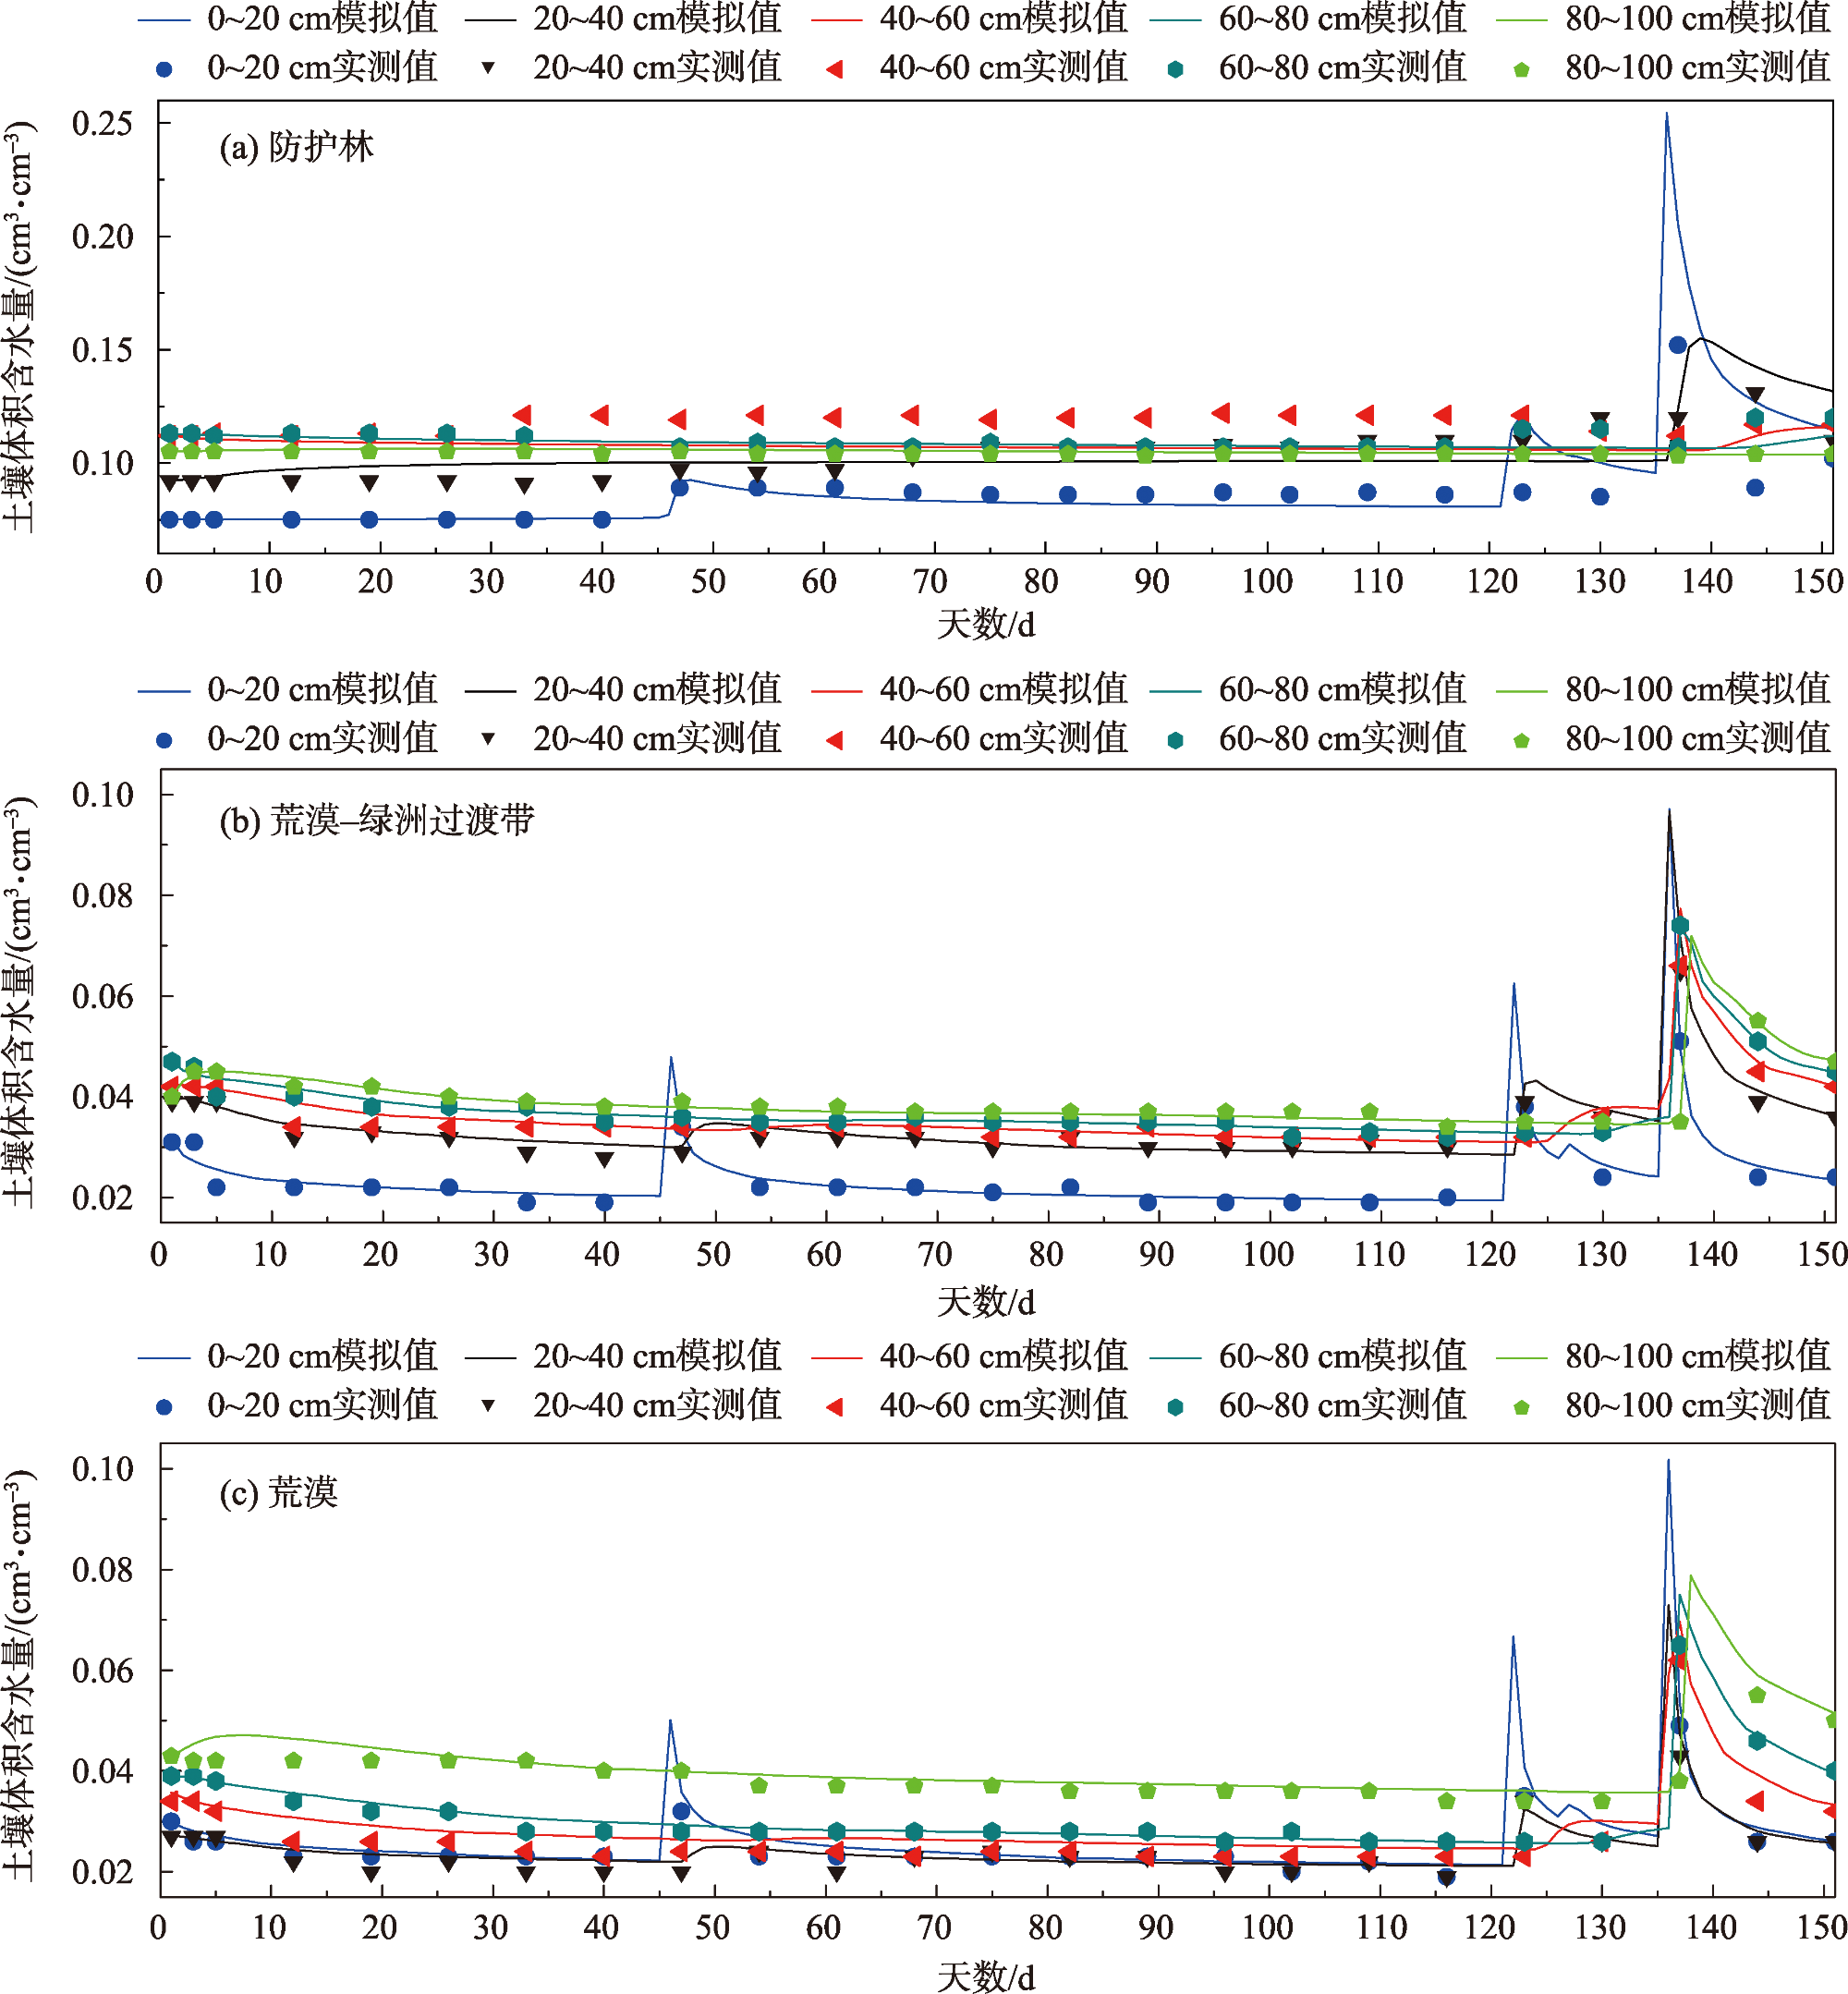
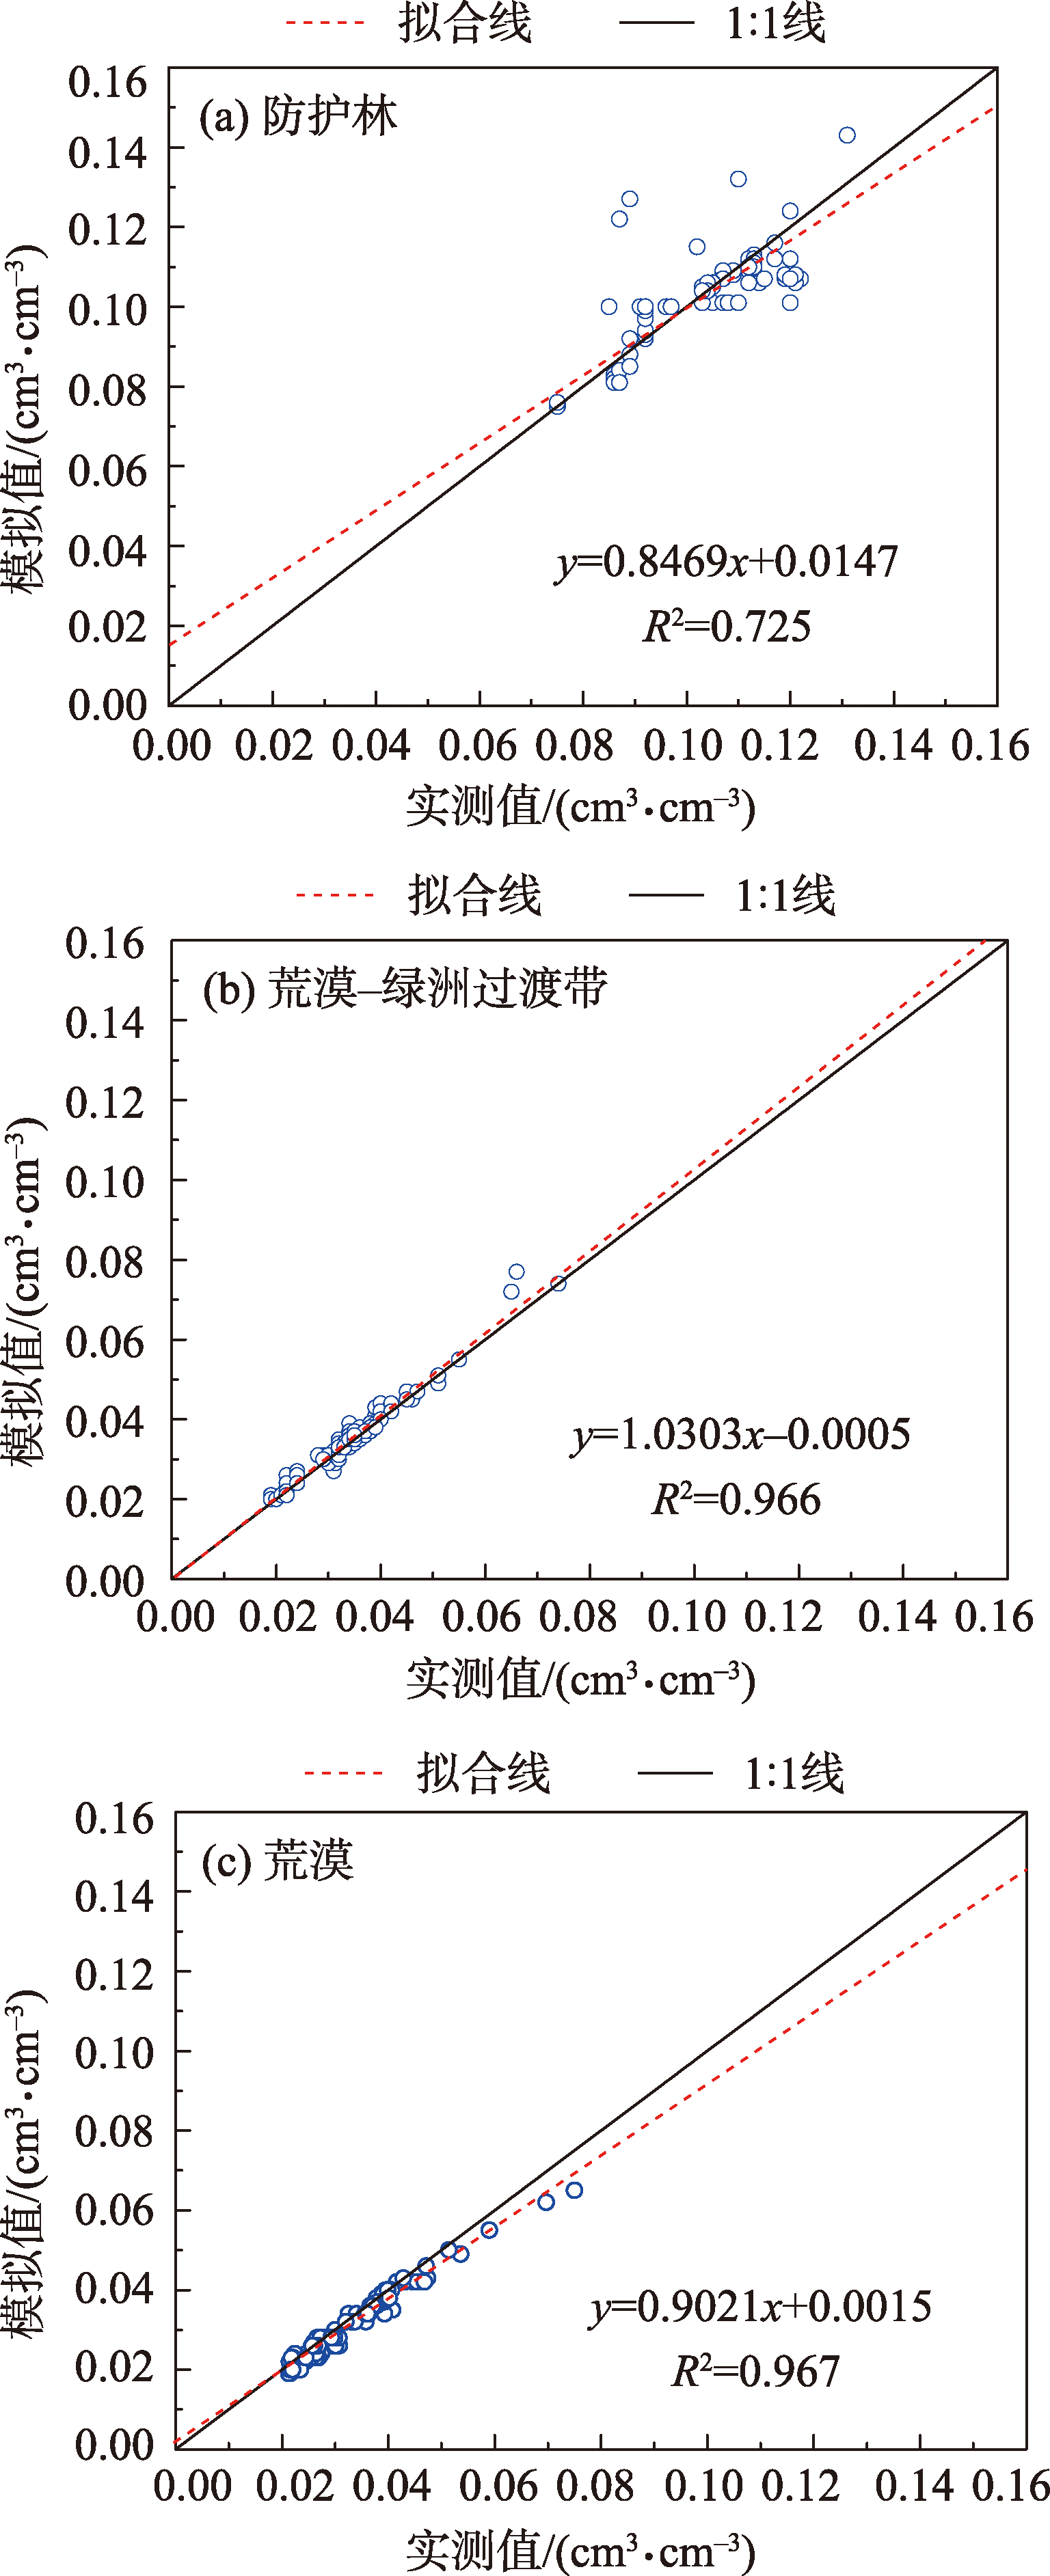
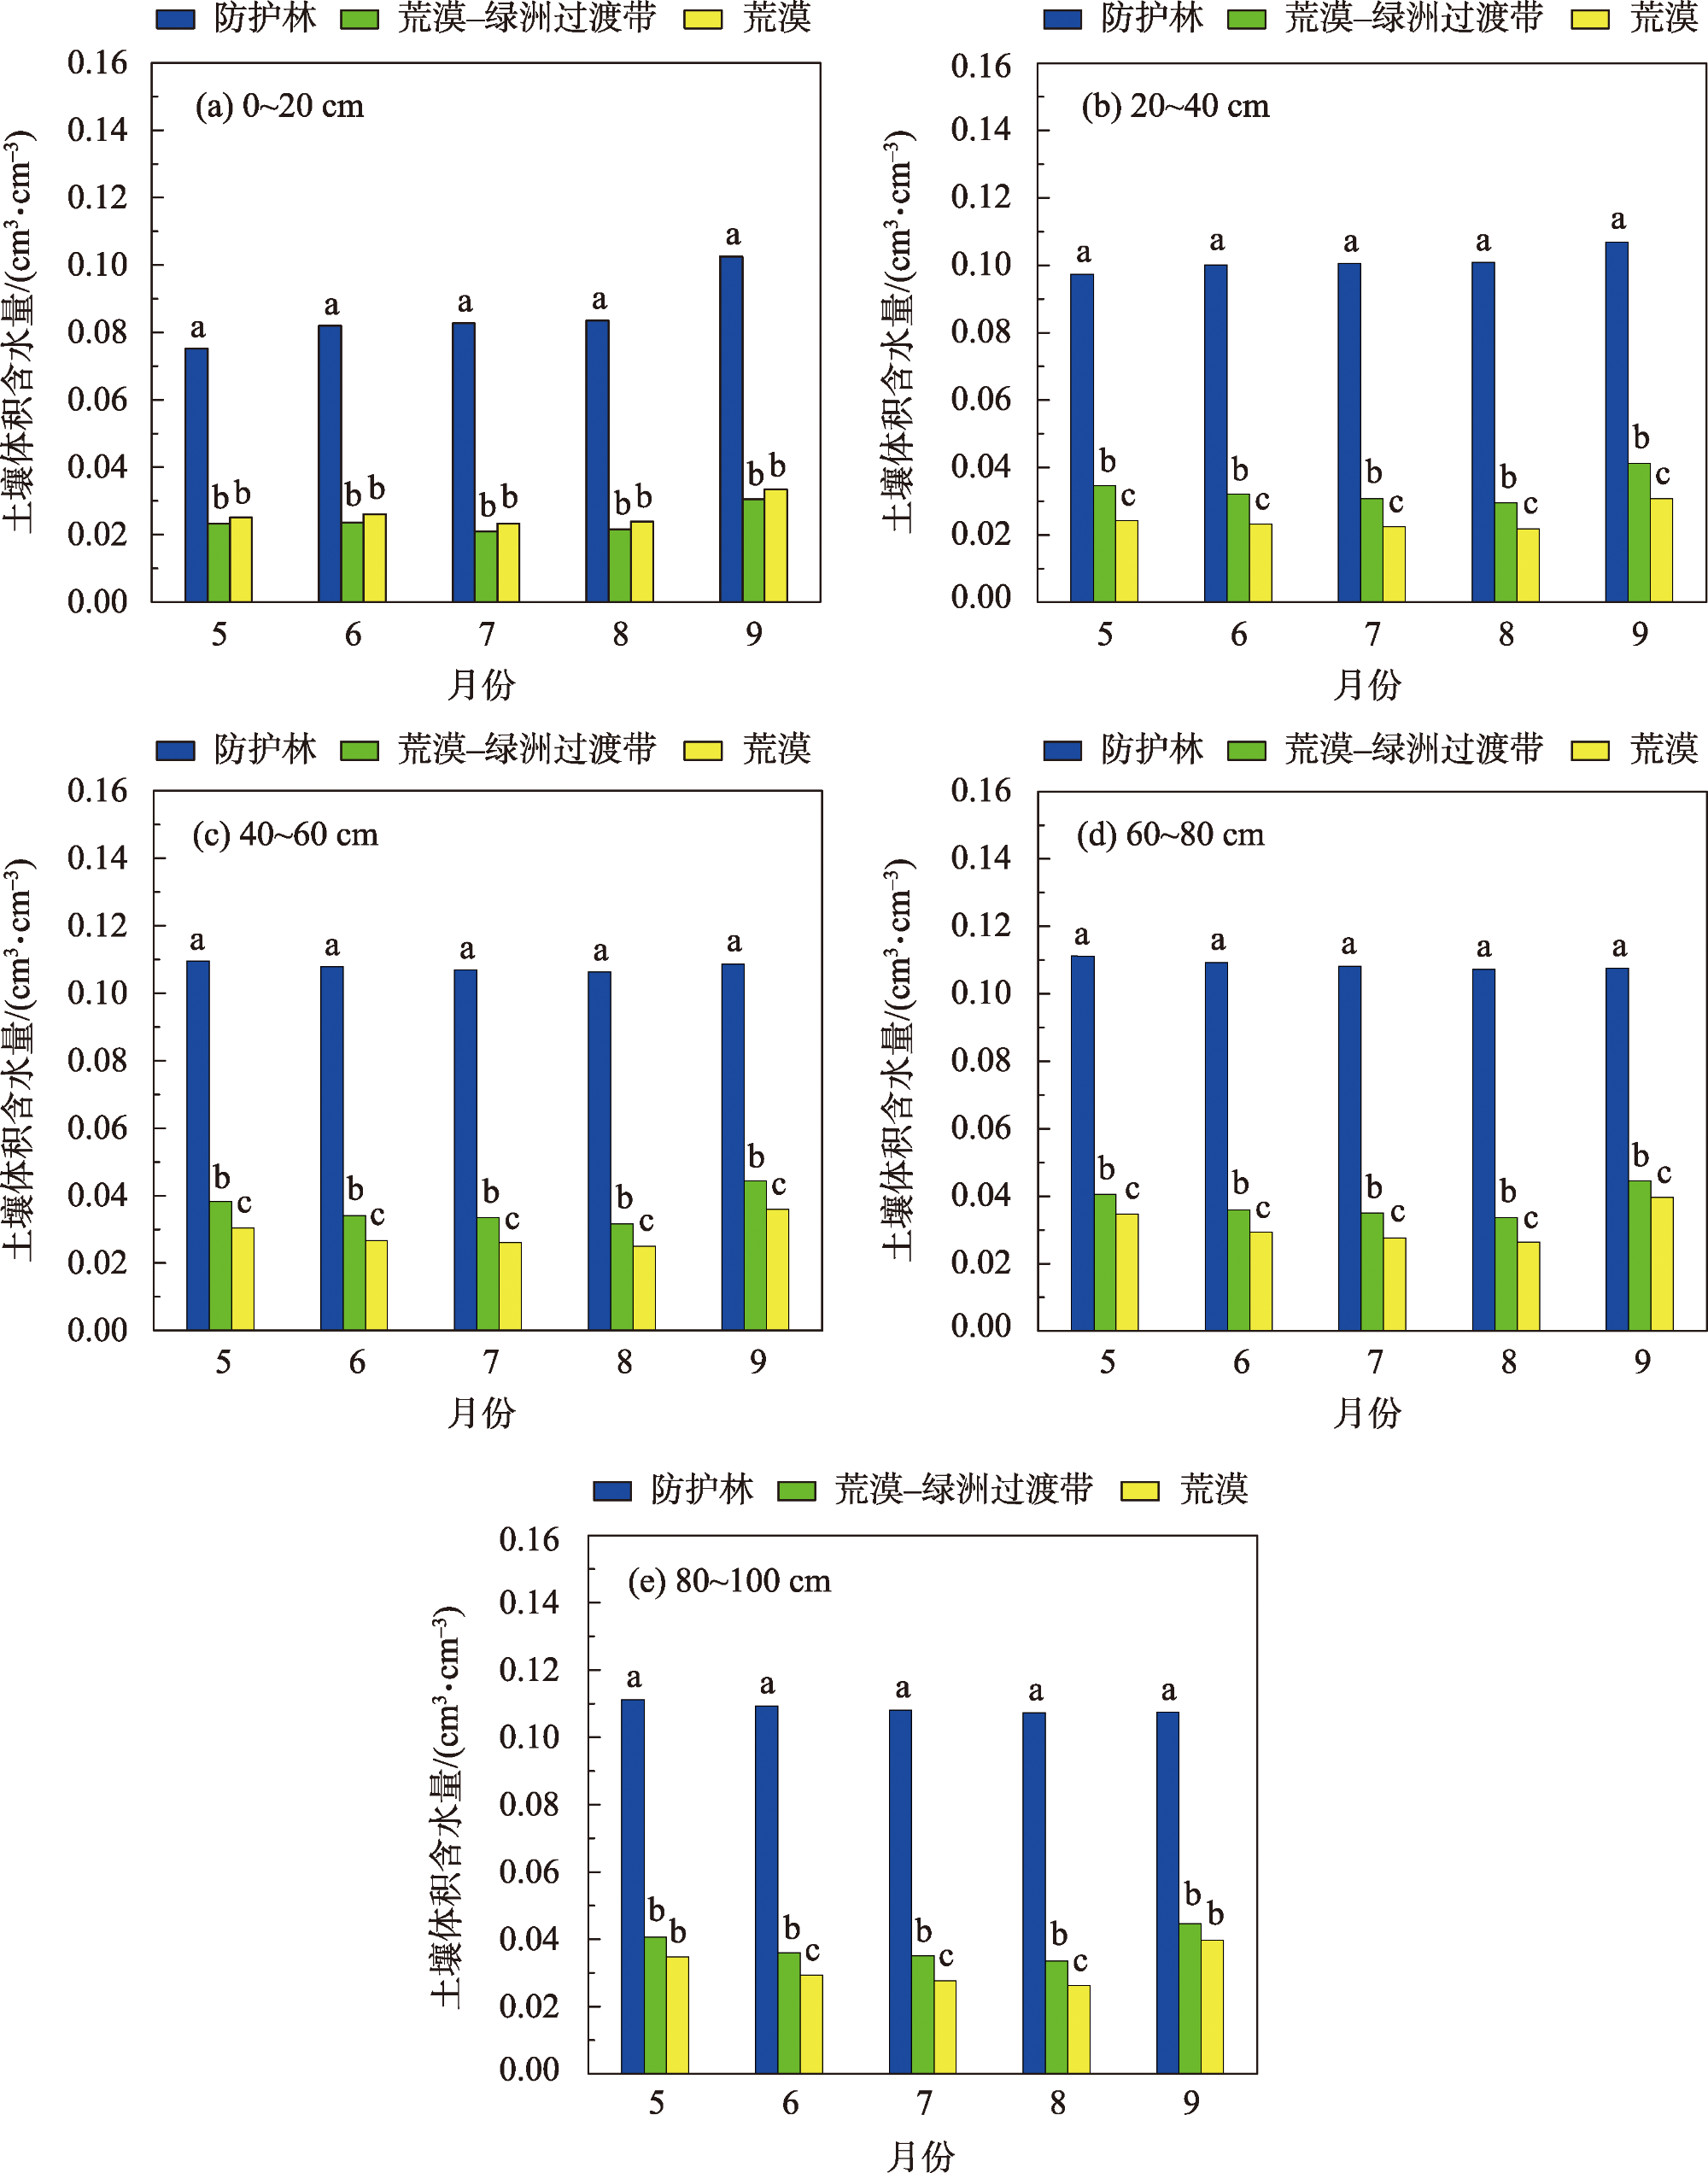
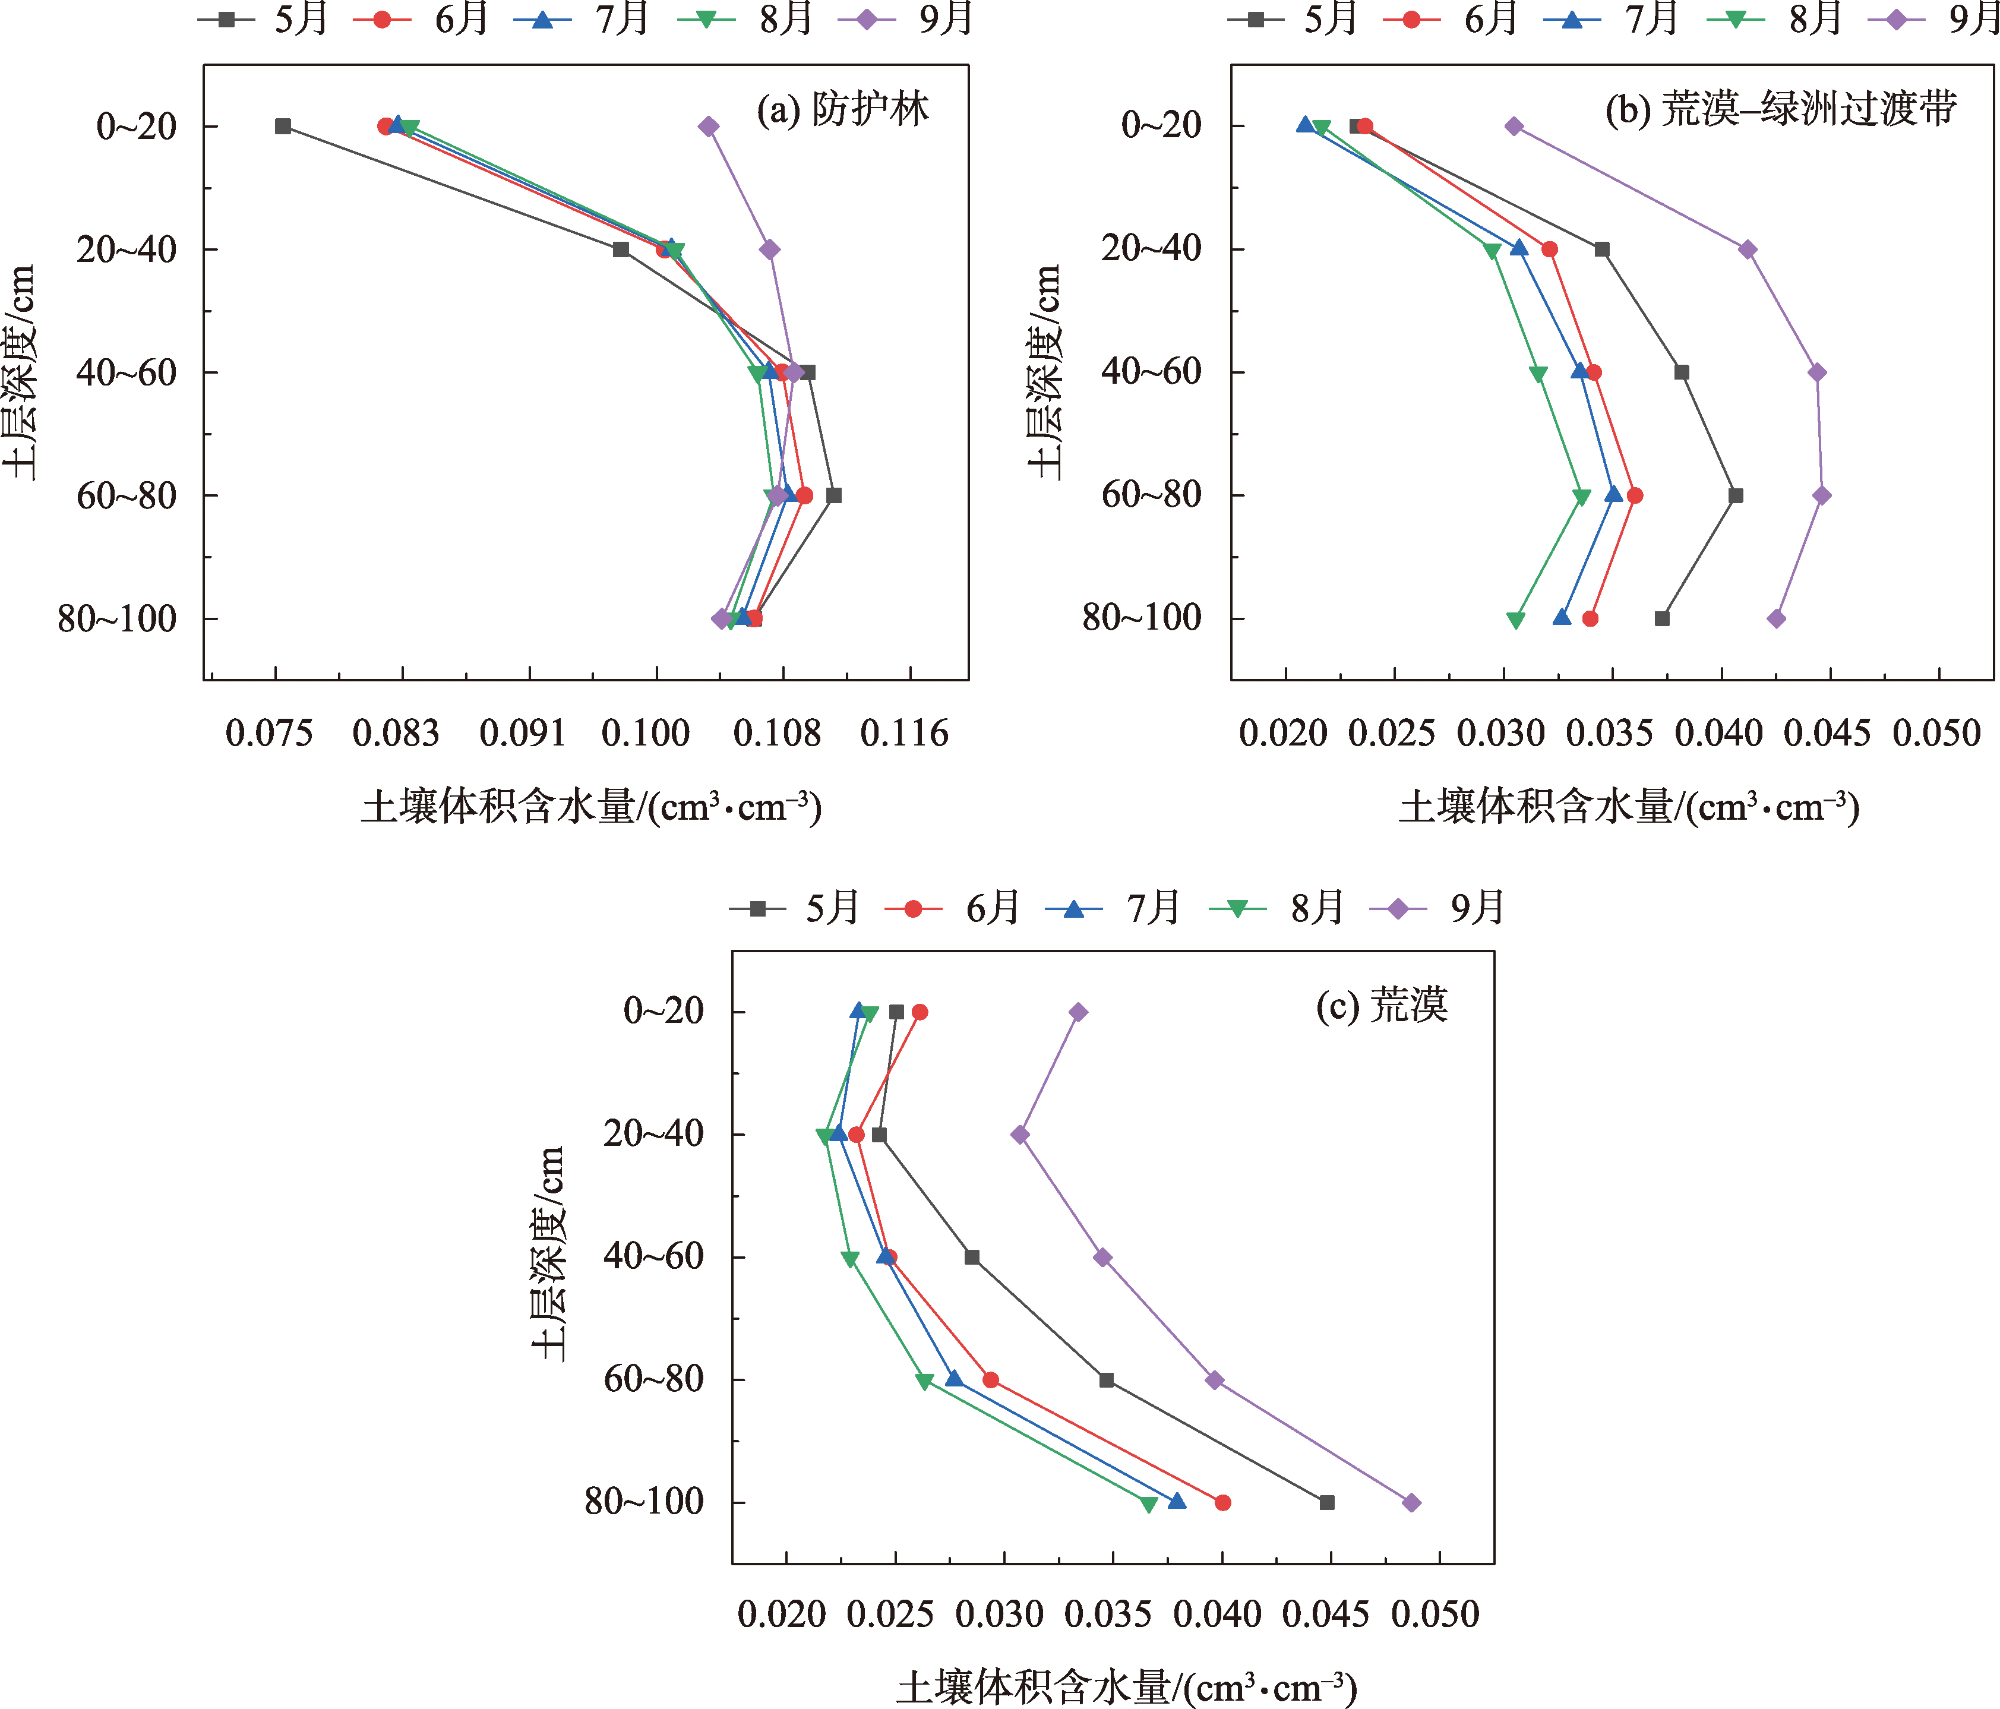
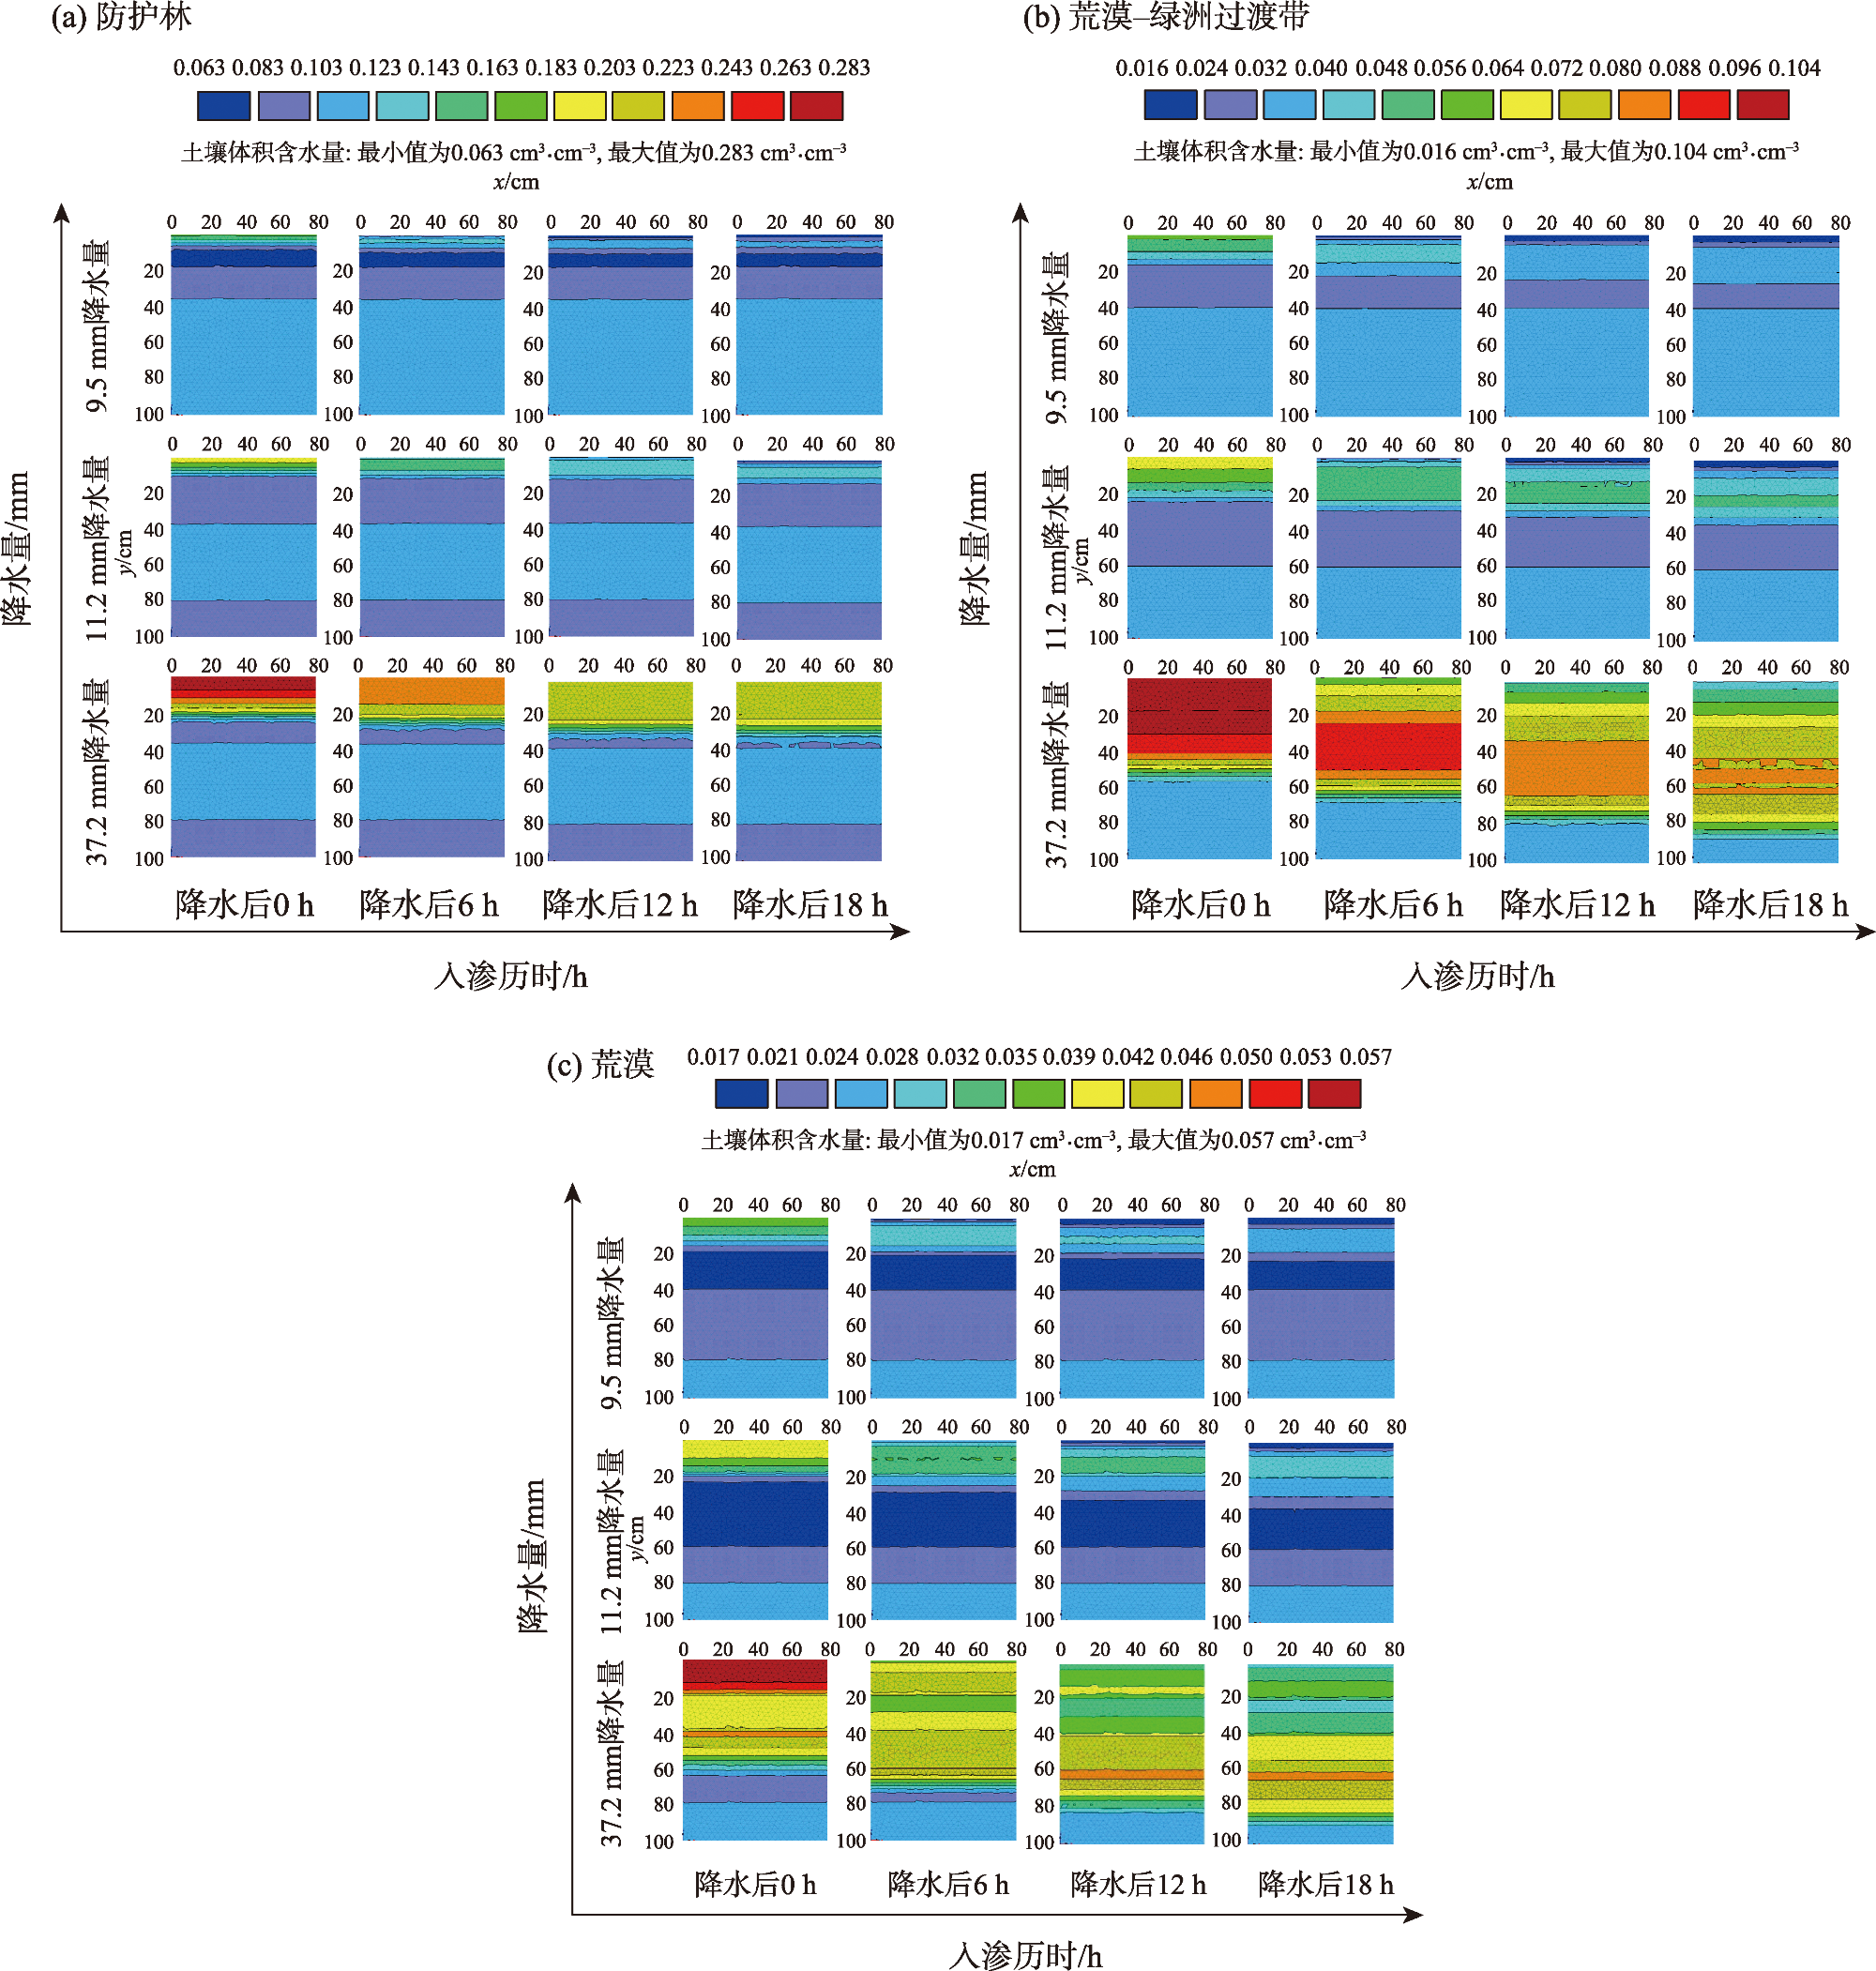
Soil moisture is indispensable for the growth and development of plants in arid zones and determines the dynamics and direction of the succession of arid plant communities. It is particularly important to investigate the dynamic characteristics of soil moisture in different landscape types at the edge of the oasis in the middle reaches of the Heihe River and to develop effective, scientific, and reasonable measures to prevent wind and fix sand to prevent desertification. This study focused on three landscape types—protected forest landscapes, desert-oasis transition zone landscapes, and desert landscapes—at the edge of the oasis in the middle reaches of the Heihe River. HYDRUS-2D model simulation, LSD analysis, and Pearson correlation analysis were used to study the characteristics of soil moisture dynamics and the influencing factors of the three landscape types. The results were as follows: (1) the RMSE of soil volumetric water content ranged from 0.002 to 0.006 cm3·cm-3, MRE ranged from 4.22% to 5.20%, and R2 ranged from 0.725 to 0.967. The simulation results showed a high degree of agreement with the measured data, and the HYDRUS-2D model can be used for simulation studies of soil moisture in this study area. (2) The soil volumetric water content of protected forest landscapes and desert-oasis transition zone landscapes showed a trend of initial increase and subsequent decrease with increasing soil depth, whereas desert landscapes showed a trend of initial decrease and subsequent increase with increasing soil depth. (3) Effective precipitation plays a decisive role in the dynamics of the soil volumetric water content, and precipitation above 9.5 mm significantly increases the soil moisture content and infiltration depth over a short period. The depth of soil moisture infiltration in all periods after precipitation in desert landscapes was higher than that in protected forest landscapes and desert-oasis transition zone landscapes. (4) The soil volumetric water content of the three landscape types was related to factors such as precipitation, evapotranspiration, bulkiness, soil granular composition, and soil water-holding properties. The soil water-holding properties were significantly correlated with factors such as precipitation and evapotranspiration (P<0.01). Of these, precipitation and clay-powder grain content were significantly positively correlated with soil volumetric water content, whereas bulk weight and sand grain content were significantly negatively correlated with soil volumetric water content. Thus, planting windbreak shrubs in the study area can increase the content of soil sticky powder particles, improve the ability of the soil to collect and utilize rainwater, and slow the process of infiltration, thus positively affecting the soil water-holding properties.
HU Guanglu , LIU Peng , LI Jia’nan , TAO Hu , ZHOU Chengqian . Characteristics of soil moisture dynamics and influencing factors of three landscape types at the oasis edge in the middle reaches of the Heihe River[J]. Arid Zone Research, 2024 , 41(4) : 550 -565 . DOI: 10.13866/j.azr.2024.04.03
表1 三种景观类型的土壤容重及颗粒组成Tab. 1 Bulk density and particle composition of soil in three landscape types |
| 景观类型 | 土层 深度 /cm | 土壤 容重/ (g·cm-3) | 土壤颗粒含量/% | ||
|---|---|---|---|---|---|
| 黏粒 (≤2 μm) | 粉粒 (2~50 μm) | 砂粒 (≥50 μm) | |||
| 防护林 | 0~20 | 1.43 | 2.58 | 34.99 | 62.43 |
| 20~40 | 1.42 | 2.93 | 36.92 | 60.15 | |
| 40~60 | 1.37 | 3.59 | 46.65 | 49.76 | |
| 60~80 | 1.31 | 3.69 | 53.79 | 42.52 | |
| 80~100 | 1.42 | 2.92 | 40.11 | 56.97 | |
| 荒漠- 绿洲 过渡带 | 0~20 | 1.65 | 0.17 | 3.13 | 96.70 |
| 20~40 | 1.60 | 0.17 | 3.21 | 96.62 | |
| 40~60 | 1.60 | 0.17 | 3.51 | 96.32 | |
| 60~80 | 1.58 | 0.18 | 3.48 | 96.34 | |
| 80~100 | 1.55 | 0.17 | 3.20 | 96.63 | |
| 荒漠 | 0~20 | 1.55 | 0.04 | 4.51 | 95.45 |
| 20~40 | 1.53 | 0.05 | 3.11 | 96.84 | |
| 40~60 | 1.48 | 0.04 | 4.49 | 95.47 | |
| 60~80 | 1.48 | 0.04 | 7.73 | 92.23 | |
| 80~100 | 1.46 | 0.16 | 7.83 | 92.01 | |
表2 三种景观类型的土壤水分特征参数Tab. 2 Characteristic parameters of soil moisture in three landscape types |
| 景观 类型 | 土层 深度 /cm | 残余含 水量θr /(cm3·cm-3) | 饱和含 水量θs /(cm3·cm-3) | 进气 吸力α /cm-1 | 形状 系数 n | 饱和 导水率 Ks/(cm·d-1) |
|---|---|---|---|---|---|---|
| 防护林 | 0~20 | 0.034 | 0.39 | 0.033 | 1.43 | 143.57 |
| 20~40 | 0.034 | 0.39 | 0.029 | 1.43 | 67.72 | |
| 40~60 | 0.029 | 0.36 | 0.015 | 1.47 | 58.13 | |
| 60~80 | 0.028 | 0.35 | 0.009 | 1.55 | 69.44 | |
| 80~100 | 0.029 | 0.36 | 0.022 | 1.44 | 63.46 | |
| 荒漠- 绿洲 过渡带 | 0~20 | 0.016 | 0.34 | 0.033 | 3.79 | 427.90 |
| 20~40 | 0.023 | 0.35 | 0.033 | 3.90 | 446.60 | |
| 40~60 | 0.024 | 0.35 | 0.033 | 3.84 | 455.60 | |
| 60~80 | 0.025 | 0.36 | 0.033 | 3.88 | 483.20 | |
| 80~100 | 0.027 | 0.37 | 0.032 | 3.98 | 569.80 | |
| 荒漠 | 0~20 | 0.017 | 0.34 | 0.037 | 3.22 | 456.65 |
| 20~40 | 0.019 | 0.34 | 0.032 | 4.24 | 1182.54 | |
| 40~60 | 0.020 | 0.37 | 0.034 | 3.75 | 960.86 | |
| 60~80 | 0.016 | 0.36 | 0.037 | 3.17 | 530.96 | |
| 80~100 | 0.025 | 0.36 | 0.038 | 3.10 | 530.61 |
表3 三种景观类型的土壤体积含水量模拟结果检验Tab. 3 Examination of simulation results of soil volumetric water content in three landscape types |
| 景观类型 | RMSE/(cm3·cm-3) | MRE/% | R2 |
|---|---|---|---|
| 防护林 | 0.006 | 5.20 | 0.725 |
| 荒漠-绿洲过渡带 | 0.002 | 4.37 | 0.966 |
| 荒漠 | 0.002 | 4.22 | 0.967 |
表4 防护林景观土壤体积含水量模拟值与其影响因子的相关关系Tab. 4 Correlation between modelled values of volumetric soil water content in protection forest landscapes and their influencing factors |
| 体积含水量 | 降水 | 蒸发 | 容重 | 黏粒 | 粉粒 | 砂粒 | 残余含水量 | 饱和含水量 | 饱和导水率 | |
|---|---|---|---|---|---|---|---|---|---|---|
| 体积含水量 | 1 | |||||||||
| 降水 | 0.168** | 1 | ||||||||
| 蒸发 | -0.225** | -0.322** | 1 | |||||||
| 容重 | -0.318** | 0 | 0 | 1 | ||||||
| 黏粒 | 0.411** | 0 | 0 | -0.916** | 1 | |||||
| 粉粒 | 0.365** | 0 | 0 | -0.979** | 0.950** | 1 | ||||
| 砂粒 | -0.369** | 0 | 0 | 0.978** | -0.955** | -1.000** | 1 | |||
| 残余含水量 | -0.374** | 0 | 0 | 0.722** | -0.785** | -0.843** | 0.842** | 1 | ||
| 饱和含水量 | -0.373** | 0 | 0 | 0.767** | -0.804** | -0.875** | 0.874** | 0.997** | 1 | |
| 饱和导水率 | -0.485** | 0 | 0 | 0.412** | -0.664** | -0.528** | 0.538** | 0.627** | 0.609** | 1 |
注:**表示置信度在(P<0.01)水平(双尾)上极显著相关。下同。 |
表5 荒漠-绿洲过渡带景观土壤体积含水量模拟值与其影响因子的相关关系Tab. 5 Correlation between modelled values of volumetric soil water content in desert-oasis transition zone landscapes and their influencing factors |
| 体积含水量 | 降水 | 蒸发 | 容重 | 黏粒 | 粉粒 | 砂粒 | 残余含水量 | 饱和含水量 | 饱和导水率 | |
|---|---|---|---|---|---|---|---|---|---|---|
| 体积含水量 | 1 | |||||||||
| 降水 | 0.245** | 1 | ||||||||
| 蒸发 | -0.193** | -0.322** | 1 | |||||||
| 容重 | -0.583** | 0 | 0 | 1 | ||||||
| 黏粒 | 0.201** | 0 | 0 | -0.245** | 1 | |||||
| 粉粒 | 0.332** | 0 | 0 | -0.273** | 0.554** | 1 | ||||
| 砂粒 | -0.333** | 0 | 0 | 0.275** | -0.571** | -1.000** | 1 | |||
| 残余含水量 | 0.613** | 0 | 0 | -0.967** | 0.267** | 0.463** | -0.463** | 1 | ||
| 饱和含水量 | 0.534** | 0 | 0 | -0.974** | 0.294** | 0.172** | -0.177** | 0.891** | 1 | |
| 饱和导水率 | 0.440** | 0 | 0 | -0.888** | 0.066 | -0.040 | 0.038 | 0.756** | 0.950** | 1 |
表6 荒漠景观土壤体积含水量模拟值与其影响因子的相关关系Tab. 6 Correlation between modelled values of volumetric soil water content in desert landscapes and their influencing factors |
| 体积含水量 | 降水 | 蒸发 | 容重 | 黏粒 | 粉粒 | 砂粒 | 残余含水量 | 饱和含水量 | 饱和导水率 | |
|---|---|---|---|---|---|---|---|---|---|---|
| 体积含水量 | 1 | |||||||||
| 降水 | 0.249** | 1 | ||||||||
| 蒸发 | -0.193** | -0.322** | 1 | |||||||
| 容重 | -0.515** | 0 | 0 | 1 | ||||||
| 黏粒 | 0.361** | 0 | 0 | -0.045 | 1 | |||||
| 粉粒 | 0.386** | 0 | 0 | -0.301** | 0.753** | 1 | ||||
| 砂粒 | -0.388** | 0 | 0 | 0.296** | -0.765** | -1.000** | 1 | |||
| 残余含水量 | 0.477** | 0 | 0 | -0.562** | 0.418** | 0.037 | -0.048 | 1 | ||
| 饱和含水量 | 0.500** | 0 | 0 | -0.961** | 0.105** | 0.495** | -0.487** | 0.369** | 1 | |
| 饱和导水率 | -0.322** | 0 | 0 | 0.148** | -0.782** | -0.987** | 0.988** | 0.039 | -0.352** | 1 |
| [1] |
郝丽娜, 粟晓玲. 黑河干流中游地区适宜绿洲及耕地规模确定[J]. 农业工程学报, 2015, 31(10): 262-268.
[
|
| [2] |
胡广录, 陶虎, 焦娇, 等. 黑河中游正义峡径流变化趋势及归因分析[J]. 干旱区研究, 2023, 40(9): 1414-1424.
[
|
| [3] |
苏永中, 杨晓, 杨荣. 黑河中游边缘荒漠-绿洲非饱和带土壤质地对土壤氮积累与地下水氮污染的影响[J]. 环境科学, 2014, 35(10): 3683-3691.
[
|
| [4] |
胡广录, 陈海志, 麻进, 等. 黑河中游荒漠绿洲过渡带典型灌丛植物防风固沙效应[J]. 中国沙漠, 2023, 43(5): 31-40.
[
|
| [5] |
肖庆礼, 黄明斌, 邵明安, 等. 黑河中游绿洲不同质地土壤水分的入渗与再分布[J]. 农业工程学报, 2014, 30(2): 124-131.
[
|
| [6] |
王金哲, 张光辉, 王茜, 等. 西北干旱区地下水生态功能评价指标体系构建与应用[J]. 地质学报, 2021, 95(5): 1573-1581.
[
|
| [7] |
周川, 胡广录, 邓丽媛, 等. 黑河中游不同景观类型土壤有机质与含水率变化特征[J]. 甘肃农业大学学报, 2021, 56(4): 126-135.
[
|
| [8] |
孙雪, 龙永丽, 刘乐, 等. 河西走廊中段荒漠绿洲土壤生态化学计量特征[J]. 环境科学, 2023, 44(6): 3353-3363.
[
|
| [9] |
赵文玥, 吉喜斌, 金博文, 等. 西北干旱区泡泡刺灌丛的降雨再分配特征及影响因素分析[J]. 生态学报, 2022, 42(2): 804-817.
[
|
| [10] |
周宏. 基于多入渗模型的荒漠砂质土壤积水入渗模拟对比[J]. 干旱区研究, 2022, 39(1): 123-134.
[
|
| [11] |
李昌盛, 张志山, 张金林, 等. 荒漠-绿洲区土壤性质过渡特征[J]. 中国沙漠, 2022, 42(4): 209-218.
[
|
| [12] |
赵文智, 任珩, 杜军, 等. 河西走廊绿洲生态建设和农业发展的若干思考与建议[J]. 中国科学院院刊, 2023, 38(3): 424-434.
[
|
| [13] |
何志斌, 赵文智, 方静. 黑河中游地区植被生态需水量估算[J]. 生态学报, 2005, 25(4): 705-710.
[
|
| [14] |
赵文智, 程国栋. 干旱区生态水文过程研究若干问题评述[J]. 科学通报, 2001, 46(22): 1851-1857.
[
|
| [15] |
张克海, 胡广录, 方桥, 等. 黑河中游荒漠绿洲过渡带固沙植被根区土壤含水量[J]. 中国沙漠, 2020, 40(3): 33-42.
[
|
| [16] |
易军. 黑河中游不同景观单元水分运动与景观间水量交换[D]. 杨凌: 西北农林科技大学, 2016.
[
|
| [17] |
蒋小芳, 段翰晨, 廖杰, 等. 基于PLUS-SD耦合模型的黑河流域中游甘临高地区土地利用研究[J]. 干旱区研究, 2022, 39(4): 1246-1258.
[
|
| [18] |
|
| [19] |
洪光宇, 王晓江, 刘铁山, 等. 基于Hydrus-1D模型的毛乌素沙地杨柴(Hedysarum laeve)灌木林土壤含水量模拟[J]. 中国沙漠, 2022, 42(6): 233-242.
[
|
| [20] |
洪光宇, 王晓江, 苏庆溥, 等. 毛乌素沙地流动沙丘土壤水分模拟及渗漏特征[J]. 中国沙漠, 2023, 43(2): 288-298.
[
|
| [21] |
王宇祥, 刘廷玺, 段利民, 等. 科尔沁不同类型沙丘土壤水分时空变化特征及其环境影响因子[J]. 水土保持学报, 2020, 34(6): 125-134, 142.
[
|
| [22] |
代智光. 基于Hydrus-2D的红壤区涌泉根灌自由入渗土壤水分运移数值模拟[J]. 干旱地区农业研究, 2020, 38(4): 27-31.
[
|
| [23] |
王宇祥, 刘廷玺, 段利民, 等. 基于Hydrus-1D模型的科尔沁沙地沙丘-草甸相间区土壤水分动态模拟[J]. 中国沙漠, 2020, 40(2): 195-205.
[
|
| [24] |
吉吉佳门, 程一本, 谌玲珑, 等. 科尔沁沙地樟子松人工林土壤水分动态及其对降雨的响应[J]. 干旱区研究, 2023, 40(5): 756-766.
[
|
| [25] |
|
| [26] |
付玉娟, 李尧, 喻浩洋, 等. Hydrus-2D模拟起垄覆膜处理对夏玉米生育期水量平衡的影响[J]. 农业工程学报, 2023, 39(10): 76-87.
[
|
| [27] |
张炜, 王浩远, 赵玉华, 等. 基于HYDRUS-1D生物滞留设施雨水径流水文调控模拟[J]. 水资源保护, 2022, 38(3): 102-108.
[
|
| [28] |
郭勇, 尹鑫卫, 李彦, 等. 农田-防护林-荒漠复合系统土壤水盐运移规律及耦合模型建立[J]. 农业工程学报, 2019, 35(17): 87-101.
[
|
| [29] |
李仙岳, 陈宁, 史海滨, 等. 膜下滴灌玉米番茄间作农田土壤水分分布特征模拟[J]. 农业工程学报, 2019, 35(10): 50-59.
[
|
| [30] |
王印杰, 王玉珉. 非饱和土壤水分函数解析与Richards方程入渗新解[J]. 水文, 1996, 1(2): 1-9, 65.
[
|
| [31] |
吉喜斌, 康尔泗, 陈仁升, 等. 植物根系吸水模型研究进展[J]. 西北植物学报, 2006, 26(5): 1079-1086.
[
|
| [32] |
|
| [33] |
|
| [34] |
陈斌, 鲁延芳, 占玉芳, 等. 荒漠绿洲过渡带土壤水分空间分布特征及对植被的影响[J]. 西北林学院学报, 2023, 38(2): 25-32.
[
|
| [35] |
|
| [36] |
巩炜. 荒漠-绿洲过渡带斑块状植被区土壤水分入渗特征及其影响因素[D]. 兰州: 兰州交通大学, 2022.
[
|
| [37] |
付鹏程, 胡广录, 巩炜, 等. 河西走廊沙漠-绿洲过渡带固沙植物根区土壤物理性质及持水特性[J]. 土壤通报, 2021, 52(4): 811-820.
[
|
| [38] |
孙龙. 三峡库区紫色砂岩区柑橘地优先路径分布及其对溶质运移影响[D]. 北京: 北京林业大学, 2013.
[
|
| [39] |
闫冰, 周智彬, 雷加强, 等. 塔里木沙漠公路防护林带土壤入渗研究[J]. 水土保持学报, 2012, 26(4): 98-103.
[
|
| [40] |
孔东升, 金博文, 金铭, 等. 黑河流域中游农田防护林小气候效应[J]. 干旱区资源与环境, 2014, 28(1): 32-36.
[
|
| [41] |
王新平, 李新荣, 康尔泗, 等. 腾格里沙漠东南缘人工植被区降水入渗与再分配规律研究[J]. 生态学报, 2003, 23(6): 1234-1241.
[
|
| [42] |
付晨馨, 种培芳, 周海, 等. 河西走廊绿洲边缘降水对土壤水分特征的影响[J]. 甘肃农业大学学报, 2023, 58(1): 137-145, 155.
[
|
| [43] |
胡安焱, 付稳东, 陈云飞, 等. 毛乌素沙地不同覆被类型土壤水分动态及其对降水的响应[J]. 水土保持研究, 2023, 30(6): 133-142.
[
|
| [44] |
车宗玺, 李进军, 汪有奎, 等. 祁连山西段草地土壤温度、水分变化特征[J]. 生态学报, 2018, 38(1): 105-111.
[
|
| [45] |
朱丽平, 夏江宝, 赵自国, 等. 温度和粒径分布对贝壳砂土壤水分的影响[J]. 水土保持学报, 2014, 28(6): 268-272, 288.
[
|
| [46] |
崔珍. 压砂地土壤水分、粒径、容重的空间变异及相关性研究[D]. 兰州: 兰州理工大学, 2018.
[
|
| [47] |
张鹏飞, 贾小旭, 赵春雷, 等. 初始容重对土壤水分特征曲线的影响[J]. 干旱区研究, 2022, 39(4): 1174-1180.
[
|
| [48] |
刘冠亨, 吴冠宇, 李建德, 等. 降雨过程中土壤物理结皮入渗情况及当量孔径的变化研究[J]. 干旱区研究, 2023, 40(10): 1608-1614.
[
|
| [49] |
吴凤平, 王辉, 卢霞, 等. 砂石含量及粒径对红壤水分扩散率的影响[J]. 水土保持学报, 2009, 23(2): 228-231.
[
|
/
| 〈 |
|
〉 |