
Impacts of climate change and land use/cover change on the net primary productivity of vegetation in Hexi Region, Northwest China
Received date: 2023-08-16
Revised date: 2023-11-10
Online published: 2024-06-20
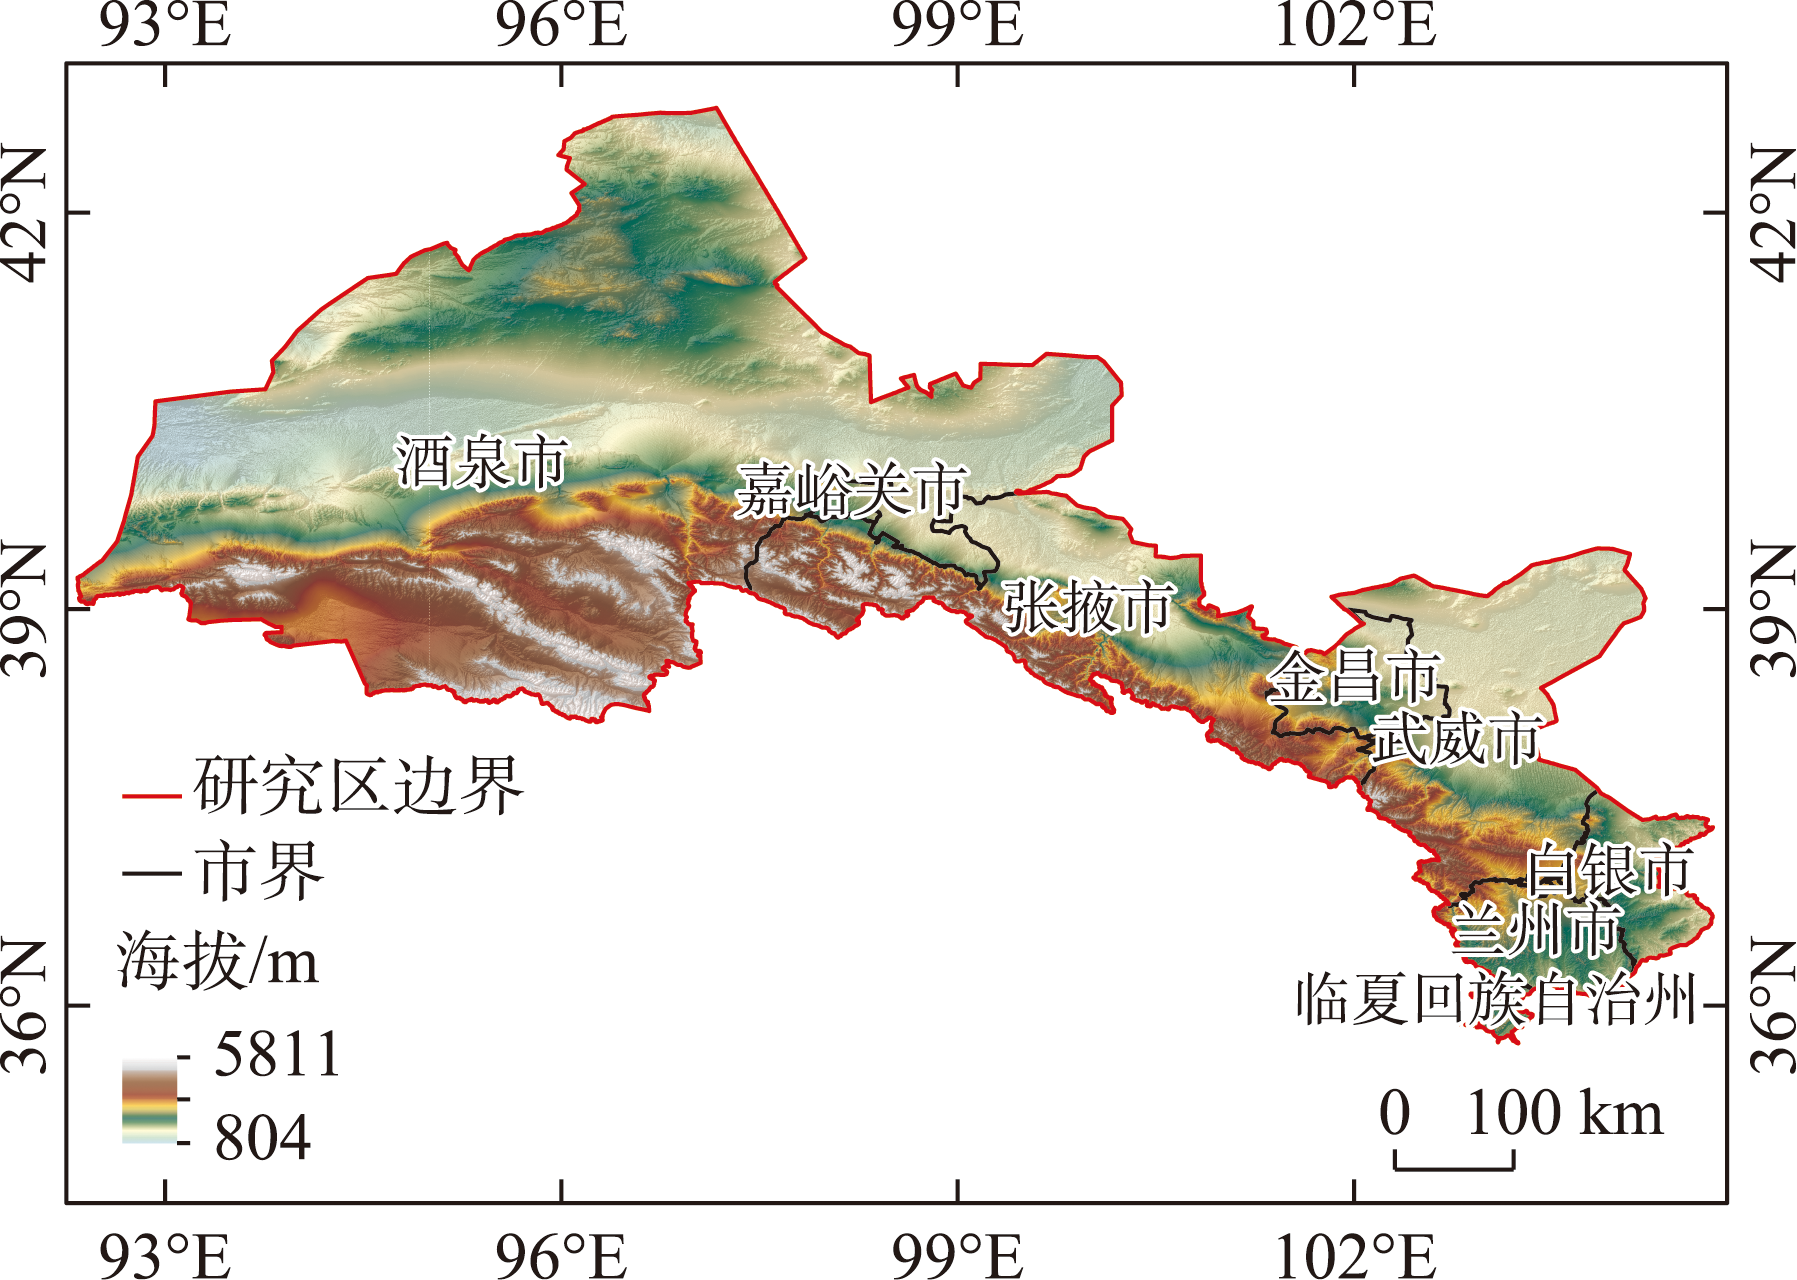
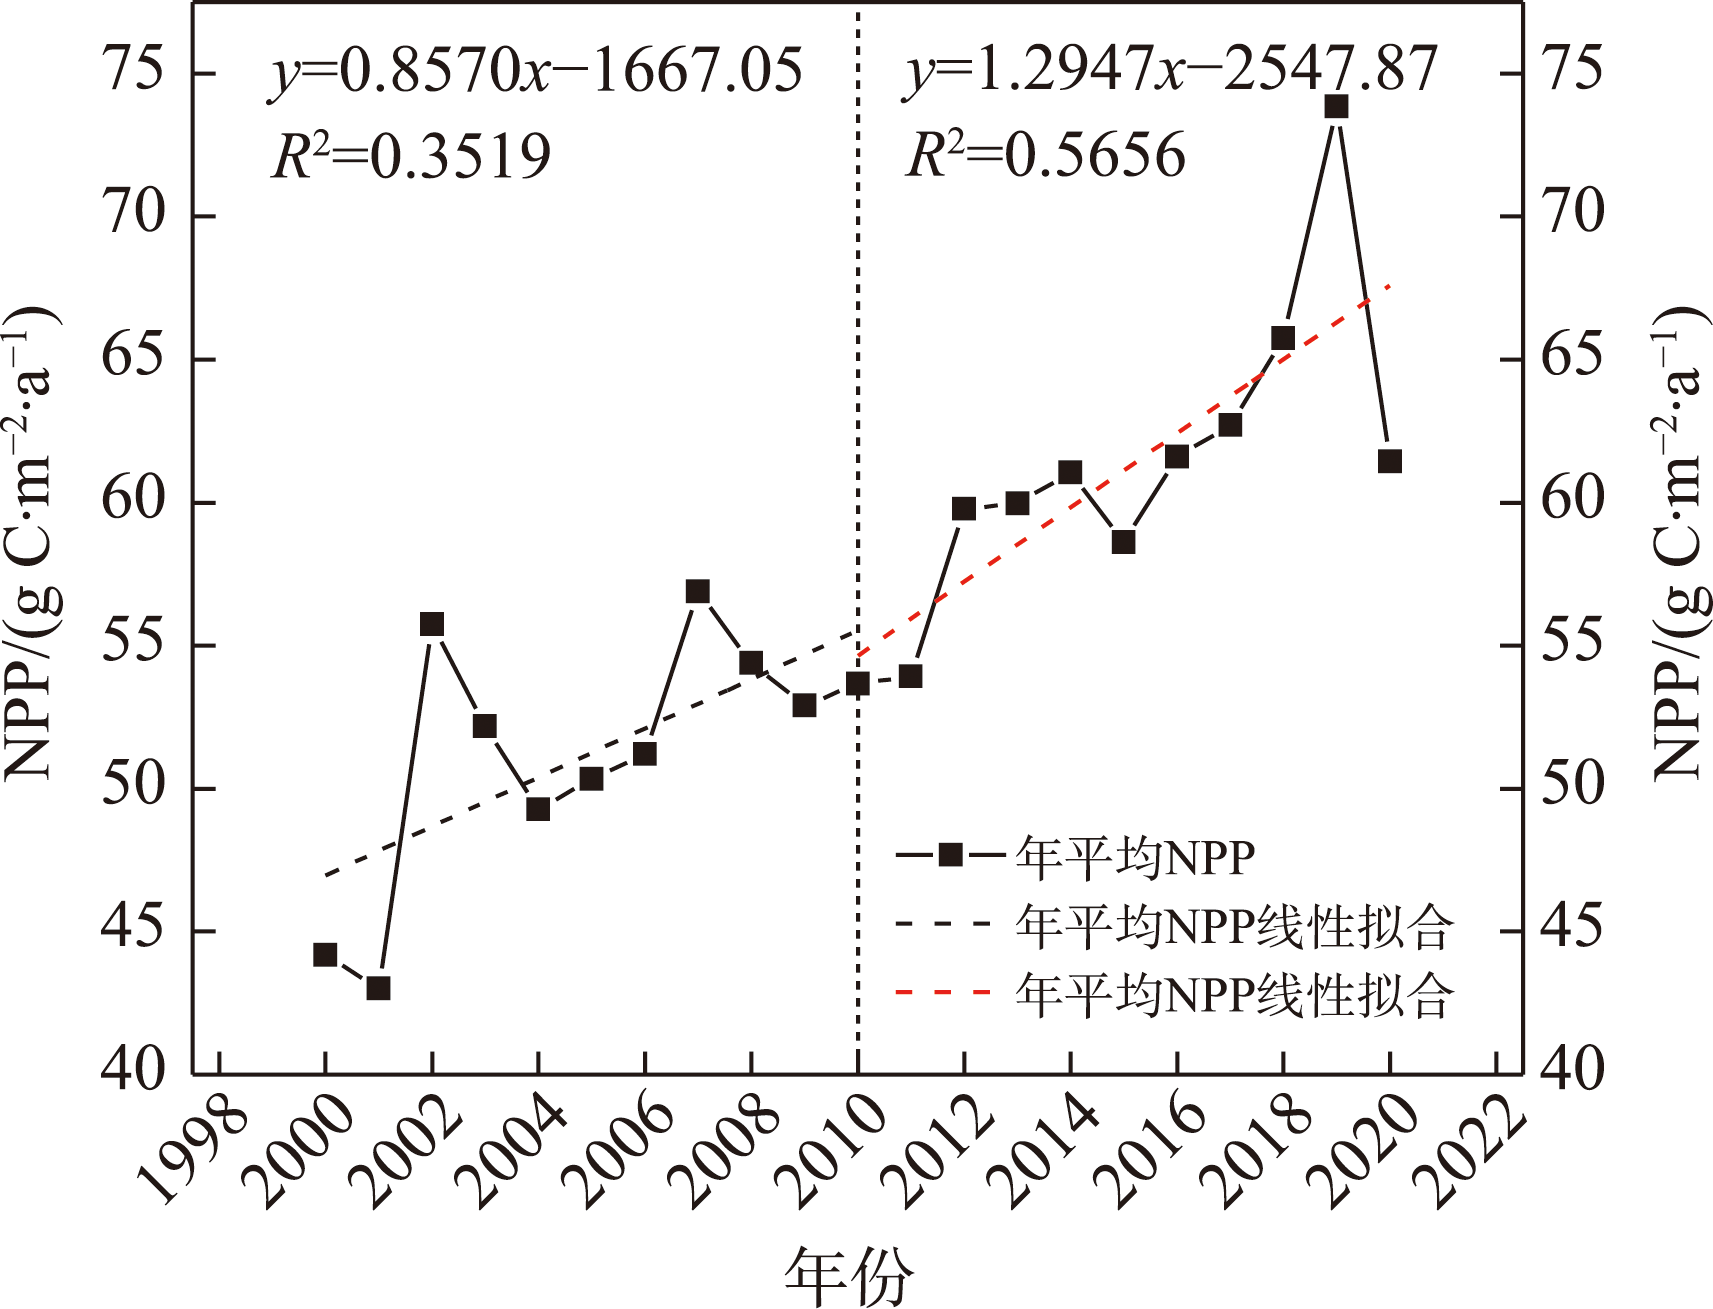
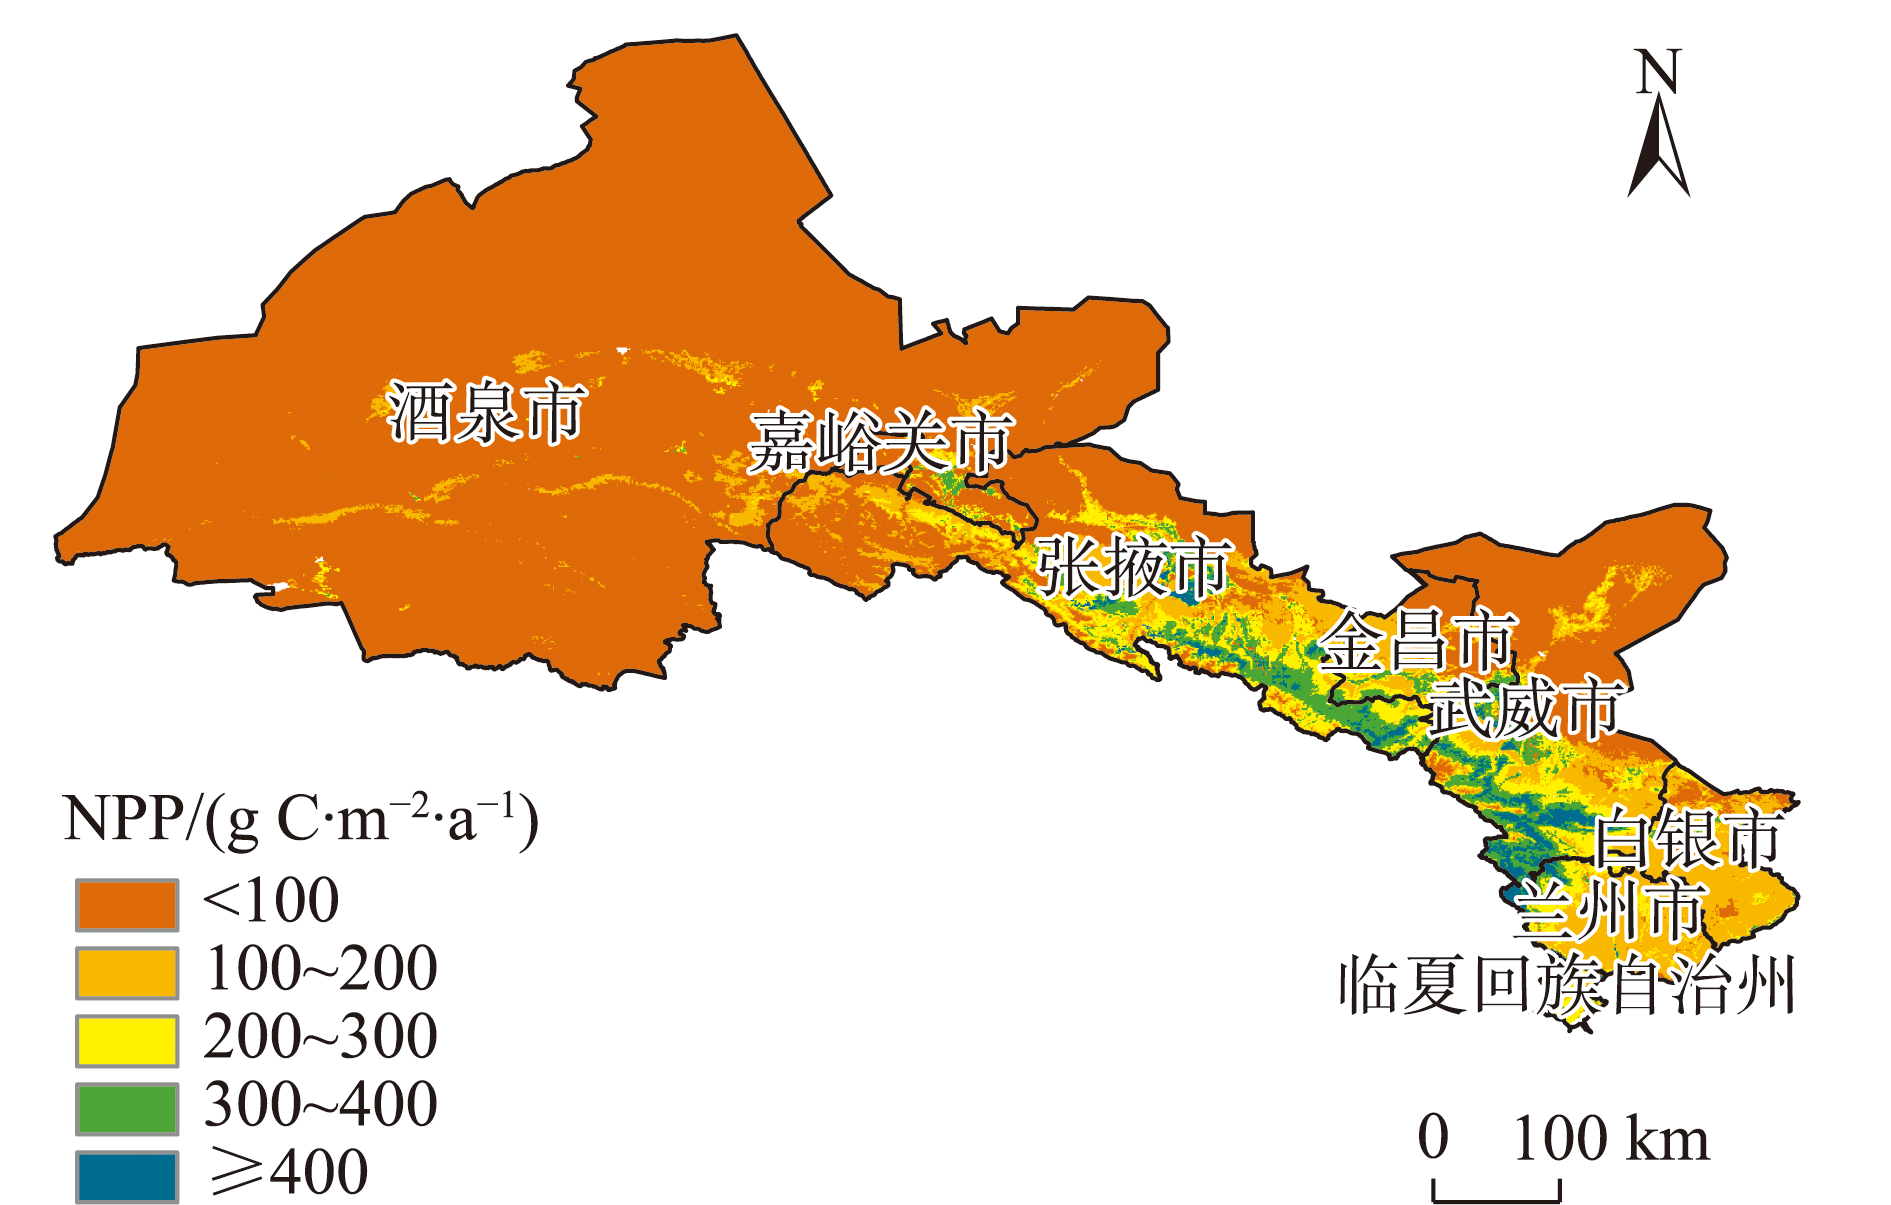
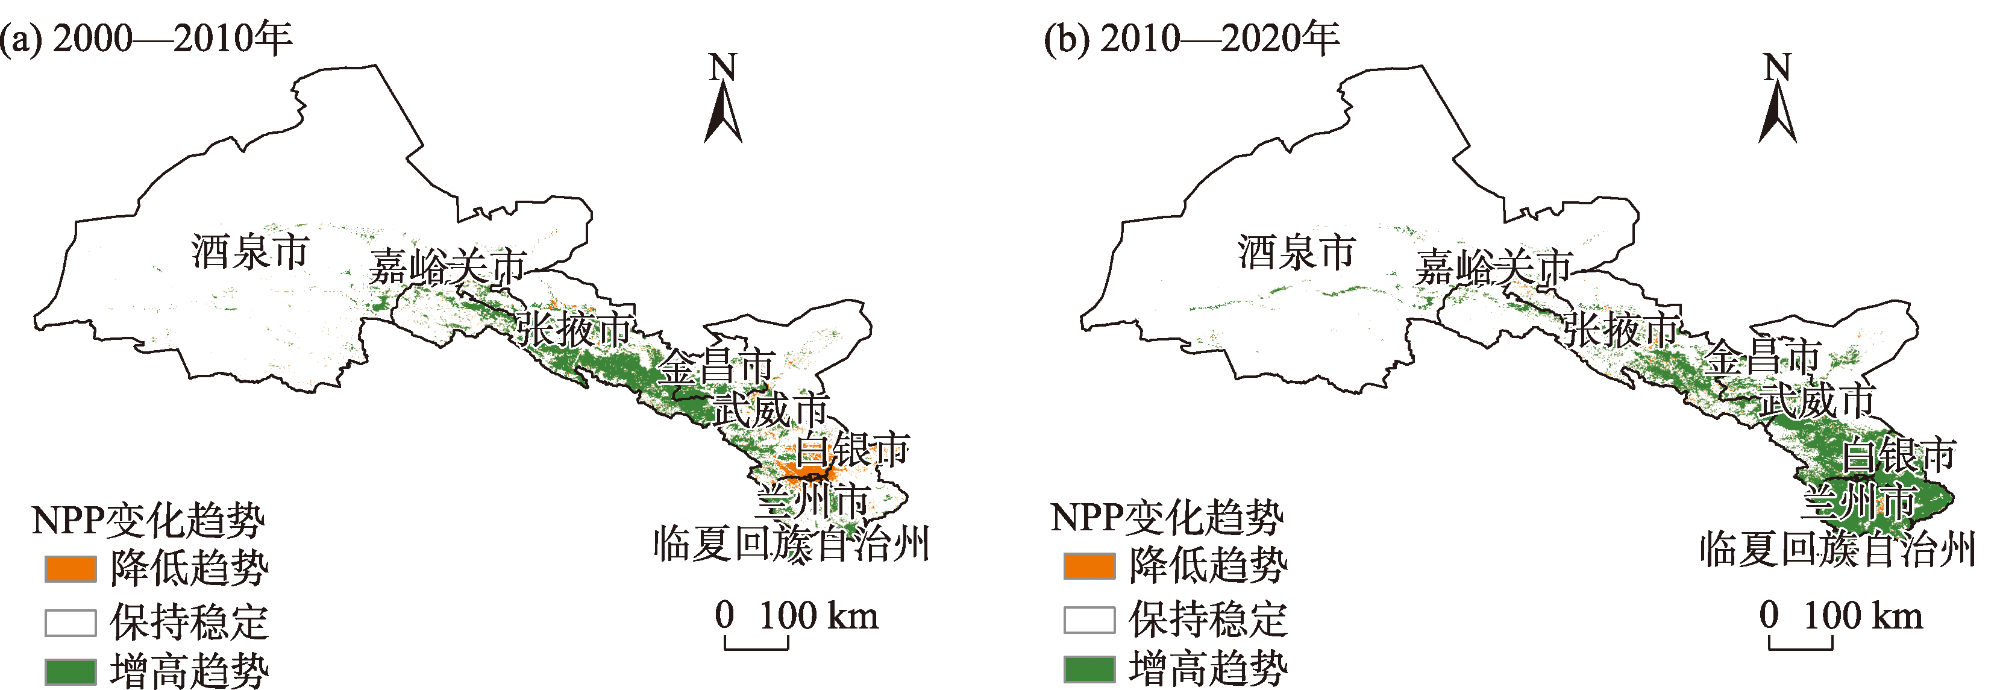
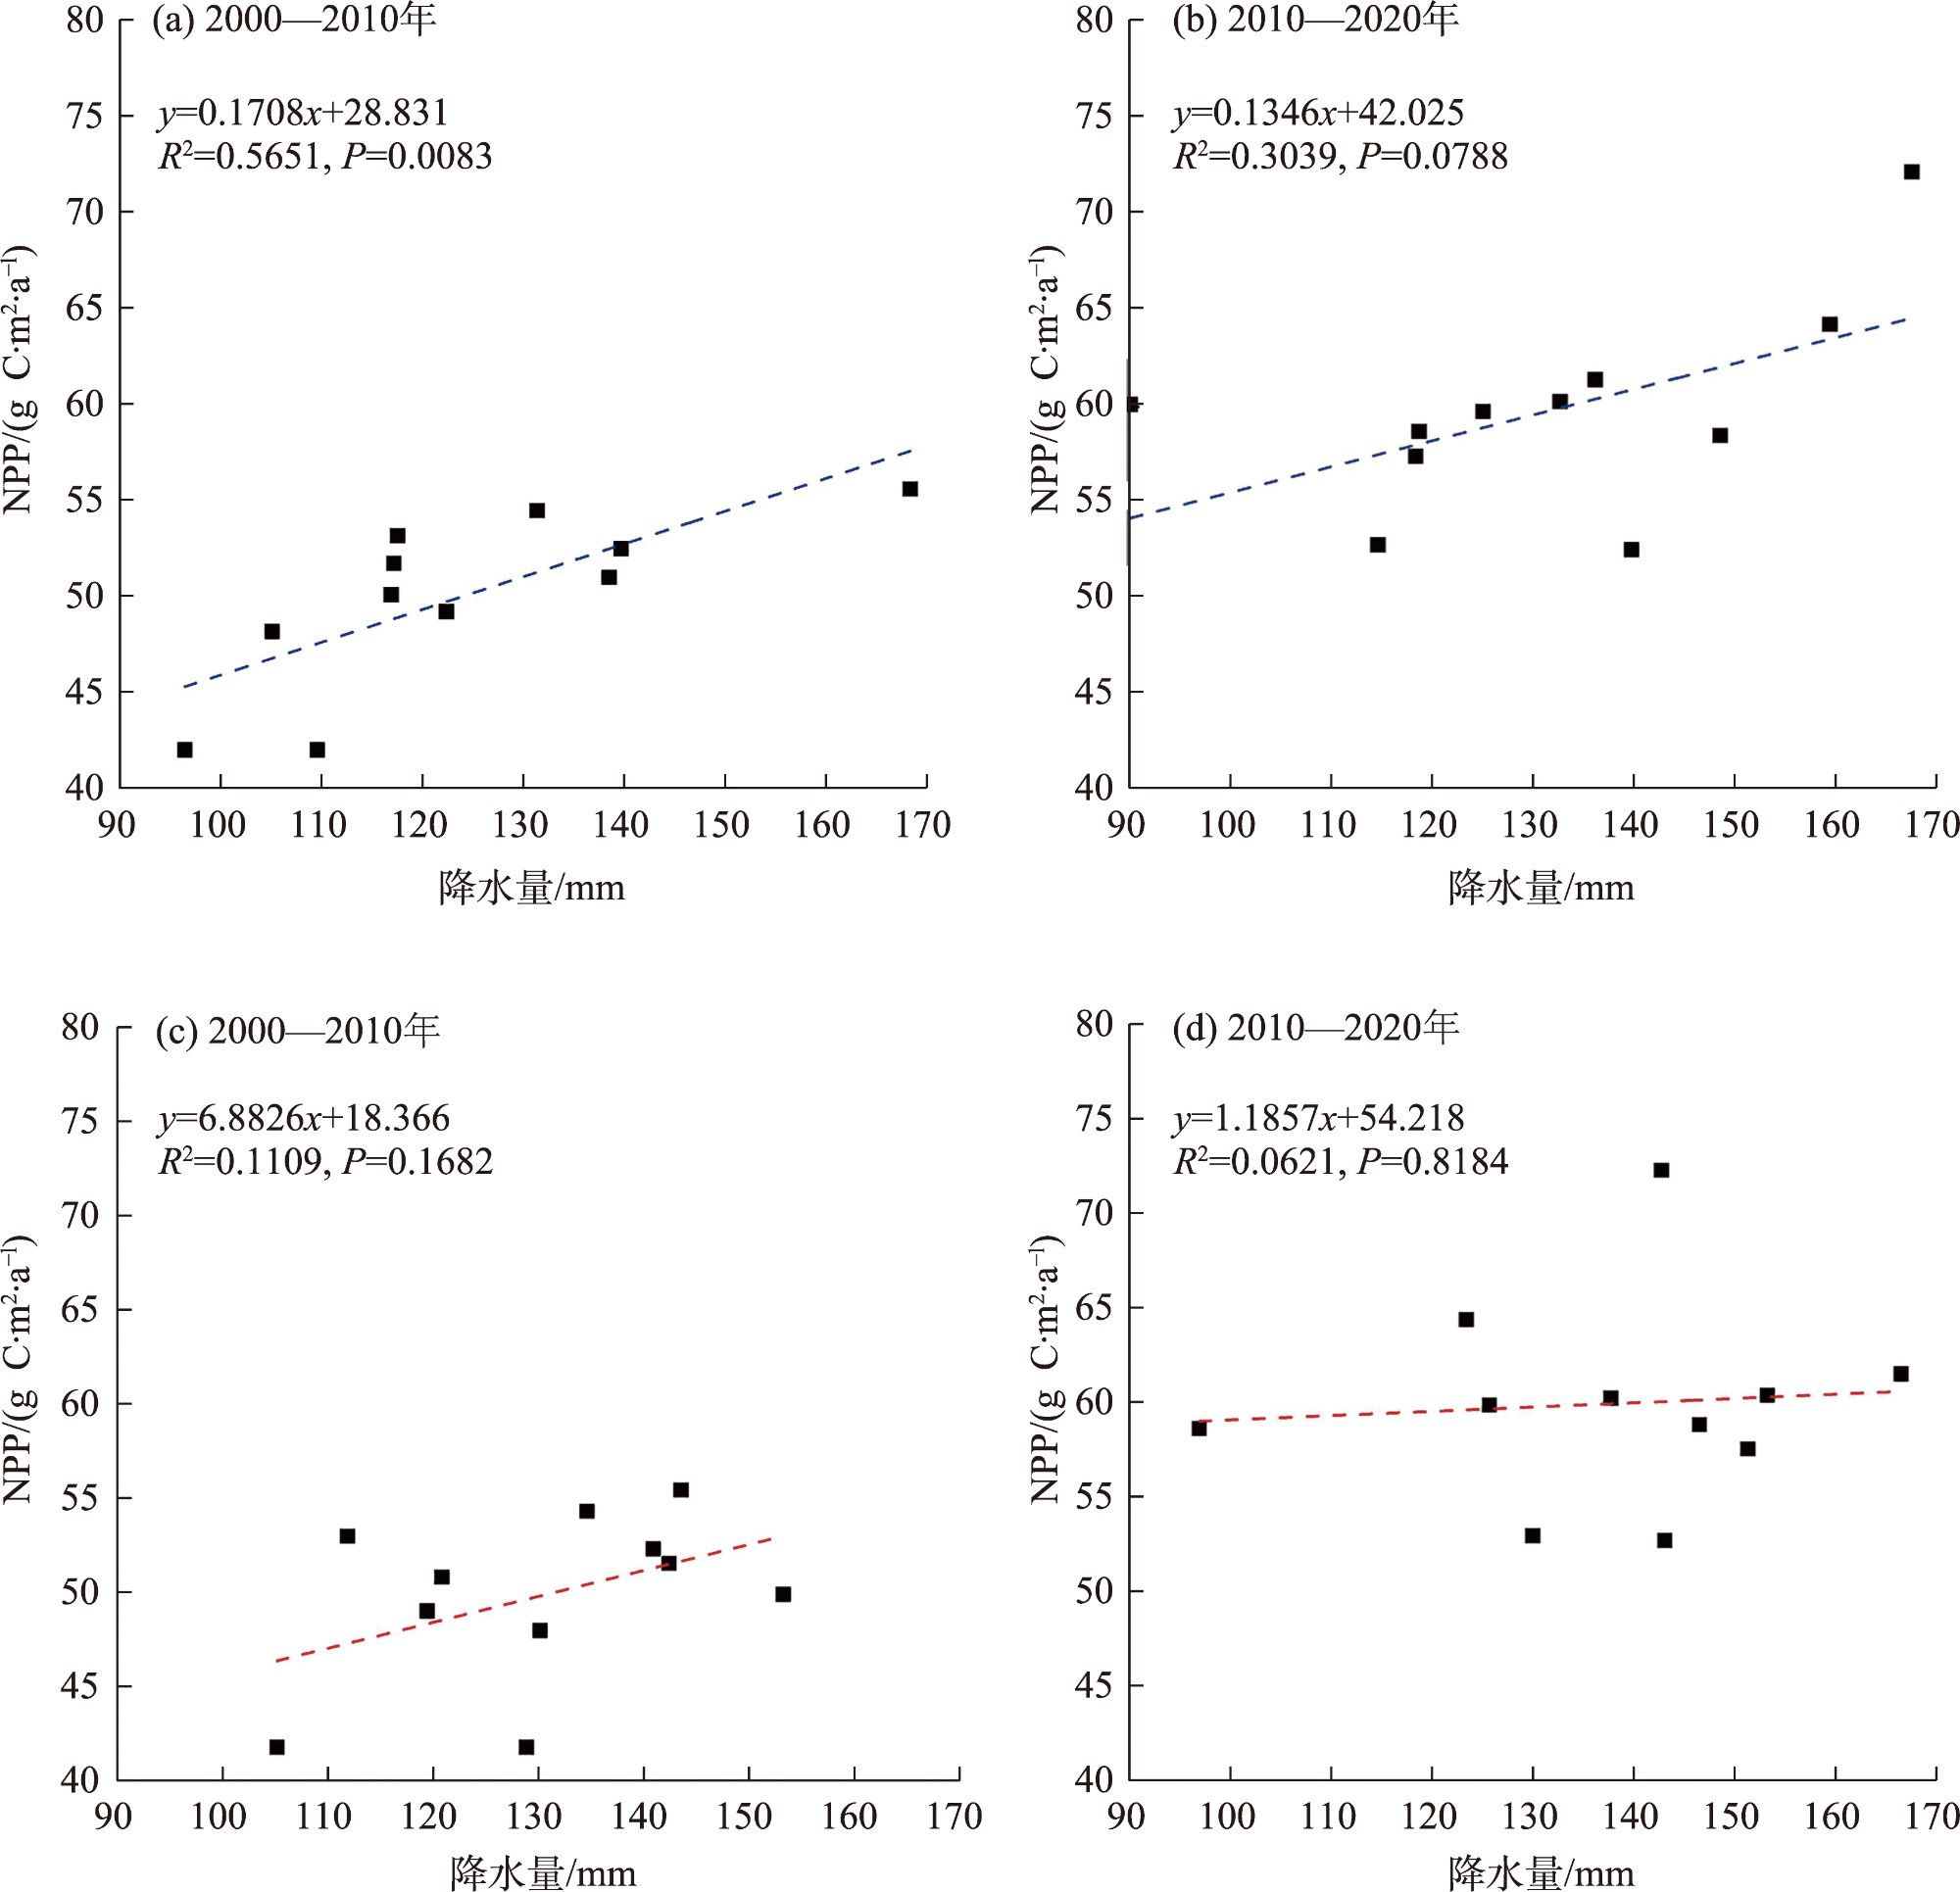
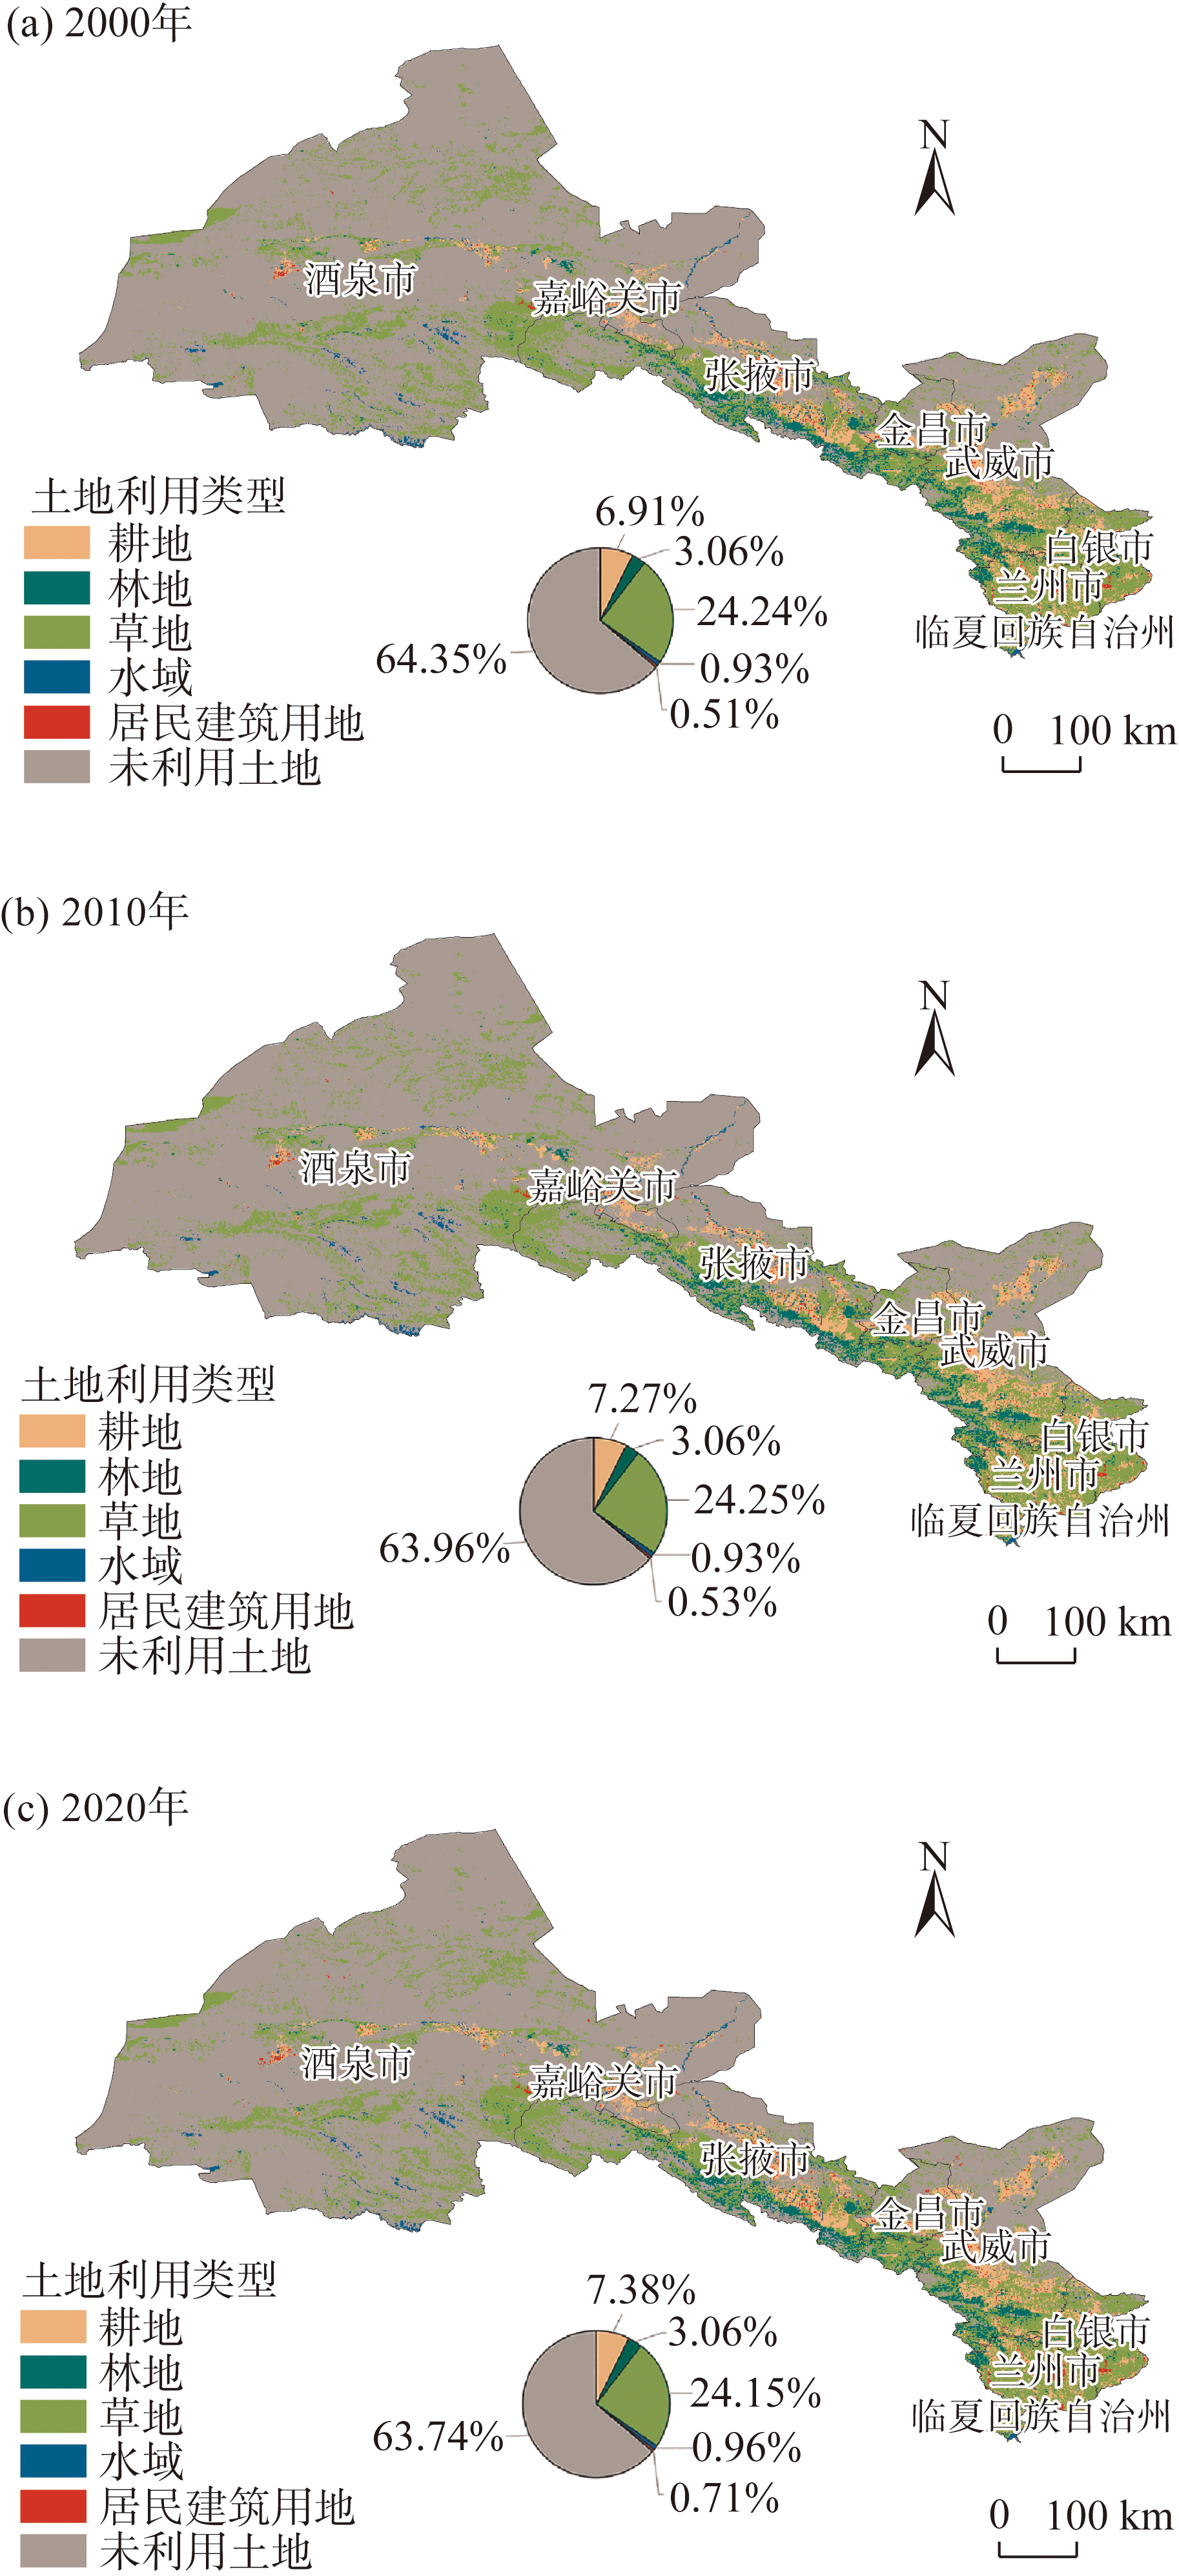
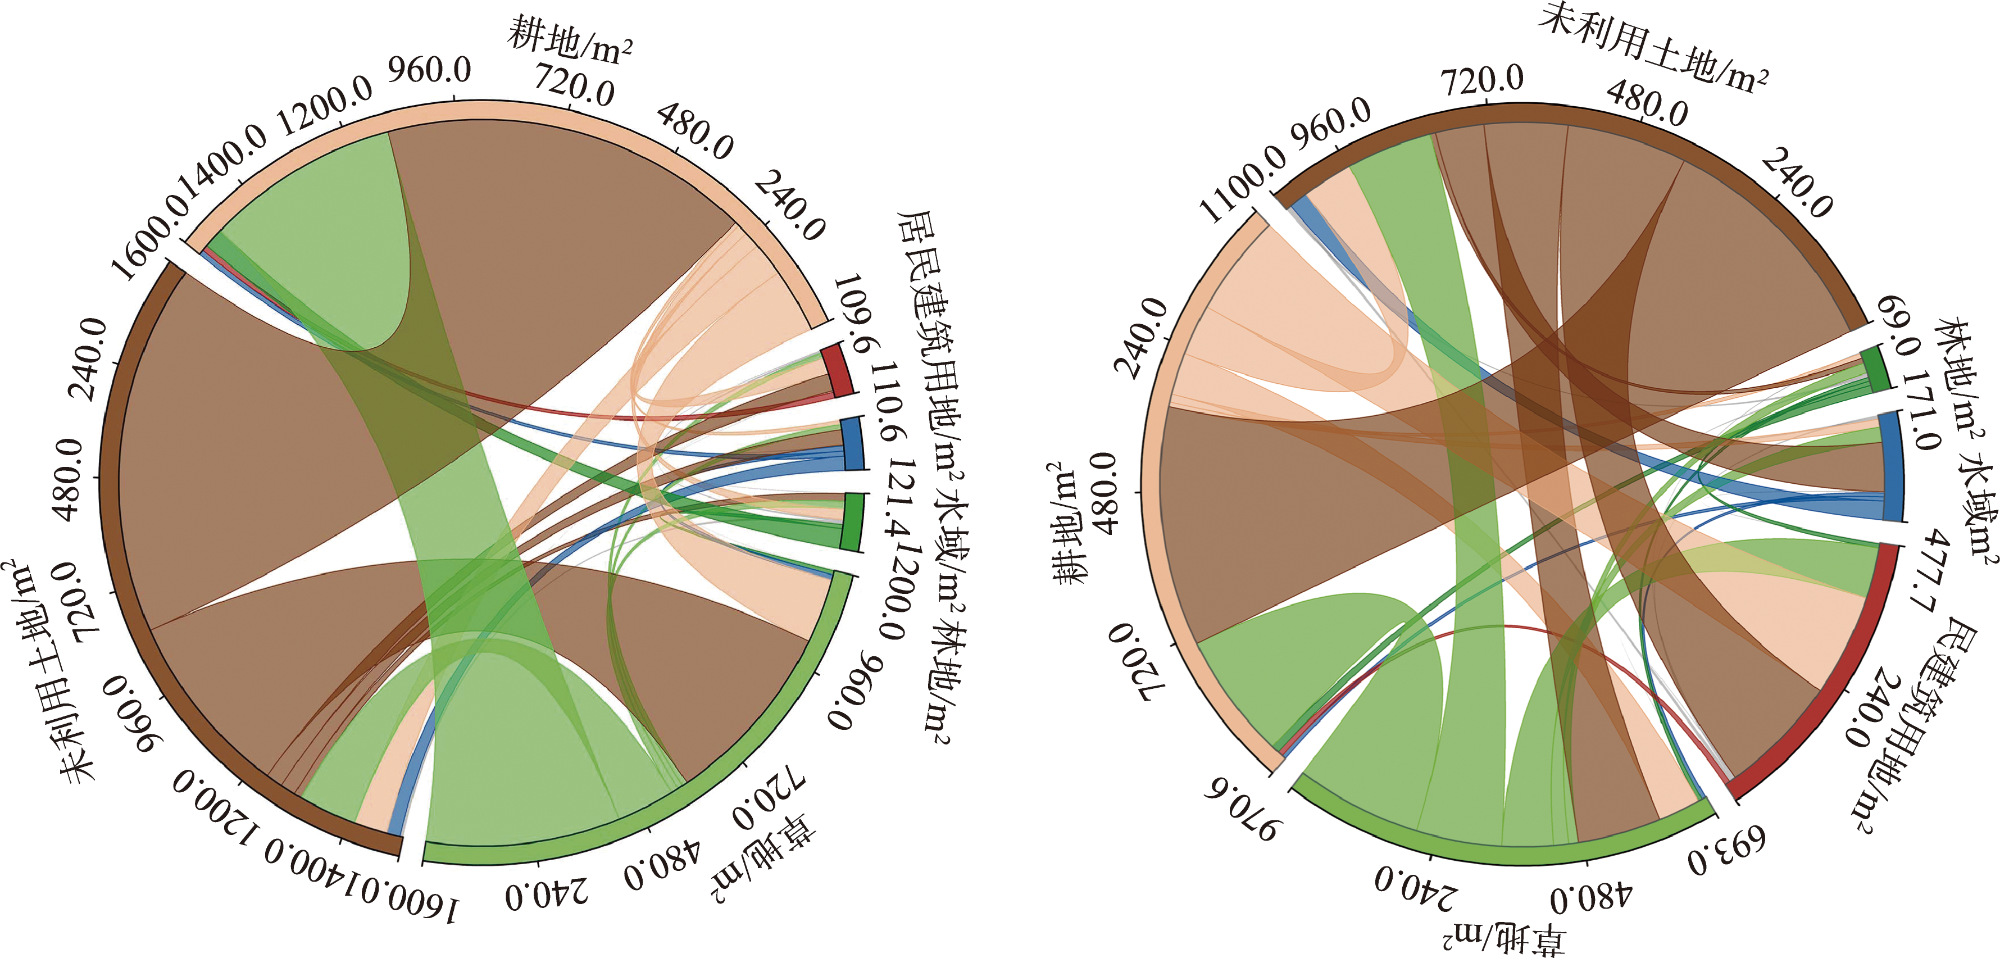
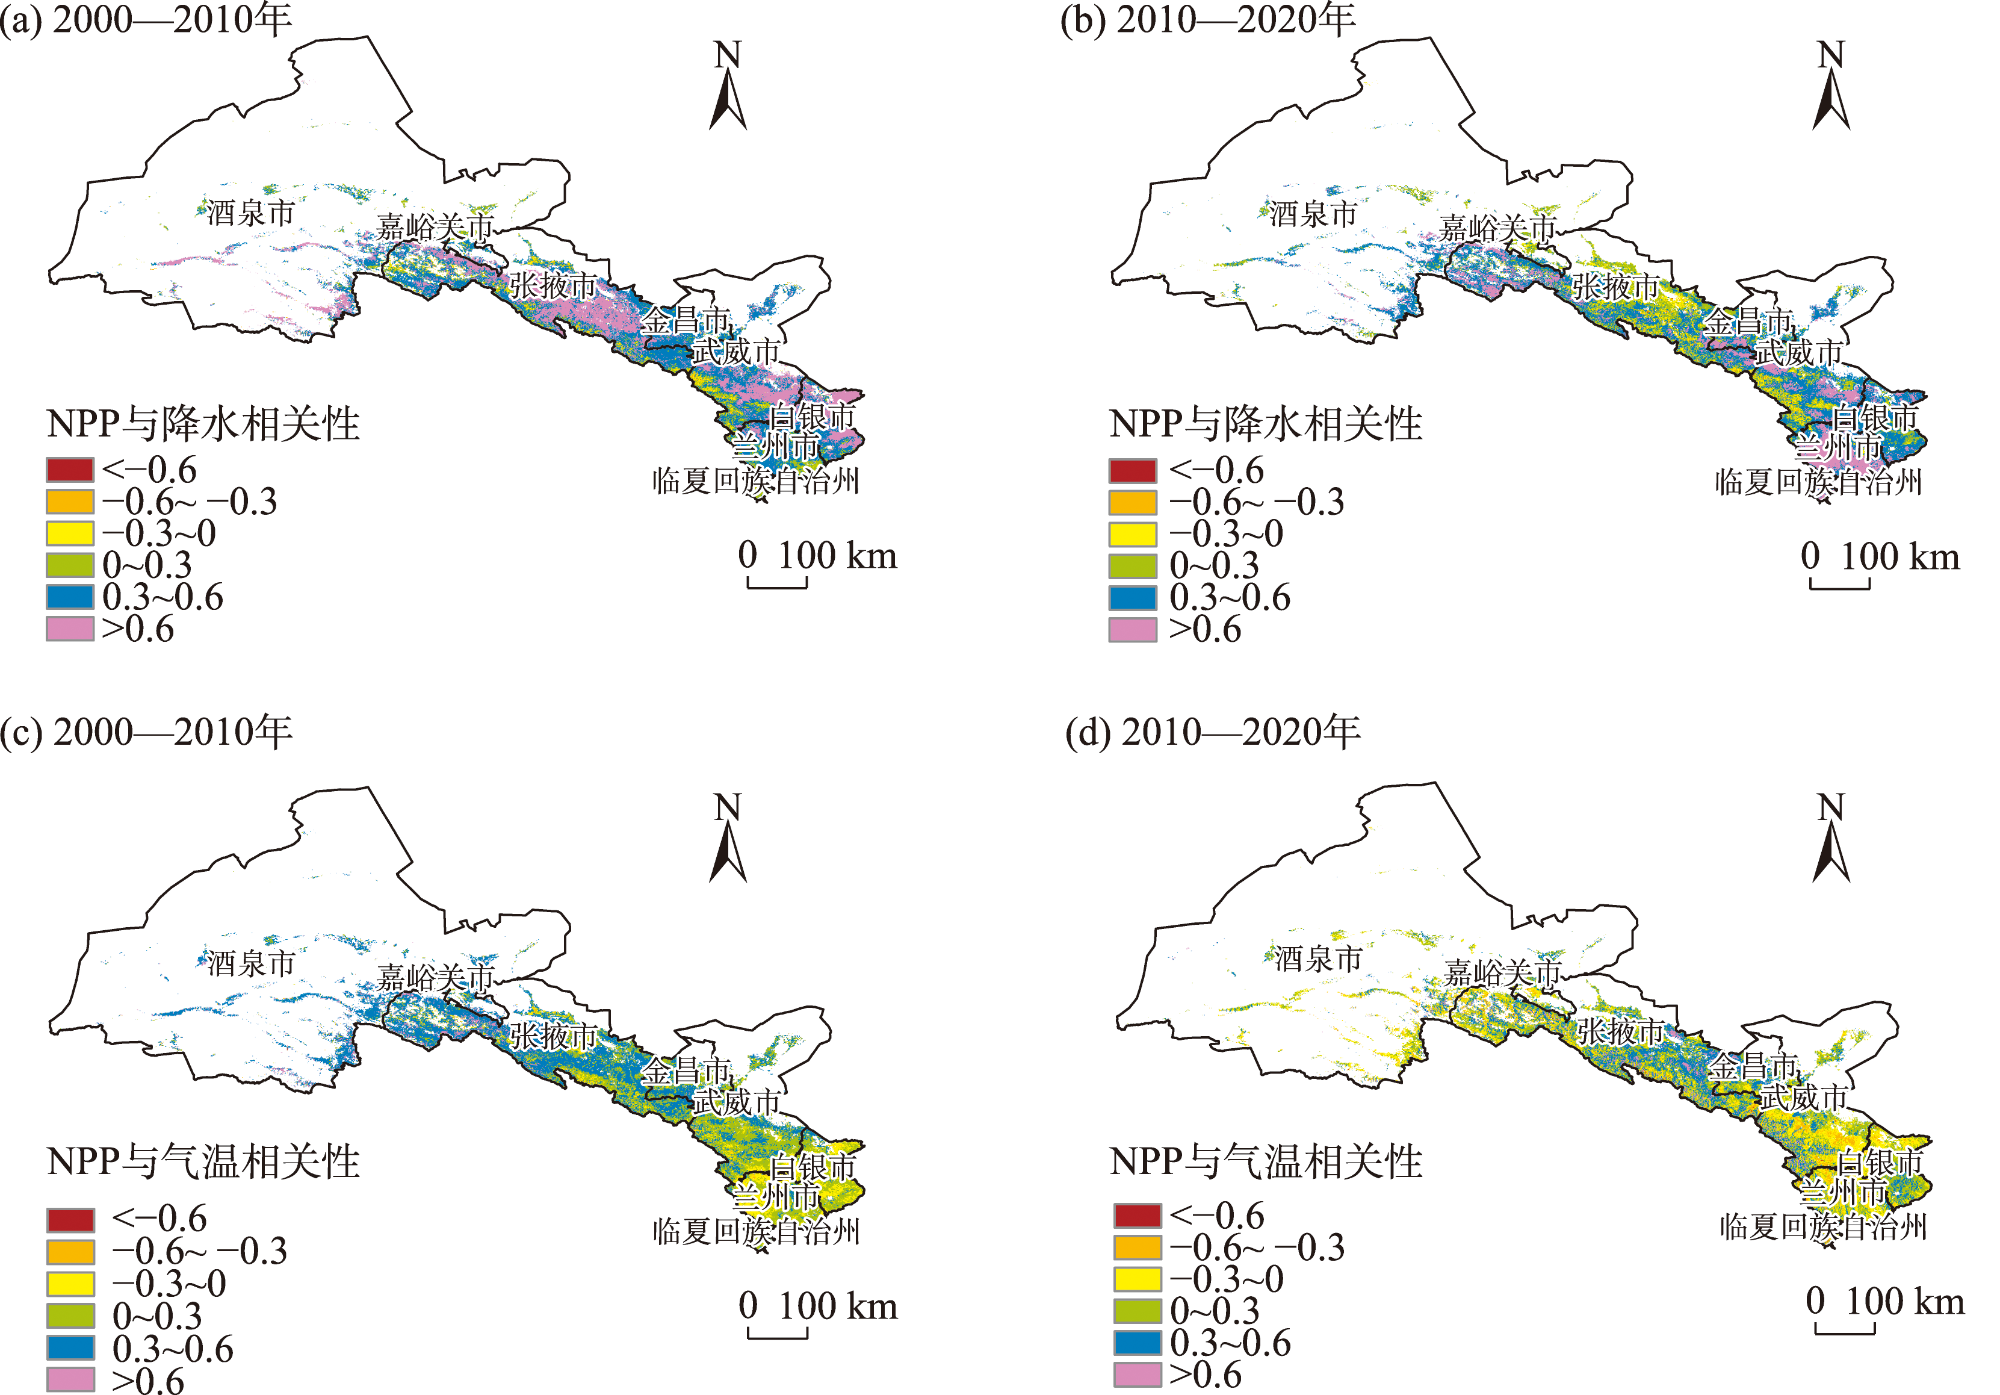
The Hexi Region holds a dual significance in China, being both a pivotal area for ecological security and the core of the Silk Road Economic Belt. The assessment of the net primary productivity (NPP) of the region and a quantitative analysis of the driving forces behind these dynamics bears immense theoretical importance and practical implications. Based on MOD17A3 product, land use cover, and meteorological information, this study scrutinized the evolving characteristics of the vegetation-related NPP, the influence of land use cover changes, and climate fluctuations on the NPP of the Hexi Region from 2000 to 2020. This study employed R-contribution rate and biased correlation analysis methods. The results show that: (1) There was an overall increase in the area of arable land, waters, and residential land in the Hexi Region, while the grassland and unused land area was reduced. The overall dynamics of land use cover change (LUCC) after 2010 was significantly higher, with grassland, cropland, built-up land, and unused land dominating the inter-conversion of land use types. (2) The overall NPP in the Hexi Region increased, with rates of change of 0.86 and 1.29 in the periods 2000-2010 and 2010-2020, respectively. There was a significant regional variation in NPP, which decreased from southeast to northwest. (3) The influence of LUCC on NPP gradually increased from 2000 to 2020. While climate change contributed more to NPP than LUCC, their respective roles varied among land use cover types. Specifically, climate change dominated the influence factor of NPP on cropland, forested land, and grassland, whereas for unutilized land and residential construction areas, LUCC played a more significant role.
LIU Yidan , YAO Xiaojun , LI Zongxing , HU Jiayu . Impacts of climate change and land use/cover change on the net primary productivity of vegetation in Hexi Region, Northwest China[J]. Arid Zone Research, 2024 , 41(1) : 169 -180 . DOI: 10.13866/j.azr.2024.01.16
图3 2000—2020年河西地区平均植被NPP空间分布Fig. 3 Spatial distribution of vegetation NPP in Hexi Region from 2000 to 2020 |
表1 2000—2020年河西地区各市(州)NPP统计Tab. 1 NPP statistics by city (state) in Hexi Region from 2000 to 2020 |
| 市(州) | 不同等级年均NPP占比/% | 年均NPP /(g C·m-2·a-1) | 年NPP /(106 g C·m-2·a-1) | ||||
|---|---|---|---|---|---|---|---|
| <100 | 100~200 | 200~300 | 300~400 | ≥400 | |||
| 兰州* | 2.80 | 65.82 | 20.75 | 5.36 | 5.27 | 200.83 | 54.85 |
| 白银* | 15.02 | 75.05 | 7.11 | 2.57 | 0.25 | 135.18 | 32.94 |
| 临夏 | 1.07 | 23.20 | 67.68 | 6.31 | 1.75 | 232.59 | 8.59 |
| 武威 | 53.68 | 16.21 | 12.76 | 11.75 | 5.60 | 123.42 | 123.96 |
| 金昌 | 42.05 | 34.34 | 13.55 | 9.91 | 0.15 | 125.61 | 29.81 |
| 张掖 | 43.23 | 23.95 | 17.47 | 12.72 | 2.63 | 143.98 | 173.43 |
| 酒泉 | 96.77 | 2.49 | 0.50 | 0.24 | 0.00 | 7.07 | 37.84 |
| 嘉峪关 | 92.18 | 3.91 | 2.69 | 1.22 | 0.00 | 15.43 | 0.60 |
| 合计 | 76.53 | 12.36 | 5.91 | 3.96 | 1.24 | 984.11 | 462.02 |
注:兰州*指兰州市部分地区,包括红古区、永登县和皋兰县;白银*指白银市部分地区,包括白银区、平川区和景泰县。 |
表2 不同时期土地利用类型的年平均净初级生产力Tab. 2 Annual average NPP by LULC types at different time periods |
| 年份 | 不同土地利用类型年平均净初级生产力/(g C·m-2·a-1) | |||||
|---|---|---|---|---|---|---|
| 耕地 | 林地 | 草地 | 水域 | 居民建筑用地 | 未利用土地 | |
| 2000年 | 166.60 | 228.88 | 72.27 | 53.66 | 134.94 | 7.56 |
| 2010年 | 195.93 | 280.28 | 90.83 | 69.93 | 157.97 | 9.72 |
| 2020年 | 228.72 | 298.92 | 105.57 | 78.13 | 156.05 | 10.57 |
| 平均 | 197.08 | 269.36 | 89.56 | 67.24 | 149.65 | 9.28 |
表3 不同土地利用类型对2000—2020年总植被净初级生产力的影响量和贡献率Tab. 3 Influence and contribution of different LULC types to the total NPP from 2000 to 2020 |
| 土地利用类型 | 影响因素 | 2000—2010年 | 2010—2020年 | |||
|---|---|---|---|---|---|---|
| 影响量/(Tg C) | 贡献率/% | 影响量/(Tg C) | 贡献率/% | |||
| 耕地 | 气候变化 | 56.39 | 73.78 | 66.42 | 90.49 | |
| LUCC | 17.04 | 22.28 | 5.98 | 8.15 | ||
| 林地 | 气候变化 | 43.82 | 99.68 | 15.89 | 98.69 | |
| LUCC | -0.11 | 0.26 | -0.19 | 1.24 | ||
| 草地 | 气候变化 | 125.26 | 99.85 | 99.55 | 96.97 | |
| LUCC | 0.15 | 0.12 | -2.59 | 2.69 | ||
| 水域 | 气候变化 | 4.23 | 97.70 | 2.12 | 76.21 | |
| LUCC | -0.07 | 1.80 | 0.59 | 21.28 | ||
| 居民建筑用地 | 气候变化 | 3.24 | 77.06 | -0.28 | 3.73 | |
| LUCC | -0.28 | 6.69 | 7.91 | 95.24 | ||
| 未利用土地 | 气候变化 | 38.64 | 97.26 | 15.20 | 95.84 | |
| LUCC | -0.83 | 2.19 | -0.58 | 3.99 | ||
| [1] |
|
| [2] |
程淑兰, 方华军, 徐梦, 等. 氮沉降增加情景下植物-土壤-微生物交互对自然生态系统土壤有机碳的调控研究进展[J]. 生态学报, 2018, 38(23): 8285-8295.
[
|
| [3] |
赵苗苗, 刘熠, 杨吉林, 等. 基于HASM的中国植被NPP时空变化特征及其与气候的关系[J]. 生态环境学报, 2019, 28(2): 215-225.
[
|
| [4] |
|
| [5] |
|
| [6] |
|
| [7] |
凡晚晴, 吴华, 樊风雷. 近20年来西藏地区NPP时空变化及影响因素[J]. 水土保持通报, 2022, 42(6): 378-386.
[
|
| [8] |
李飞, 赵军, 赵传燕, 等. 中国西北干旱区潜在植被模拟与动态变化分析[J]. 草业学报, 2011, 20(4): 42-50.
[
|
| [9] |
周广胜, 王玉辉. 全球变化与气候-植被分类研究和展望[J]. 科学通报, 1999, 44(24): 2587-2593.
[
|
| [10] |
王景升, 张宪洲, 赵玉萍, 等. 藏北羌塘高原气候变化的时空格局[J]. 资源科学, 2008, 30(12): 1852-1859.
[
|
| [11] |
薛梅, 陈芸芝, 闫敏, 等. 中国东北地区植被NPP模拟与时空变化分析[J]. 福州大学学报(自然科学版), 2018, 46(6): 821-830.
[
|
| [12] |
孔春芳, 岳永财, 徐凯. 2000—2015年江汉平原区域植被NPP时空特征及其对气候变化的响应[J]. 长江流域资源与环境, 2019, 28(6): 1460-1469.
[
|
| [13] |
朴世龙, 方精云, 郭庆华. 利用CASA模型估算我国植被净第一性生产力[J]. 植物生态学报, 2001, 25(5): 603-608.
[
|
| [14] |
赵晓, 周文佐, 田罗, 等. 土地利用变化对三峡库区重庆段植被净初级生产力的影响[J]. 生态学报, 2018, 38(21): 7658-7668.
[
|
| [15] |
彭月月, 魏妍冰, 李启权, 等. 气候和土地利用变化对成都市植被NPP时空分布的影响[J]. 西南大学学报(自然科学版), 2018, 40(11): 150-159.
[
|
| [16] |
蔡小青, 刘凤. 三江源区植被生产力时空格局及其变化特征[J]. 灌溉排水学报, 2021, 40(Suppl.): 56-59, 62.
[
|
| [17] |
|
| [18] |
|
| [19] |
鲁晖, 董敬儒, 贺思嘉, 等. 2000—2017年河西地区山地-绿洲- 荒漠系统植被变化趋势与可持续性分析[J]. 兰州大学学报(自然科学版), 2021, 57(1): 99-108.
[
|
| [20] |
窦睿音, 延军平, 王鹏涛. 全球变化背景下甘肃近半个世纪气温时空变化特征[J]. 干旱区研究, 2015, 32(1): 73-79.
[
|
| [21] |
王旭阳, 常跟应. 1998—2018年河西走廊农业生产地区专业化时空演变分析[J]. 兰州大学学报(自然科学版), 2022, 58(2): 186-194.
[
|
| [22] |
戴尔阜, 方创琳. 甘肃河西地区生态问题与生态环境建设[J]. 干旱区资源与环境, 2002, 16(2): 1-5.
[
|
| [23] |
高振荣, 田庆明, 刘晓云, 等. 近58年河西走廊地区气温变化及突变分析[J]. 干旱区研究, 2010, 27(2): 194-203.
[
|
| [24] |
谭淼, 周启刚. 2000—2015年典型山地区域净初级生产力时空分布特征[J]. 水土保持研究, 2019, 26(6): 339-346.
[
|
| [25] |
|
| [26] |
李登科, 王钊. 基于MOD17A3的中国陆地植被NPP变化特征分析[J]. 生态环境学报, 2018, 27(3): 397-405.
[
|
| [27] |
|
| [28] |
|
| [29] |
|
| [30] |
|
| [31] |
|
| [32] |
肖桐, 刘纪远, 邵全琴. 近20年青海三江源自然保护区植被生产力变化模拟[J]. 地球信息科学学报, 2009, 11(5): 5557-5565.
[
|
| [33] |
|
| [34] |
|
| [35] |
|
| [36] |
王凌阁, 朱睿, 陈泽霞, 等. 甘肃河西地区2000—2019年水土资源耦合协调特征[J]. 中国沙漠, 2022, 42(2): 44-53.
[
|
| [37] |
刘春雨, 董晓峰, 刘英英, 等. 甘肃省季节性净初级生产力变化特征[J]. 遥感信息, 2017, 32(5): 102-110.
[
|
| [38] |
|
| [39] |
|
| [40] |
王莉雯, 卫亚星, 牛铮. 净初级生产力遥感估算模型空间尺度转换[J]. 遥感学报, 2010, 14(6): 1074-1089.
[
|
| [41] |
|
| [42] |
|
| [43] |
李婷婷, 马超, 郭增长. 2004—2015年贺兰山自然保护区植被NPP时空变化与气候响应[J]. 水土保持研究, 2020, 27(6): 254-261.
[
|
/
| 〈 |
|
〉 |